Front end monitoring: obtain user behavior and track the use of products at the user end, and indicate the direction of product optimization based on the monitoring data.
Front end monitoring can be divided into three categories:
- Data monitoring
- Performance monitoring
- Abnormal monitoring
Data monitoring
Data monitoring is to monitor the user's behavior. Common monitoring items include:
- PV/UV: PV(page view): page views or hits; UV: refers to the number of people who visit a site or click on different IP addresses of a news item
- User's dwell time on each page
- What portal does the user access the web page through
- The behavior triggered by the user in the corresponding page
It is meaningful to count these data. For example, we know the channels of users' sources, which can promote the promotion of products, know the time users stay on each page, and increase advertising push for pages that stay longer.
Statistics such as Baidu statistics, cnzz, etc
Performance monitoring
Performance monitoring refers to monitoring the performance of the front end, mainly including monitoring the experience of web pages or products on the user side. Common performance monitoring items include:
- First screen loading time under different users, different models and different systems
- White screen time
- Response time of http and other requests
- Overall download time of static resources
- Page rendering time
- Completion time of page interactive animation
These performance monitoring results can show the front-end performance. According to the performance monitoring results, we can further optimize the front-end performance, such as compatible with the animation effect of lower version browsers, speeding up the first screen loading, and so on.
For example, chrome plug-in Lighthouse, etc
Abnormal monitoring
Because the front-end code of the product will also have exceptions during execution, exception monitoring needs to be introduced. Timely reporting of abnormal conditions can avoid the occurrence of online faults. Although most exceptions can be caught by {try catch}, memory leaks and other occasional exceptions are difficult to catch. Common exceptions that need to be monitored include:
- Javascript exception monitoring
- Abnormal monitoring of style loss
For example, through the window Onerror collects all uncapped exceptions, constructs a 404 HTTP request through "new Image", and finally filters access in real time on the server Log and count the matching requests.
 <head>
    <script>
      window.addEventListener(
        "error",
        function (r) {
          var e = r.target;
          e instanceof HTMLElement &&
            /link|script/.test(e.tagName.toLowerCase()) &&
            ((window.__sourceError = window.__sourceError || []),
            window.__sourceError.push(r));
        },
        !0
      );
    </script>
</head>

 <script>
  // Handle the collected resource load exception data
      var sum = 0;
      window.addEventListener("DOMContentLoaded", function () {
        if (
          window.__sourceError &&
          window.__sourceError.length &&
          window.__sourceError.length > 0
        ) {
          window.__sourceError.forEach(function (item) {
            console.log(
              new Error("A resource loading error has occurred"),
              "filename:",
              item.target.outerHTML || item.target.src
            );
            console.log("static-error-404");
            sum++;
          });
        }
      });
//You can use new image() SRC, etc
 </script>
Front buried point
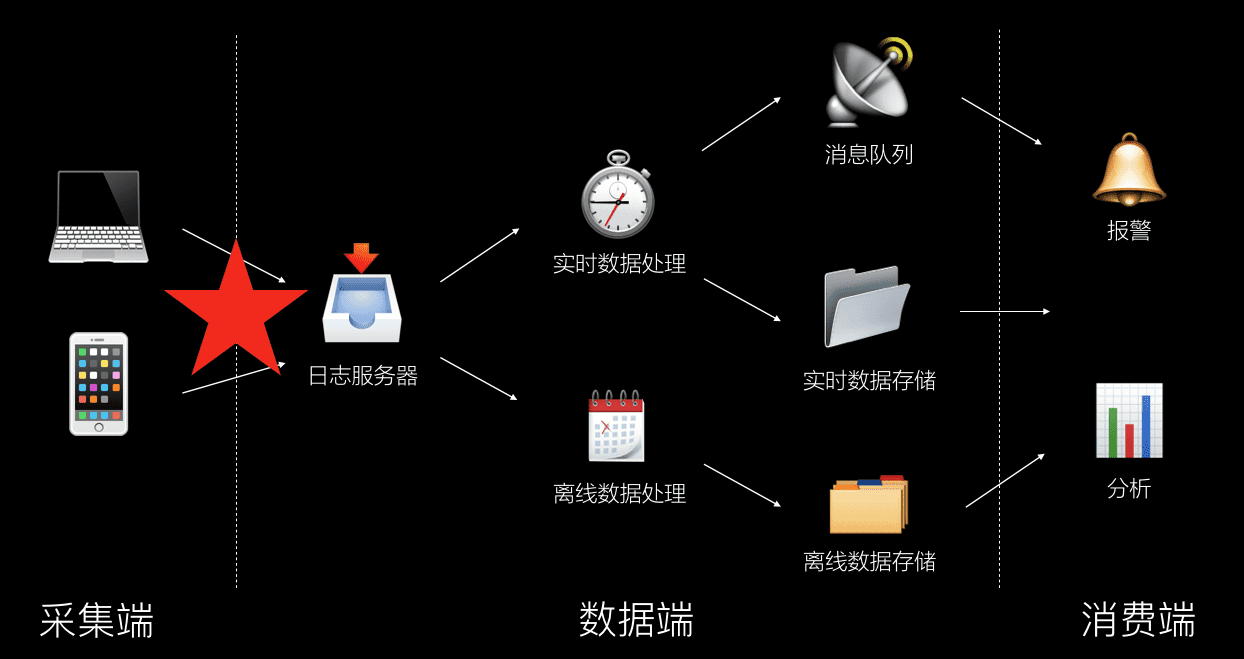
Having finished the three categories of front-end monitoring, let's talk about how to realize front-end monitoring. To realize front-end monitoring, the first step must be to collect the matters (data) we want to monitor, submit them to the background, and finally analyze the data. The richness and accuracy of data collection will directly affect the quality of front-end monitoring, because we will take this as the basis to guide the future development of products.
We collect monitoring data through front-end buried points. At present, there are three common front-end buried points: manual buried points, visual buried points and no buried points.
Manual embedding point
Manual embedding point is also called code embedding point, that is, write code purely manually, call the function of the embedding point SDK, call the interface at the business logic function location where the embedding point is required, and report the embedding point data, such as umeng ,Baidu statistics And other third-party data statistics service providers mostly adopt this scheme.
Manual embedding allows users to easily set custom attributes and events; Therefore, when you need to drill in depth and refine custom analysis, it is more suitable to use manual buried points.
The defect of manual burying points is that the project has a large amount of work, there are too many locations for burying points, and it requires repeated communication between product development and operation, which is prone to manual errors. If there are errors, the cost of re burying points is also very high. This will lead to a long data collection cycle, high collection cost and low efficiency. Because the manual embedding needs to be completed by developers, every time there is a buried point update or missing buried point, it needs to go through the online publishing process again, the update cost is also high, and it is also harmful to the stability of the online system.
Visual buried point
By means of visual interaction, the above code embedding points are replaced. Separate the business code from the buried point code and provide a visual interactive page. The input is the business code. Through this visual system, the buried point events can be customized in the business code. Finally, the output code couples the business code and the buried point code. The disadvantage is that the controls that can be buried are limited and cannot be customized manually.
The visual buried point sounds tall, but it is actually not very different from the code buried point. That is to use a system to realize the process of manually inserting code embedding points. For example, visualization was done earlier in foreign countries Mixpanel In China, the earlier ones that support visual buried points are TalkingData,Zhuge IO , 2017 Tencent MTA Also announced support for visual burial points; Compared with the difficulty and high cost of manual buried point update, visual buried point optimizes the data acquisition process in mobile operation, and can support the product operation to adjust the buried point at any time. There is no need to follow the version distribution process, and directly push the configuration results to the front end. The data acquisition process is simpler and more convenient for product iteration.
Most of the visual embedded points are based on XPath. XPath is a language to find information in XML documents. XPath can be used to traverse elements and attributes in XML documents.
No buried point
No buried point is that the front end automatically collects all events, reports the buried point data, and the back end filters and calculates the useful data. The advantage is that the front-end only needs to load the embedded point script at one time. The disadvantage is that the traffic and collected data are too large, and the server performance pressure is too high.
There are mainstream technologies using non buried point technology GrowingIO,Divine strategy.
summary
In different scenarios, we need to choose different buried point schemes. For example, for simple user behavior events, full buried points can be used to solve them; For the buried point requirements that need to carry a large number of business fields that can be known at runtime, declarative buried points are needed to solve.
Code example
Having finished the theory, let's look at the common core code implementation.
Collect user information
Through the built-in JavaScript object in the browser, we can collect some basic information of the current user. By pointing the collected data to the back-end script through the src attribute of the Image object instance and carrying parameters, we can transmit the data we collect to the back-end. The reason why we use Image object instead of ajax is to avoid cross domain problems.
(function () {
    let params = {};
    // document
    if (document) {
        params.domain = document.domain || ''; // domain name
        params.url = document.URL || ''; // Current URL address
        params.title = document.title || ''; // Current page title
        params.referrer = document.referrer || ''; // Last visited page URL address
    }
    // window
    if(window && window.screen) {
        params.sh = window.screen.height || 0; // Screen height
        params.sw = window.screen.width || 0; // Screen width
        params.cd = window.screen.colorDepth || 0; // Screen color depth
    }
    // navigator
    if(navigator) {
        params.lang = navigator.language || ''; // language
    }
    // Splicing parameters
    let args = '';
    for(let i in params) {
        if(args !== '') {
            args += '&';
        }
        args += `${i}=${params[i]}`
    }
    // Pass it to the back end by masquerading as an Image object
    let img = new Image(1, 1);
    let src = `http://www.funlee.cn/api/test.jpg?args=${encodeURIComponent(args)}`;
    img.src = src;
})()
You can get more information by using the built-in API of JavaScript according to specific actual needs.
The embedded point code is introduced through the script tag
<script>
(function() {
    let hm = document.createElement("script");
    hm.type = "text/javascript";
    hm.async = true;
    hm.src = "http://www.funlee.cn/testAnalyze.js";
    let s = document.getElementsByTagName("script")[0];
    s.parentNode.insertBefore(hm, s);
})();
</script>
Get the response time of each stage of web
In order to accurately obtain the performance characteristics of our web application, we need to know the response time of the application in various stages, such as DNS resolution time, TCP connection establishment time, home page white screen time, DOM rendering completion time, page load time, etc. Fortunately, all this information can be passed Performance The interface obtains relevant information to calculate.
let timing = performance.timing,
    start = timing.navigationStart,
    dnsTime = 0,
    tcpTime = 0,
    firstPaintTime = 0,
    domRenderTime = 0,
    loadTime = 0;

dnsTime = timing.domainLookupEnd - timing.domainLookupStart;
tcpTime = timing.connectEnd - timing.connectStart;
firstPaintTime = timing.responseStart - start;
domRenderTime = timing.domContentLoadedEventEnd - start;
loadTime = timing.loadEventEnd - start;

console.log('DNS Resolution time:', dnsTime,
            '\nTCP Establishment time:', tcpTime,
            '\n First screen time:', firstPaintTime,
            '\ndom Render completion time:', domRenderTime,
            '\n page onload time:', loadTime);
CSS buried point
Yes, CSS can also be used as embedding point, which is a small skill. Of course, CSS embedding point can only deal with some simple event embedding points, and JS is still used to collect complex data, but CSS embedding point has an advantage that it cannot be disabled.
Please stamp the complete instance: CSS buried point
The core code is as follows:
<style>
.link:active::after{
    color: red;
    content: url("http://192.168.1.110:3000/someapi?params=someInfo");
}
</style>
<a class="link btn">Click to visit</a>
Shoulders Of Giants
Reference link:
Front end monitoring and front-end buried point scheme design
What happened to the front buried point
Discussion on the loss of statistical data during page Jump
Technical analysis of JS buried point - window. Detailed explanation of performance