Requirement: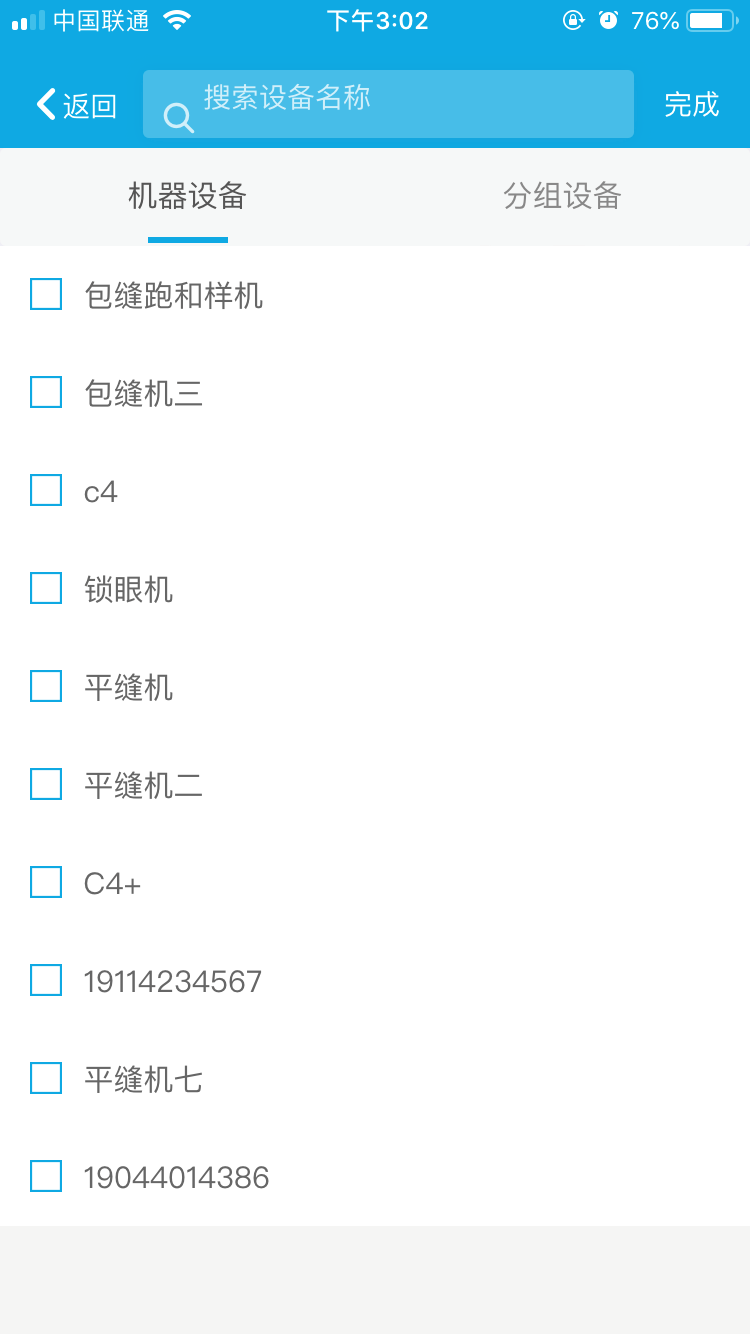
The ultimate effect: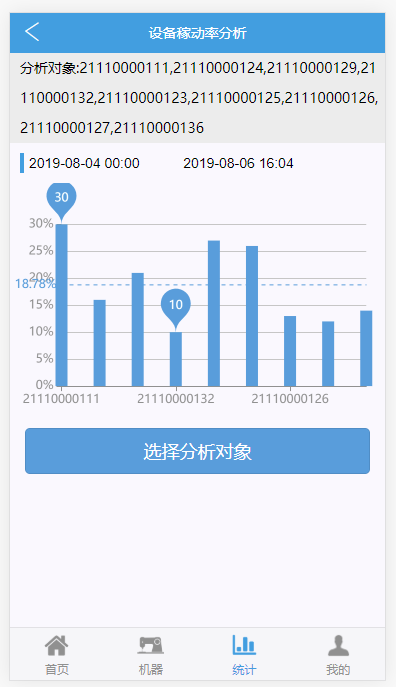
Code:
<style>
    html{
        touch-action:none;
    }
    button, .aui-btn {
        background-color: #06a7e2;
        color: white;
    }
  .weui-cells{
      margin-top: 40px;
  }
    .obj{
        padding-left: 10px;
        line-height: 30px;
        word-wrap: break-word;
        word-break: break-all;
        overflow: hidden;
        background-color: #EEEEEE;
    }
    #selectTime{
        width: 150px;
        border: none;
        border-left: 4px solid #06a7e2;
        padding-left: 5px;
    }
    .data_select{
        display: inline;
        height: 40px;
        line-height: 40px;
        padding: 0 10px;
    }
    #selectTimes{
         width: 120px;
        border: none;
        padding-right: 5px;
    }
    #main{
        width: 100%;
        height: 230px;
    }
#dosubmit{
    margin: 15px;
}
</style>
<!--if{$_GET['act'] === 'machine'}-->
<div id="top">
    <div id="back"  onclick="history.back()"><i class="iconfont icon-fanhui"></i></div>
    <div id="title">Equipment selection</div>
</div>
<div class="weui-cells weui-cells_checkbox"></div>
<a href="javascript:;" id="dosubmit" class="weui-btn weui-btn_mini weui-btn_primary">complete</a>
<!--{else}-->
<div id="top">
    <a id="back"  href="{url('statistic/index')}"><i class="iconfont icon-fanhui"></i></a>
    <div id="title">Momentum Analysis of Equipment Crops</div>
</div>
<div id="content">
    <div class="obj">Analysis object:{$_GET['machine']}</div>
    <div class="data_select">
        <input class="weui-input select-time" type="text" id="selectTime" value="{$_GET['bgDate']}">
        <input class="weui-input select-time" type="text" id="selectTimes" value="{$_GET['endDate']}">
    </div>
    <div id="main"></div>
    <a href="{url('statistic/compare', ['act'=>'machine'])}" class="weui-btn weui-btn_primary select-machine" style="background-color: #4BA6DD; margin: 15px; "> Selection of Analytical Objects</a>
</div>
<!--{/if}-->

<script type="text/javascript">

    $('.select-machine').click(function () {
        var bgDate = $('#selectTime').val(),
            endDate = $('#selectTimes').val();
        $(this).attr('href', '{url("statistic/compare", ["act"=>"machine"])}' + '&bgDate=' + bgDate + '&endDate=' + endDate);
    })

    $('.select-time').datetimePicker({
        onClose:function (e) {
            getChartData()
        }
    })

    function getQueryString(name) {
        var result = window.location.search.match(new RegExp("[\?\&]" + name + "=([^\&]+)", "i"));
        if (result == null || result.length < 1) {
            return "";
        }
        return result[1];
    }

    function getChartData() {
        var bgDate = $('#selectTime').val(),
            endDate = $('#selectTimes').val(),
            machineList = getQueryString("machine");

        var d1 = new Date(bgDate.replace(/-/g, "/"));
        var d2 = new Date(endDate.replace(/-/g, "/"));
        if(d1 >=d2)
        {
            alert("Start time must be less than end time!");
            return false;
        }

        $.post('{url("statistic/compare")}', {bgDate: bgDate, endDate: endDate, machineList: machineList}, function (res) {
            if (res.status) {
                // console.log(res.info);
                var data_x = [],
                    data_y = [];
                // chart(data_x, data_y);

                let arr=res.info;
                for (let key in arr) {
                    data_x.push(key);
                    data_y.push(arr[key]);
                }


                Do.ready('echart', function () {
                var myCharts = echarts.init(document.getElementById('main'));
                var options = {
                    noDataLoadingOption:
                        {
                            text: 'No data',
                            effect: 'bubble',
                            effectOption: {
                                    effect: {
                                            n: 0
                                        }
                                }
                        },
                    tooltip: {},
                    grid:{
                        top: '18%',
                        left: '5%',
                        right: '5%',
                        bottom: '3%',
                        containLabel: true
                    },
                    xAxis: {
                        axisLine:{
                            lineStyle : {
                                color: '#999999'
                            }
                        },
                        axisLabel:{
                            interval:2
                        },
                        boundaryGap: false,
                        data: data_x
                    },
                    yAxis: {
                        axisLine:{
                            show:false,
                            lineStyle : {
                                color: '#999999'
                            }
                        },
                        type: 'value',
                        axisLabel: {
                            formatter: '{value}%'
                        }
                    },
                    series: [{
                        markPoint: {
                            data: [
                                {type: 'max', name: 'Maximum value'},
                                {type: 'min', name: 'minimum value'}
                            ]
                        },
                        markLine: {
                            symbol:"none",
                            label:{
                                position:'start',
                                formatter: '{c}%'
                            },
                            data: [
                                {type: 'average', name: 'average value'}
                            ]
                        },
                        name: 'Crop mobility',
                        color:['#4BA6DD'],
                        type: 'bar',
                        barWidth:12,
                        symbol:'none',
                        smooth:0.3,
                        data:data_y
                    }]
                };
                myCharts.setOption(options);
                })
            }
            else {
                $.toast(res.info || 'request was aborted', "forbidden");
            }
        })
    }
    if ('{$_GET["act"]}' !== 'machine') {
        getChartData()
    } else {
        $.post('{url("statistic/getMachineList")}', function (res) {
            if (res.status) {
                let list = JSON.parse(res.info);
                console.log(list);
                let str = ''
                for (let key in list) {
                    list[key].map(function (item) {
                        str += `<label class="weui-cell weui-check__label">
                                <div class="weui-cell__hd">
                                    <input type="checkbox" class="weui-check" name="checkbox" value="${item.sn}">
                                      <i class="weui-icon-checked"></i>
                                 </div>
                                    <div class="weui-cell__bd">
                                        <p>${item.name}</p>
                                    </div>
                                </label>`
                    })
                }
                $('.weui-cells').html(str)
            } else {
                $.toast(res.info || 'request was aborted', "forbidden");
            }
        })

        $('#dosubmit').click(function(){
            var checkID = [];
            $("input[name='checkbox']:checked").each(function(i){
                checkID[i] =$(this).val();
            });
        console.log(checkID);
        if(checkID.length !==0){
            location.href="{url('statistic/compare', [bgDate=>$_GET['bgDate'], endDate=>$_GET['endDate']])}" + "&machine=" + checkID;
        }else{
             window.history.back()
        }
        });
    }

    // function chart(data_x, data_y) {
    //
    // }

    Do.ready('echart', function () {
    var myChart = echarts.init(document.getElementById('main'));
        var str = getQueryString("machine");
        var strs = getQueryString("machineList");
        var data=str.split(",");
        var datas=strs.split(",");

    var option = {
        tooltip: {},
        grid:{
            top: '18%',
            left: '5%',
            right: '5%',
            bottom: '3%',
            containLabel: true
        },
        xAxis: {
            axisLine:{
                lineStyle : {
                    color: '#999999'
                }
            },
            axisLabel:{
                interval:3
            },
            boundaryGap: false,
            data: data
        },
        yAxis: {
            axisLine:{
                show:false,
                lineStyle : {
                    color: '#999999'
                }
            },
            type: 'value',
            axisLabel: {
                formatter: '{value}%'
            }
        },
        series: [{
            markPoint: {
                data: [
                    {type: 'max', name: 'Maximum value'},
                    {type: 'min', name: 'minimum value'}
                ]
            },
            markLine: {
                symbol:"none",
                label:{
                    position:'start',
                    formatter: '{c}%'
                },
                data: [
                    {type: 'average', name: 'average value'}
                ]
            },
            name: 'Crop mobility',
            color:['#4BA6DD'],
            type: 'bar',
            barWidth:12,
            symbol:'none',
            smooth:0.3,
            data:datas
        }]
    };
    myChart.setOption(option);
    })
</script>
Problems encountered:
A page calls different interfaces to show different.
Solution: Use if... else...
**<!--if{$_GET['act'] === 'machine'}-->**////////
<div id="top">
<div id="back" onclick="history.back()"><i class="iconfont icon-fanhui"></i></div>
<div id="title">Equipment selection</div>
</div>
<div class="weui-cells weui-cells_checkbox"></div>
<a href="javascript:;" id="dosubmit" class="weui-btn weui-btn_mini weui-btn_primary">complete</a>
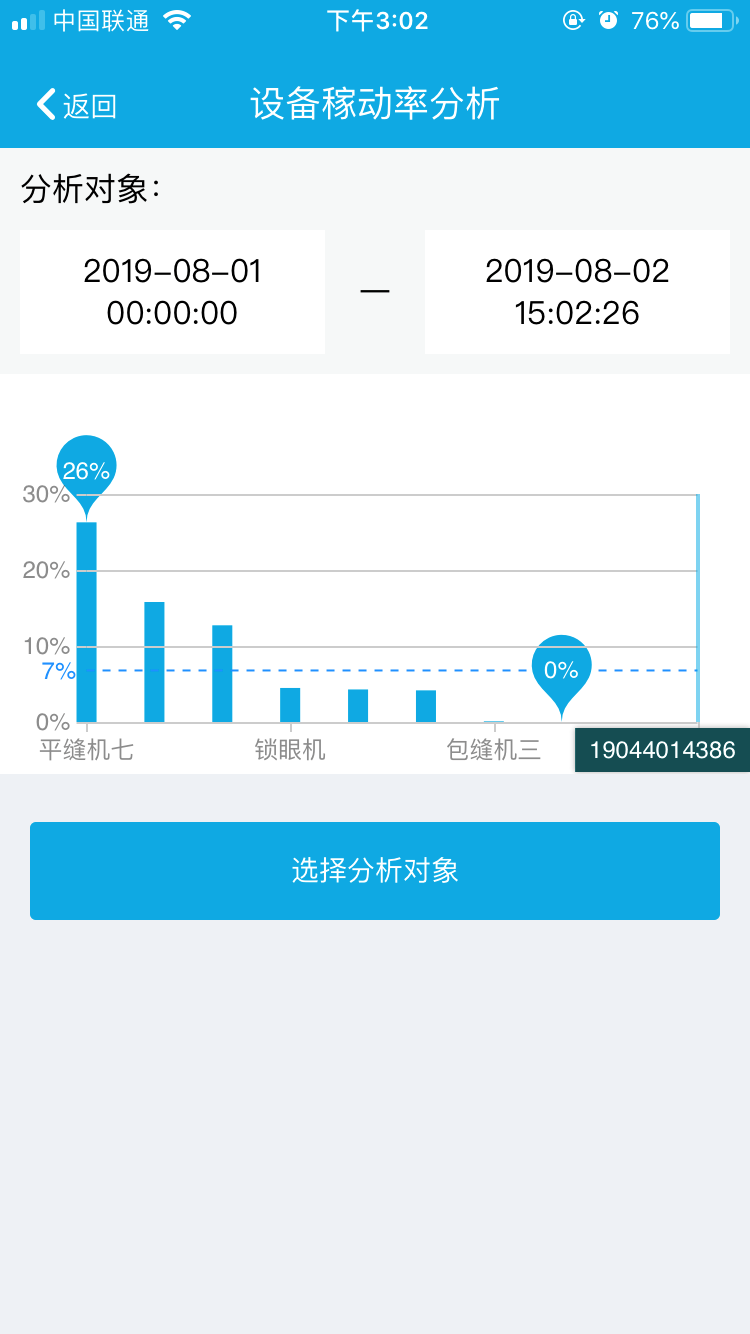
**<!--{else}-->**/////////
<div id="top">
<a id="back" href="{url('statistic/index')}"><i class="iconfont icon-fanhui"></i></a>
<div id="title">Momentum Analysis of Equipment Crops</div>
</div>
<div id="content">
<div class="obj">Analysis object:{$_GET['machine']}</div>
<div class="data_select">
<input class="weui-input select-time" type="text" id="selectTime" value="{$_GET['bgDate']}">
<input class="weui-input select-time" type="text" id="selectTimes" value="{$_GET['endDate']}">
</div>
<div id="main"></div>
<a href="{url('statistic/compare', ['act'=>'machine'])}" class="weui-btn weui-btn_primary select-machine" style="background-color: #4BA6DD; margin: 15px; "> Selection of Analytical Objects</a>
</div>
**<!--{/if}-->**/////////
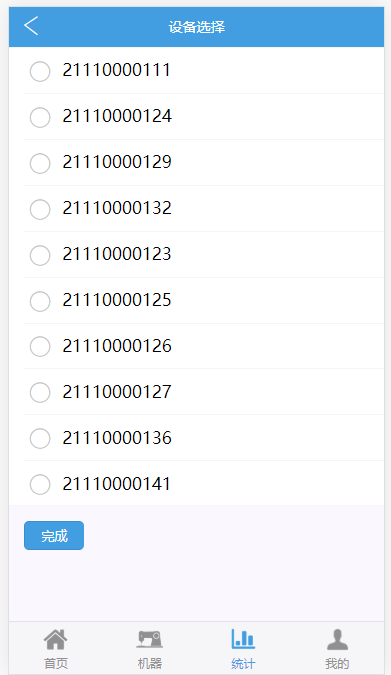
Then the data is post ed from the background, the list of devices is circulated, and the interface is fetched by judgment:
    if ('{$_GET["act"]}' !== 'machine') {
        getChartData()
    } else {
        $.post('{url("statistic/getMachineList")}', function (res) {
            if (res.status) {
                let list = JSON.parse(res.info);
                console.log(list);
                let str = ''
                for (let key in list) {
                    list[key].map(function (item) {
                        str += `<label class="weui-cell weui-check__label">
                                <div class="weui-cell__hd">
                                    <input type="checkbox" class="weui-check" name="checkbox" value="${item.sn}">
                                      <i class="weui-icon-checked"></i>
                                 </div>
                                    <div class="weui-cell__bd">
                                        <p>${item.name}</p>
                                    </div>
                                </label>`
                    })
                }
                $('.weui-cells').html(str)////// html splicing: replacing the entire page for cycling
            } else {
                $.toast(res.info || 'request was aborted', "forbidden");
            }
        })

        $('#dosubmit').click(function(){
            var checkID = [];
            $("input[name='checkbox']:checked").each(function(i){
                checkID[i] =$(this).val();
            });
        console.log(checkID);
        if(checkID.length !==0){
            location.href="{url('statistic/compare', [bgDate=>$_GET['bgDate'], endDate=>$_GET['endDate']])}" + "&machine=" + checkID;
        }else{
             window.history.back()
        }
        });
    }
Also use the link from the previous page:
<a href="{url('statistic/compare')}" class="more compare">View details ></a>
$(".compare").attr('href', '{url("statistic/compare", [ bgDate=>date("Y-m-d 00:00"),endDate=>date("Y-m-d H:i")])}' + '&machine=' + data3_x+ '&machineList=' + data3_y);
The call passes the value through the url:
    function getQueryString(name) {
        var result = window.location.search.match(new RegExp("[\?\&]" + name + "=([^\&]+)", "i"));
        if (result == null || result.length < 1) {
            return "";
        }
        return result[1];
    }
        var str = getQueryString("machine");
        var strs = getQueryString("machineList");
        var data=str.split(",");
        var datas=strs.split(",");
Then there is the judgment of the time period.
 var bgDate = $('#selectTime').val(),
        endDate = $('#selectTimes').val(),
        machineList = getQueryString("machine");

    var d1 = new Date(bgDate.replace(/-/g, "/"));
    var d2 = new Date(endDate.replace(/-/g, "/"));
    if(d1 >=d2)
    {
        alert("Start time must be less than end time!");
        return false;
    }
Trigger refresh after time selection:
  $('.select-time').datetimePicker({
        onClose:function (e) {
            getChartData()
        }
    })
It mainly refers to the time selector:
   $('#selectYear').picker({
        toolbarTemplate:'<div class="toolbar"><div class="toolbar-inner"><a href="javascript:;" class="picker-button close-picker"' +
        '' + ' ' + 'style="color:#2F89FE; left: 0; right: auto; "> Cancel </a> < a href=" javascript:; "'+'"+
        'class="picker-button close-picker" style="color:#2F89FE "> Complete </a> </div> </div>',
        cols:[
            {
                textAlign: 'center',
                values:(function () {
                    //The range from five years ago to the next ten years
                    for(var years = [],k=date.getFullYear()-5;k<=date.getFullYear()+10;k++){
                        years.push(k)
                    }
                    return years
                })()
            }
        ],
        value:date.getFullYear(),
        //Change trigger
        onChange:function (re,val,displayValue) {
            // Value currently selected, displayValue currently displayed
        },
        //Triggered when closed
        onClose:function (e) {
            var year=e.value[0];
            var arr = [
                year, '01','01'
            ];
            var date=arr.join("-");
            window.location.href="{url('statistic/activation')}" + "?date=" + date + "&method=year";
        }
    });
Another is to return to an unselected page when the selection is empty and completed directly:
      $('#dosubmit').click(function(){
            var checkID = [];
            $("input[name='checkbox']:checked").each(function(i){
                checkID[i] =$(this).val();
            });
        console.log(checkID);
        if(checkID.length !==0){
            location.href="{url('statistic/compare', [bgDate=>$_GET['bgDate'], endDate=>$_GET['endDate']])}" + "&machine=" + checkID;
        }else{
             window.history.back()
        }
        });
    }
You can see the effect when you solve the problems one by one.
And: [css] the text in the label is automatically changed according to the width.
word-wrap: break-word;
word-break: break-all;
overflow: hidden;
There are many ways:
[css] characters in labels are automatically changed according to width.
https://blog.csdn.net/guo_ridgepole/article/details/84305179
new Date() Date Format Processing
https://blog.csdn.net/qq_39759115/article/details/78893853
JS Gets the parameters of the page passed through the URL
https://blog.csdn.net/why15732625998/article/details/70259341
JQuery selects all the checkboxes selected and submits data asynchronously with Ajax
https://www.cnblogs.com/luokakale/p/7281628.html
Conversion between Jquery arrays and strings
https://www.cnblogs.com/wt645631686/p/9881146.html
js determines that the start date (time) must be less than the end date (time)
https://blog.csdn.net/qq_39218765/article/details/80148049
Usage of JSON.parse() and JSON.stringify()
https://www.cnblogs.com/TigerZhang-home/p/8686836.html
Brief description of for ____________. in and for... for let... in...)
https://segmentfault.com/a/1190000014826155
It feels so bad that I haven't seen it yet.
https://www.cnblogs.com/moqiutao/p/7097419.html
map() method in jQuery and JS