This paper introduces the data structure DataFrame and eries of data analysis star pack Pandas in Python, which is practical.
Copyright Statement: This is an original blogger article, please indicate the source of the original text for reproducing, no white lyrics!
Writing time: 2020-06-06 0:08
Catalog
2. Series of pandas data structure
#Pandas.SeriesTake out all values:
#Pandas.SeriesRemove index:index
#Pandas.SeriesBe similar toNumpy.ndarryPerformance
#Pandas.SeriesValue by index value
#Pandas.SeriesDictionary-like performance
3. DataFrame of pandas Data Structure
#Pandas.DataFrameColumn fetching operation in
Pandas.DataFrameSelect a column from
Pandas.DataFrameSelect columns in method 1
Pandas.DataFrameSelect columns from method 2
#Pandas.DataFrameRow fetching in
Pandas.DataFramePick a row from
Pandas.DataFrameSelect rows from
Pandas.DataFrameFilter rows by a condition in
Pandas.DataFrameFilter rows by multiple criteria in
Pandas.DataFrameCombining map and lambda functions to filter rows in
Pandas.DataFrameCombined isin filter line in
#Pandas.DataFrameSelect columns from rows
#Pandas.DataFrameMedium replacement value: where method
#Pandas.DataFrameFind a value for a location in: lookup method
#Pandas.DataFrameAdd new column at end of middle
#Pandas.DataFrameAdd a new column at the specified location in: insert method
#Pandas.DataFrameDelete column in: del method
#Pandas.DataFrameCopy: copy method
#Pandas.DataFrameLook at the first and last lines: head|tail
#Series,Pandas.DataFrameNumber of unique values for a column in:unique
#Pandas.DataFrameGroup and count by columns: groupby+count
#Pandas.DataFrameGroup by a column and sum:
#Pandas.DataFrameGroup by column and remove a group: groupby+get_group
Pandas.DataFrameSort by row label or column label: sort_index method
Pandas.DataFrameSort by column value: sort_values method by parameter
#Pandas.DataFrameDescriptive Statistics
#Pandas.DataFrameGet row and column labels/header names
1. Introduction to pandas
- The pandas module is built on numpy, is fast (the layer algorithm has been optimized with Cython), and has a large number of functions that directly operate on each element.
- It is often used with packages such as Matplotlib, seaborn, statsmodels, scikit-learn, etc.
- pandas is better at working with Tabular data than numpy, where each column of data type can be inconsistent and numpy arrays dictate that data types need to be consistent.
- There are two main data structures: one-dimensional Series (similar toNumpy.ndarray) with row labels, 2-D DataFrame (better than R)Data.frameRicher), with row and column labels;
- Use of pandas can be searched here, click the stamp: https://pandas.pydata.org/pandas-docs/stable/reference/index.html .
- Import the pandas package, the python community abbreviates the pandas module as pd by default, importing the module together:
In [8]: import pandas as pd
In [9]: from pandas import Series,DataFrame#Import two data structures.
2. Series of pandas data structure
- Series is a one-dimensional labeled array with its own tags, structured as follows:

- Series has a number of properties and functions:
In [27]: len(dir(Series))
Out[27]: 471#More than 400 methods
See: https://pandas.pydata.org/pandas-docs/stable/reference/series.html
#Pandas.SeriesQuick Creation
- Grammar:pd.Series(data=None, index=None, dtype=None, name=None, copy=False, fastpath=False)
- data: a dictionary in python, iterative objects,Numpy.ndarryOr scalar values
- index: optional, defaults to list [0,..., len(data) - 1], can be passed in by itself
- dtype: optional, set data type
In [38]: data = pd.Series([1,2,3,4,5])#No index value specified, default index value is [0,..., len(data) - 1]
In [39]: data
Out[39]:
0 1
1 2
2 3
3 4
4 5
dtype: int64


#Pandas.SeriesCustom Index Value
In [47]: data1 = pd.Series([1,2,3,4,5],index=list('abcde'))
In [48]: data1
Out[48]:
a 1
b 2
c 3
d 4
e 5
dtype: int64
#Pandas.SeriesTake out all values:
Returns an array.*
In [49]: data1.values
Out[49]: array([1, 2, 3, 4, 5], dtype=int64)
#Pandas.SeriesRemove index:index
Returns an array
In [50]: data1.index
Out[50]: Index(['a', 'b', 'c', 'd', 'e'], dtype='object')
#Pandas.SeriesBe similar toNumpy.ndarryPerformance
Attribute view: data type (dtype), shape, dimension (ndim), number of elements (size), index, slicing, Boolean filtering, and so on.
#Pandas.SeriesValue by index value
In [58]: data1['a']#Take a single value, similar to keying a value in a dictionary
Out[58]: 1

In [10]: data1[['a','b']]#Incoming Index Value List takes a set of values
Out[10]:
a    1
b    2
dtype: int64
//Equivalent to
In [14]: data1[0]
Out[14]: 1

In [15]: data1[[0,1]]
Out[15]:
a    1
b    2
dtype: int64
#Pandas.SeriesDictionary-like performance
In [18]: 'a' in data1#judgePandas.SeriesIndex Value Membership
Out[18]: True

In [17]: 1 in data1.values#judgePandas.SeriesElement Membership
Out[17]: True

In [20]: data1['a'] = '1234'#modifyPandas.SeriesElement Value
In [21]: data1
Out[21]:
a    1234
b       2
c       3
d       4
e       5
dtype: int64
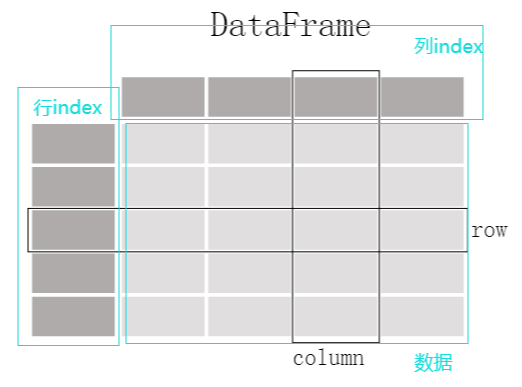
3. DataFrame of pandas Data Structure
- The DataFrame structure is illustrated below and can be interpreted as a tabular structure with row and column indexes.
- Each column is a Series object, and the data type of each column can be different.
- With a large number of properties and functions: detail stamps, https://pandas.pydata.org/pandas-docs/stable/reference/frame.html
#DataFame Creation
- Grammar:pandas.DataFrame(data=None, index: Optional[Collection] = None, columns: Optional[Collection] = None, dtype: Union[str,numpy.dtype, Extension Dtype, None] = None, copy: bool = False)
- data
- index: optional, row labels
- columns: optional, column label
- dtype: optional, element data type
There are many ways to create it, two of which are listed:
#Create using a dictionaryPandas.DataFame
In [40]: d = {'col1': [1, 2], 'col2': [3, 4]}
    ...: df = pd.DataFrame(d,dtype=np.int8)#dtype Specifies the element data type
In [41]: df
Out[41]:
   col1  col2
0     1     3
1     2     4

In [42]: df.dtypes#View data types
Out[42]:
col1    int8
col2    int8
dtype: object

In [29]: df
Out[29]:
   col1  col2
0     1     3
1     2     4

#Use 2-DNumpy.ndarryEstablishPandas.DataFame
In [43]: df2 = pd.DataFrame(np.array([[1, 2, 3], [4, 5, 6], [7, 8, 9]]),
    ...:                    columns=['a', 'b', 'c'])# columns Specify Column Labels

In [44]: df2
Out[44]:
   a  b  c
0  1  2  3
1  4  5  6
2  7  8  9
#Pandas.DataFrameColumn fetching operation in

#Create Experimental DataFrame
In [140]: d = {'one': pd.Series([2., 2., 3.,4.], index=['a', 'b', 'c','d']),'two': pd.Series([1., 2., 3., 4.], index=['a', 'b', 'c', 'd']),'three': pd.Series([3., 1., 3., 4.], index=['a', 'b', 'c', 'd'])}
In [141]: df = pd.DataFrame(d)
In [142]: df
Out[142]:
   one  two  three
a  2.0  1.0    3.0
b  2.0  2.0    1.0
c  3.0  3.0    3.0
d  4.0  4.0    4.0
Pandas.DataFrameSelect a column from
In [143]: df['one']
Out[143]:
a    2.0
b    2.0
c    3.0
d    4.0
Name: one, dtype: float64
Pandas.DataFrameSelect columns in method 1
In [144]: df[['one','three']]#[[]], place a 1-index value list in brackets
Out[144]:
   one  three
a  2.0    3.0
b  2.0    1.0
c  3.0    3.0
d  4.0    4.0
Pandas.DataFrameSelect columns from method 2
In [76]: df.iloc[:,[0,2]]#df.iloc[Row index, [Column index number]]
Out[76]:
one three
a 2.0 3.0
b 2.0 1.0
c 3.0 3.0
d 4.0 4.0
#Pandas.DataFrameRow fetching in

Pandas.DataFramePick a row from
In [94]: df
Out[94]:
one two three
a 2.0 1.0 3.0
b 2.0 2.0 1.0
c 3.0 3.0 3.0
d 4.0 4.0 4.0

In [95]: df.loc[['a']]
Out[95]:
one two three
a 2.0 1.0 3.0
In [106]: type(df.loc[['a']])#Return a DataFrame object
Out[106]: pandas.core.frame.DataFrame

In [96]: df.loc['a']#There is a difference between using ['a'] and ['a']]
Out[96]:
one 2.0
two 1.0
three 3.0
In [105]: type(df.loc['a'])#Return a Series object
Out[105]: pandas.core.series.Series
Pandas.DataFrameSelect rows from
In [97]: df.loc[['a','d']]
Out[97]:
one two three
a 2.0 1.0 3.0
d 4.0 4.0 4.0
Pandas.DataFrameFilter rows by a condition in
Boolean vector assisted filtering is passed in.
In [118]: df
Out[118]:
one two three
a 2.0 1.0 3.0
b 2.0 2.0 1.0
c 3.0 3.0 3.0
d 4.0 4.0 4.0

In [114]: df['two']#Remove'two'column
Out[114]:
a 1.0
b 2.0
c 3.0
d 4.0
Name: two, dtype: float64

In [115]: df['two'] > 2#'two'column judgement returns Boolean Series object
Out[115]:
a False
b False
c True
d True
Name: two, dtype: bool

In [116]: df[df['two'] > 2]#Remove rows with element values greater than 2 in the'two'column
Out[116]:
one two three
c 3.0 3.0 3.0
d 4.0 4.0 4.0
Pandas.DataFrameFilter rows by multiple criteria in
A logical operator is used:
| or
& and
~ Reverse
Note that each condition is enclosed in parentheses, as follows:
In [125]: df[(df['two'] >= 2) & (df['three'] >= 3)]#Take rows where the'two'column is greater than or equal to 2 and the'three' column is greater than or equal to 3
Out[125]:
one two three
c 3.0 3.0 3.0
d 4.0 4.0 4.0
Pandas.DataFrameCombining map and lambda functions to filter rows in
In [136]: df
Out[136]:
one two three
a 2.0 1.0 3.0
b 2.0 2.0 1.0
c 3.0 3.0 3.0
d 4.0 4.0 4.0

In [137]: fileter_ = df['one'].map(lambda x: str(x).startswith('2'))#Remove characters that begin with 2 in the'one'column
In [138]: df[fileter_]
Out[138]:
one two three
a 2.0 1.0 3.0
b 2.0 2.0 1.0
Pandas.DataFrameCombined isin filter line in
In [139]: df
Out[139]:
one two three
a 2.0 1.0 3.0
b 2.0 2.0 1.0
c 3.0 3.0 3.0
d 4.0 4.0 4.0

In [140]: df['one'].isin([1,2])#Remove rows with a value of 1 or 2 from the'one'column
Out[140]:
a True
b True
c False
d False
Name: one, dtype: bool

In [141]: df[df['one'].isin([1,2])]
Out[141]:
one two three
a 2.0 1.0 3.0
b 2.0 2.0 1.0
#Pandas.DataFrameSelect columns from rows

In [101]: df
Out[101]:
one two three
a 2.0 1.0 3.0
b 2.0 2.0 1.0
c 3.0 3.0 3.0
d 4.0 4.0 4.0

In [102]: df.iloc[[0,3],[0,1]]#Row 0, Column 1 and Column 2 of Row 3
Out[102]:
one two
a 2.0 1.0
d 4.0 4.0
#Pandas.DataFrameMedium replacement value: where method
where operates on elements that do not meet the criteria and does not change the original data.
In [151]: df
Out[151]:
one two three
a 2.0 1.0 3.0
b 2.0 2.0 1.0
c 3.0 3.0 3.0
d 4.0 4.0 4.0

In [152]: df.where(df['one'] < 3, df-1)#Perform a minus 1 operation on rows (rows c and d) where the'one'column element is greater than or equal to 3
Out[152]:
one two three
a 2.0 1.0 3.0
b 2.0 2.0 1.0
c 2.0 2.0 2.0
d 3.0 3.0 3.0
#Pandas.DataFrameFind a value for a location in: lookup method
(Personally, I don't feel like any eggs are useful)
In [166]: df
Out[166]:
one two three
a 2.0 1.0 3.0
b 2.0 2.0 1.0
c 3.0 3.0 3.0
d 4.0 4.0 4.0

In [167]: df.lookup(['d','a'],['one','three'])#Find values with coordinates ('d','one') and ('a','three')
Out[167]: array([4., 3.])

In [168]: df.lookup(['a','d'],['one','three'])
Out[168]: array([2., 4.])
#Pandas.DataFrameAdd new column at end of middle
The original data will be modified directly and used with caution.
In [169]: df1
Out[169]:
one two three
a 2.0 1.0 3.0
b 2.0 2.0 1.0
c 3.0 3.0 3.0
d 4.0 4.0 4.0

In [170]: df1['five'] = -df1['three']#Add column at end by default
In [171]: df1
Out[171]:
one two three five
a 2.0 1.0 3.0 -3.0
b 2.0 2.0 1.0 -1.0
c 3.0 3.0 3.0 -3.0
d 4.0 4.0 4.0 -4.0
#Pandas.DataFrameAdd a new column at the specified location in: insert method
In [186]: df.insert(1, 'new_one', df['one'])#Add a new column after the first column
In [187]: df
Out[187]:
one new_one two three
a 2.0 2.0 1.0 3.0
b 2.0 2.0 2.0 1.0
c 3.0 3.0 3.0 3.0
d 4.0 4.0 4.0 4.0
#Pandas.DataFrameDelete column in: del method
The original data will be modified directly and used with caution.
In [177]: del df1['five']
In [178]: df1
Out[178]:
one two three
a 2.0 1.0 3.0
b 2.0 2.0 1.0
c 3.0 3.0 3.0
d 4.0 4.0 4.0
#Pandas.DataFrameCopy: copy method
del can be avoided, insert can modify the original data directly.
In [189]: df1 = df.copy()
In [190]: df1
Out[190]:
one new_one two three
a 2.0 2.0 1.0 3.0
b 2.0 2.0 2.0 1.0
c 3.0 3.0 3.0 3.0
d 4.0 4.0 4.0 4.0

In [192]: del df1['new_one']
In [193]: df1#df1 modified
Out[193]:
one two three
a 2.0 1.0 3.0
b 2.0 2.0 1.0
c 3.0 3.0 3.0
d 4.0 4.0 4.0

In [194]: df#df not modified
Out[194]:
one new_one two three
a 2.0 2.0 1.0 3.0
b 2.0 2.0 2.0 1.0
c 3.0 3.0 3.0 3.0
d 4.0 4.0 4.0 4.0
#Pandas.DataFrameLook at the first and last lines: head|tail
In [199]: df
Out[199]:
one new_one two three
a 2.0 2.0 1.0 3.0
b 2.0 2.0 2.0 1.0
c 3.0 3.0 3.0 3.0
d 4.0 4.0 4.0 4.0

In [200]: df.head(3)#View the first three lines
Out[200]:
one new_one two three
a 2.0 2.0 1.0 3.0
b 2.0 2.0 2.0 1.0
c 3.0 3.0 3.0 3.0

In [201]: df.tail(3)#View the last three lines
Out[201]:
one new_one two three
b 2.0 2.0 2.0 1.0
c 3.0 3.0 3.0 3.0
d 4.0 4.0 4.0 4.0
#Series,Pandas.DataFrameNumber of unique values for a column in:unique
In [68]: pd.Series(['c', 'a', 'd', 'a', 'a', 'b', 'b', 'c' , 'c']).unique()
Out[68]: array(['c', 'a', 'd', 'b'], dtype=object)
#Pandas.DataFrameFrequency of occurrence of each element in the statistics column: value_counts method
In [251]: df1
Out[251]:
one two
a 1.0 1.0
b 2.0 2.0
c 3.0 NaN
d NaN 4.0

In [252]: df1['one'].value_counts()
Out[252]:
3.0 1
2.0 1
1.0 1
Name: one, dtype: int64

In [253]: df1['one'].value_counts(dropna=False)#Do not skip defaults
     ...:
Out[253]:
NaN 1
3.0 1
2.0 1
1.0 1
Name: one, dtype: int64
#Pandas.DataFrameGroup and count by columns: groupby+count
In [5]: df = pd.DataFrame([('bird', 'Falconiformes', 389.0),
   ...: ('bird', 'Psittaciformes', 24.0),
   ...: ('mammal', 'Carnivora', 80.2),
   ...: ('mammal', 'Primates', np.nan),
   ...: ('mammal', 'Carnivora', 58)],
   ...: index=['falcon', 'parrot', 'lion', 'monkey', 'leopard'],
   ...: columns=('class', 'order', 'max_speed'))

In [6]: df
Out[6]:
          class           order  max_speed
falcon     bird   Falconiformes      389.0
parrot     bird  Psittaciformes       24.0
lion     mammal       Carnivora       80.2
monkey   mammal        Primates        NaN
leopard  mammal       Carnivora       58.0

In [7]: df.groupby(['class','order']).count()
Out[7]:
                       max_speed
class  order
bird   Falconiformes           1
       Psittaciformes          1
mammal Carnivora               2
       Primates                0
#Pandas.DataFrameGroup by a column and sum:
In [17]: df2 = pd.DataFrame({'X': ['B', 'B', 'A', 'A'], 'Y': [1, 2, 3, 4]})
In [18]: df2
Out[18]:
X Y
0 B 1
1 B 2
2 A 3
3 A 4

In [19]: df2.groupby(['X']).sum()
Out[19]:
Y
X
A 7
B 3

In [20]: df2.groupby(['X'],sort=False).sum()
Out[20]:
Y
X
B 3
A 7
#Pandas.DataFrameGroup by column and remove a group: groupby+get_group
In [27]: df2.groupby(['X']).get_group('A')
Out[27]:
X Y
2 A 3
3 A 4

#Count the number of groupby groupings
In [28]: len(df2.groupby(['X'],sort=False).get_group('A'))
Out[28]: 2
#Pandas.DataFramesort
Pandas.DataFrameSort by row label or column label: sort_index method
By default, ascending sets the sort order.
In [31]: frame = pd.DataFrame(np.arange(8).reshape((2, 4)), index=['three', 'one'], columns=['d', 'a', 'b', 'c'])
In [32]: frame
Out[32]:
d a b c
three 0 1 2 3
one 4 5 6 7
In [36]: frame
Out[36]:
       d  a  b  c
three  0  1  2  3
one    4  5  6  7

In [37]: frame.sort_index()#Row Index Sorting
Out[37]:
       d  a  b  c
one    4  5  6  7
three  0  1  2  3

In [38]: frame.sort_index(axis=1)#Column Index Sorting
Out[38]:
       a  b  c  d
three  1  2  3  0
one    5  6  7  4

In [39]: frame.sort_index(axis=1, ascending=False)#Column index sort, ascending to set ascending or descending sort
Out[39]:
d c b a
three 0 3 2 1
one 4 7 6 5
Pandas.DataFrameSort by column value: sort_values method by parameter
In [41]: frame.sort_values(by='d')#Sort by column d value, ascending by default
Out[41]:
d a b c
three 0 1 2 3
one 4 5 6 7

In [42]: frame.sort_values(by='d',ascending=False)#ascending set descending sort
Out[42]:
d a b c
one 4 5 6 7
three 0 1 2 3

In [43]: frame.sort_values(by=['c','d'],ascending=False)#Sort by the values of c and d, that is, by column c values first, and then by column D values when column c values are the same
Out[43]:
d a b c
one 4 5 6 7
three 0 1 2 3
#Pandas.DataFrameDescriptive Statistics
Common functions for describing and summarizing statistics in DPandas

Method Description
 Number of count non-NA values
 describe calculates summary statistics for columns in Series or DataFrame, with different return structures for numbers and characters
 Min, Max minimum and maximum
 Index position of argmin, argmax minimum and maximum (integer)
Index values for idxmin, idxmax minimum and maximum
 Quantile sample quantile (0 to 1)
sum of sums
 mean
 median
 mad calculates mean absolute deviation from mean
 var variance
 std standard deviation
 Skew sample value skew (third-order moment)
kurt sample value kurtosis (fourth-order moment)
Cumulative sum of cumsum sample values
 Cummin, cummax sample values cumulative maximum and cumulative minimum
 Cumulative product of cumprod sample values
 diff calculates first-order difference (useful for time series)
pct_change calculates percentage change
In [44]: df = DataFrame([[1.4,np.nan],[7.1,-4.5],[np.nan,np.nan],[0.75,-1.3]],index=['a','b','c','d'],columns=['one','two'])
In [45]: df
Out[45]:
one two
a 1.40 NaN
b 7.10 -4.5
c NaN NaN
d 0.75 -1.3

In [46]: df.sum()#Sum each column by default
Out[46]:
one 9.25
two -5.80
dtype: float64

In [47]: df.sum(axis = 1)#Pass in the parameter axis, finding the sum of each line
Out[47]:
a 1.40
b 2.60
c 0.00
d -0.55
dtype: float64

In [48]: df.describe()#Output multiple statistics for each column value, skipping directly for NaN values
Out[48]:
one two
count 3.000000 2.000000
mean 3.083333 -2.900000
std 3.493685 2.262742
min 0.750000 -4.500000
25% 1.075000 -3.700000
50% 1.400000 -2.900000
75% 4.250000 -2.100000
max 7.100000 -1.300000

In [53]: pd.Series(['a', 'a', 'b', 'c']).describe()
Out[53]:
count 4
unique 3#Number of characters after reduplication
top a
freq 2
dtype: object
#Pandas.DataFrameGet row and column labels/header names
In [75]: df
Out[75]:
one two
a 1.40 NaN
b 7.10 -4.5
c NaN NaN
d 0.75 -1.3

In [76]: list(df.columns.values)#Column Label
Out[76]: ['one', 'two']

In [77]: list(df.index.values)#Row Label
Out[77]: ['a', 'b', 'c', 'd']
4. References
https://pandas.pydata.org/pandas-docs/stable/index.html
Python for Data Analysis, 2nd Edition
Python Handbook of Data Science