catalogue
1. What is data discretization? 2. Why data discretization? 3. How to discretize data? 1) Parameter description of pd.cut() and pd.qcut() 2) Instructions for using pd.cut() and pd.qcut() 3) pd.cut() value_counts() use 4. Post processing of discrete data (one hot coding) 1)pd.get_ Use of Dummies (data, prefix =)
1. What is data discretization?
discretization of continuous attributes is to divide the value domain of continuous attributes into several discrete intervals. Finally, different symbols or integer values are used to represent the attribute value of each sub interval.
2. Why data discretization?
data discretization can effectively reduce time complexity and memory overhead. for some machine learning algorithms, such as decision tree, random forest and naive Bayes. Most of their data sets are for discrete data. Therefore, effective data discretization has a very important impact on reducing the computational complexity and improving the accuracy of the algorithm. discrete data is easier to understand. For the income field, one person is 3000 and one person is 20000. If we regard income as a continuous variable, for so many figures, we need to know who belongs to high salary and who belongs to low salary through numerical comparison. It doesn't seem intuitive. If the income is converted to discrete data types (low salary, medium salary and high salary), the meaning of the original number can be clearly seen. the discretized feature has strong robustness to abnormal data: for the feature of age, if age > 30 is 1, otherwise 0. If the features are not discretized, an abnormal data "age 300 years old" will cause great interference to the model. for more information on data discretization, please refer to the following articles: https://zhuanlan.zhihu.com/p/91181935
3. How to discretize data?
for the obtained data set, there will be many features, that is, the fields we often say. Some features are continuous data types, and some data itself is discrete data variables. it's already a discrete data variable. We don't care. But for continuous data variables, what should we do if we need to discretize the data?
1) Parameter description of pd.cut() and pd.qcut()
- qcut(): indicates automatic grouping, which is generally used less.
- cut(): represents a user-defined grouping, which is used most.
- Syntax: pd.cut(x, bins=, labels=, right =,)
- x represents a sequence (list, Series, etc.), that is, the data type we want to discretize.
- When defining grouping, bins can pass in a sequence for user-defined grouping.
- labels means to alias each group.
- right=False indicates the left closed right open interval. The default value is right=True, indicating the left open right closed interval.
- pd.cut() is usually associated with value_ Count() is used together to count the number of each group.
2) Instructions for using pd.cut() and pd.qcut()
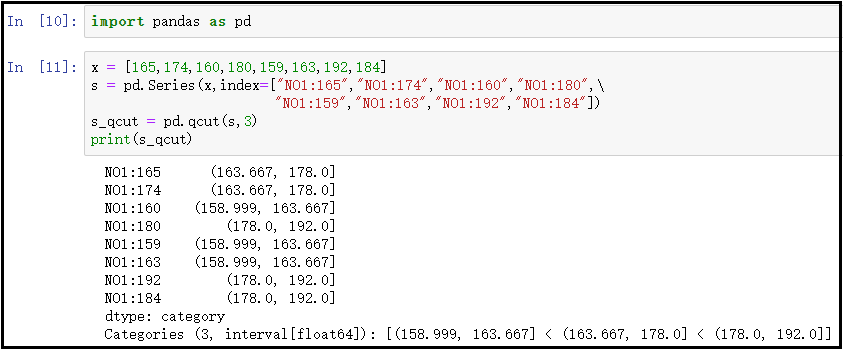
① Instructions for using pd.qcut()
x = [165,174,160,180,159,163,192,184]
s = pd.Series(x,index=["NO1:165","NO1:174","NO1:160","NO1:180",\
                       "NO1:159","NO1:163","NO1:192","NO1:184"])
s_qcut = pd.qcut(s,3)
print(s_qcut)
The results are as follows:
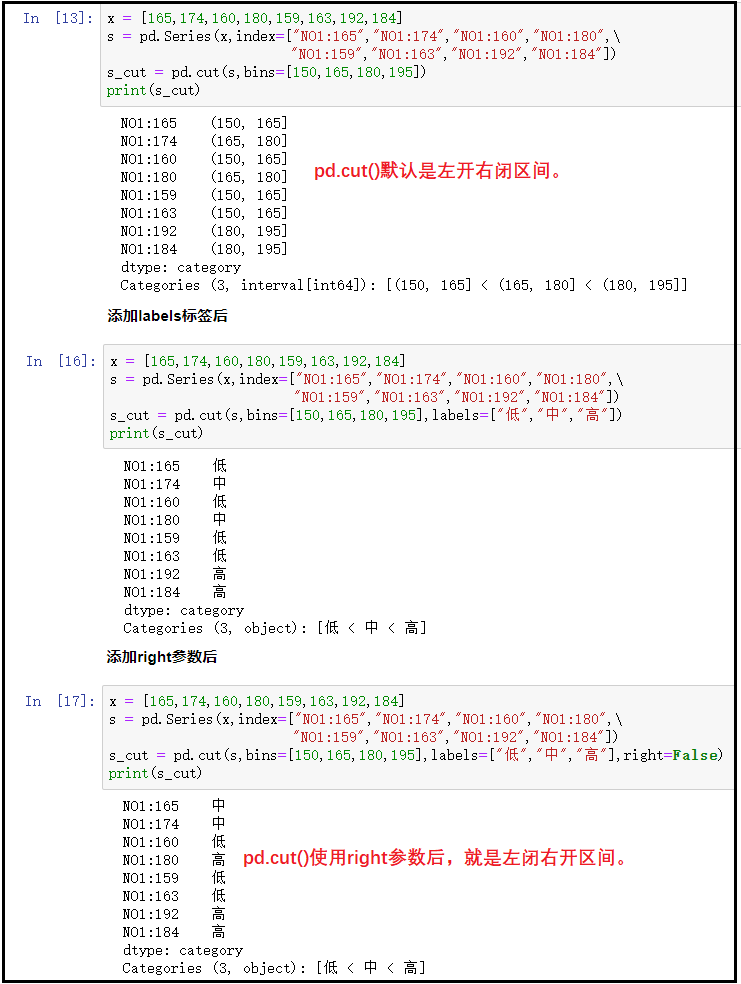
② Instructions for pd.cut()
x = [165,174,160,180,159,163,192,184]
s = pd.Series(x,index=["NO1:165","NO1:174","NO1:160","NO1:180",\
                       "NO1:159","NO1:163","NO1:192","NO1:184"])
s_cut = pd.cut(s,bins=[150,165,180,195])
print(s_cut)

# After adding the labels parameter
x = [165,174,160,180,159,163,192,184]
s = pd.Series(x,index=["NO1:165","NO1:174","NO1:160","NO1:180",\
                       "NO1:159","NO1:163","NO1:192","NO1:184"])
s_cut = pd.cut(s,bins=[150,165,180,195],labels=["low","in","high"])
print(s_cut)

# After adding the right parameter
x = [165,174,160,180,159,163,192,184]
s = pd.Series(x,index=["NO1:165","NO1:174","NO1:160","NO1:180",\
                       "NO1:159","NO1:163","NO1:192","NO1:184"])
s_cut = pd.cut(s,bins=[150,165,180,195],labels=["low","in","high"],right=False)
print(s_cut)
The results are as follows:
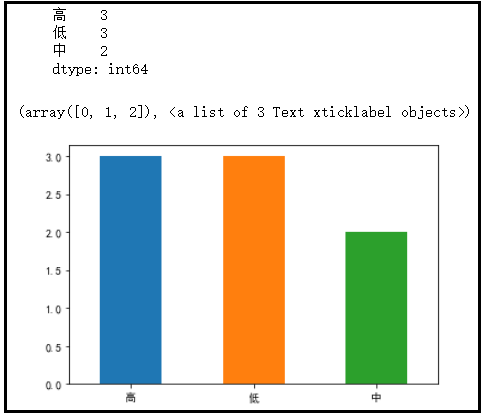
3) pd.cut() value_counts() use
import matplotlib.pyplot as plt
plt.rcParams["font.sans-serif"] = "SimHei"
plt.rcParams["axes.unicode_minus"] = False

x = [165,174,160,180,159,163,192,184]
s = pd.Series(x,index=["NO1:165","NO1:174","NO1:160","NO1:180",\
                       "NO1:159","NO1:163","NO1:192","NO1:184"])
s_cut = pd.cut(s,bins=[150,165,180,195],labels=["low","in","high"],right=False)
count = s_cut.value_counts()
print(count)

count.plot(kind="bar")
plt.xticks(rotation=360)
The results are as follows:
4. Post processing of discrete data (one hot coding)
whether continuous data variable or discrete data coding, it is a feature of data and has its unique meaning. However, for discrete data coding, text strings are generally displayed. Although we know them, the machine does not know them. Therefore, when processing these data, we need to turn them into numbers. for example, we have two sets of data. One set of data represents gender, one set of data represents species, and the other set of data represents hair. As shown below.
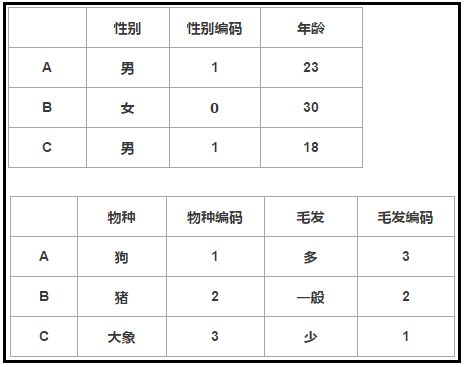
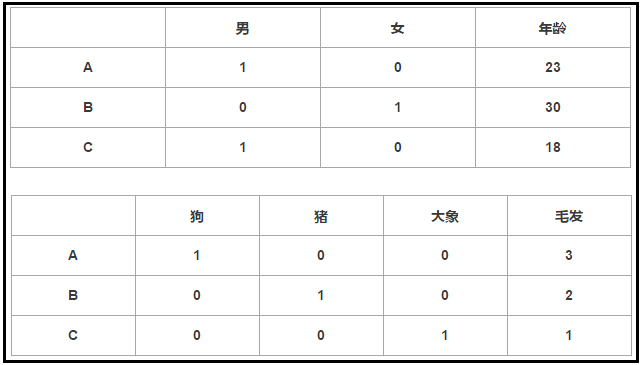
it can be seen from the figure. For gender, either male or female, the general processing method is to adopt binary coding, that is, "male = 1" and "female = 0". For species, there are many species. In the figure, we adopt the coding of 1, 2, 3... This format. For hair, we also adopt the coding of 1, 2, 3... This format. but it is obviously inappropriate. For gender and species, the coding method in the figure is obviously 3 > 2 > 1 > 0. The computer will equivalent such numbers, because there is a size relationship. However, for hair and educational background, it is possible to use this coding method. Therefore, the number of hair is different, and the educational background is high and low. Therefore, different numbers represent different levels. therefore, we need to use one hot coding. The final effect is as follows.
1)pd.get_ Use of Dummies (data, prefix =)
- data represents an array, Series, or DataFrame.
- Prefix means to prefix the packet.
① data is passed into a Series
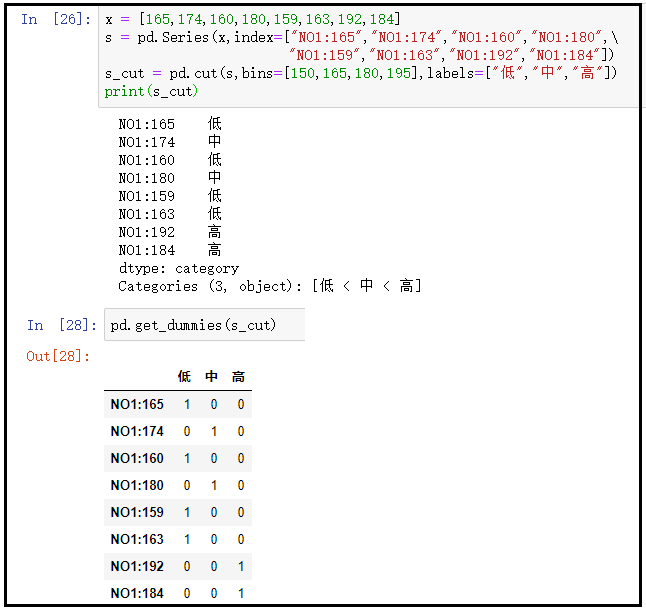
x = [165,174,160,180,159,163,192,184]
s = pd.Series(x,index=["NO1:165","NO1:174","NO1:160","NO1:180",\
                       "NO1:159","NO1:163","NO1:192","NO1:184"])
s_cut = pd.cut(s,bins=[150,165,180,195],labels=["low","in","high"])
print(s_cut)
pd.get_dummies(s_cut)
The results are as follows:
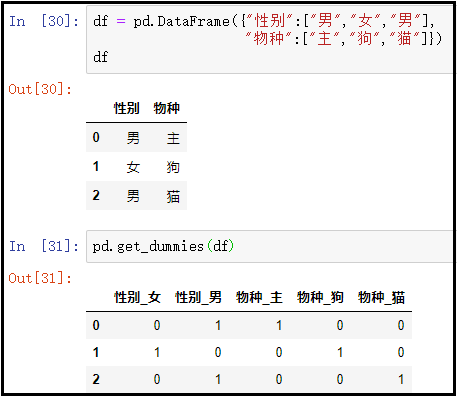
② data pass in a DataFrame
df = pd.DataFrame({"Gender":["male","female","male"],
                   "species":["main","dog","cat"]})
print(df)
pd.get_dummies(df)
The results are as follows: