Basic data structure
1. Series
For a Series, the most commonly used attributes are values, index, name, and dtype
s = pd.Series(np.random.randn(5),index=['a','b','c','d','e'],name='This is a Series',dtype='float64')
s

a   -0.152799
b   -1.208334
c    0.668842
d    1.547519
e    0.309276
Name: This is a Series, dtype: float64
Accessing Series properties
s.values
array([-0.15279875, -1.20833379,  0.6688421 ,  1.54751933,  0.30927643])
s.name
'This is a Series'
s.index
Index(['a', 'b', 'c', 'd', 'e'], dtype='object')
s.dtype
dtype('float64')
DataFrame
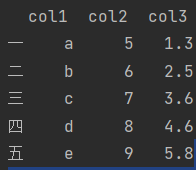
df = pd.DataFrame({'col1':list('abcde'),'col2':range(5,10),'col3':[1.3,2.5,3.6,4.6,5.8]},
                 index=list('one two three four five'))
df
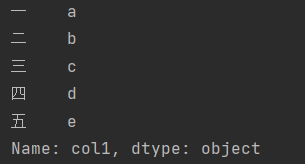
Take a column from the DataFrame as Series
df['coll']
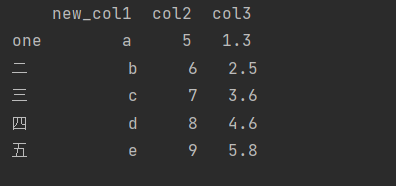
Modify row or column names
df.rename(index={'one':'one'},columns={'col1':'new_col1'})
Calling properties and methods
df.index
Index(['one', 'two', 'three', 'four', 'five'], dtype='object')
df.columns
Index(['col1', 'col2', 'col3'], dtype='object')
df.values
array([['a', 5, 1.3],
       ['b', 6, 2.5],
       ['c', 7, 3.6],
       ['d', 8, 4.6],
       ['e', 9, 5.8]], dtype=object)
df.shape
(5, 3)
Alignment properties of indexes
This is a very powerful feature in Pandas, for example
df1 = pd.DataFrame({'A':[1,2,3]},index=[1,2,3])
df2 = pd.DataFrame({'A':[1,2,3]},index=[3,1,2])
df1-df2

Deletion and addition of columns
For deletion, you can use the drop function or del or pop
Of course, it should be noted that when using the drop function, if the parameter inplace=True, it will be directly changed in the original DataFrame
df.drop(index='five',columns='col1')

df['col1']=[1,2,3,4,5]
del df['col1']
df
The pop method operates directly on the original DataFrame and returns the deleted column, which is similar to the pop function in python
df['col1']=[1,2,3,4,5]
df.pop('col1')
You can add new columns directly or use the assign method
However, the assign method will not modify the original DataFrame
df1['B']=list('abc')

Select columns by type
df.select_dtypes(include=['number']).head()
df.select_dtypes(include=['float']).head()
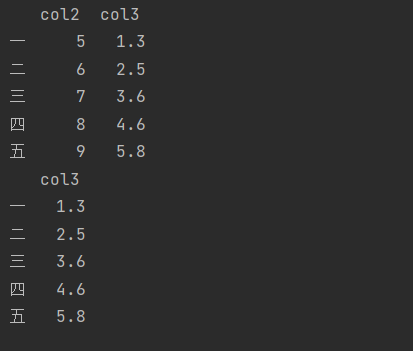
Finally, the T symbol can be transposed
2. Common functions
head and tail
Return to the original line: Head()
Return to the last line: Tail()
If no parameter is added in the default bracket, the first five lines or the last five lines will be selected by default
unique and nunique
nunique shows how many unique values there are
Unique displays all unique values
count and value_counts
count returns the number of elements in a row or column
value_counts returns the number of each element
info and describe
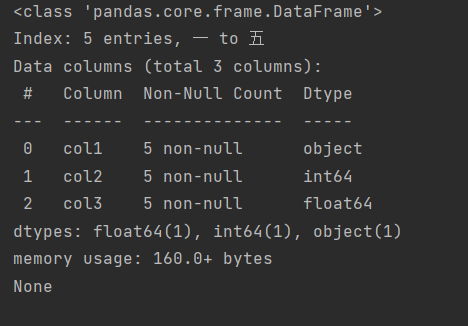
The info function returns which columns are there, how many non missing values are there, and the type of each column
describe the statistics of numerical data by default
df.info()
df.describe()
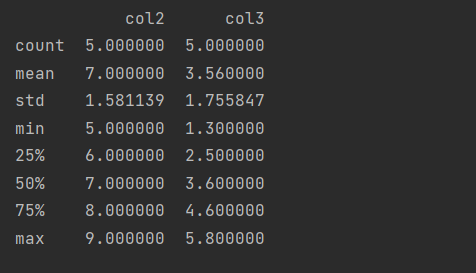
You can also choose the quantile by yourself
df.describe(percentiles=[.05, .25, .75, .95])
For non numeric types, you can also use the describe function
idxmax and nlargest
The idxmax function returns the index of the maximum value, which is especially applicable in some cases. The idxmin function is similar
The nlargest function returns the first few large element values, and the function of nsmallest is similar
df['ciol1'].nlargest(3)

clip and replace
clip and replace are two types of replacement functions
clip is to truncate the number that exceeds or falls below some value
Replace is to replace some values
7. apply function
This function has a high degree of freedom, which I will explain specifically.