1, Algorithm principle
1. Principle overview
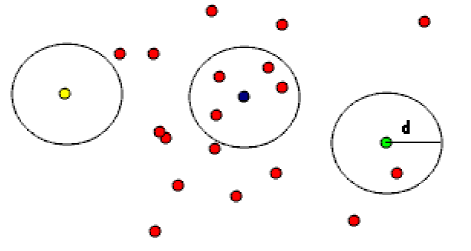
there will be some outliers in the breakpoint data, which may be caused by external factors such as noise. If these outliers participate in clustering, it will seriously affect the clustering results, so they must be removed. The outliers are removed by the method of removing radius outliers in PCL filtering module. The principle is: in the point cloud data, the user specifies that there must be at least enough neighbors around each point within a certain range, otherwise it will be deleted. As shown in Figure 1, if each point is specified to have at least one neighbor within distance d, the yellow point will be deleted. If at least two neighbors are specified, both yellow and green points will be deleted.

2. Implementation process
First, input point cloud data;
Second, set the number threshold of points in the circle;
Third, set different neighborhood search thresholds for the search Radius radius of query points;
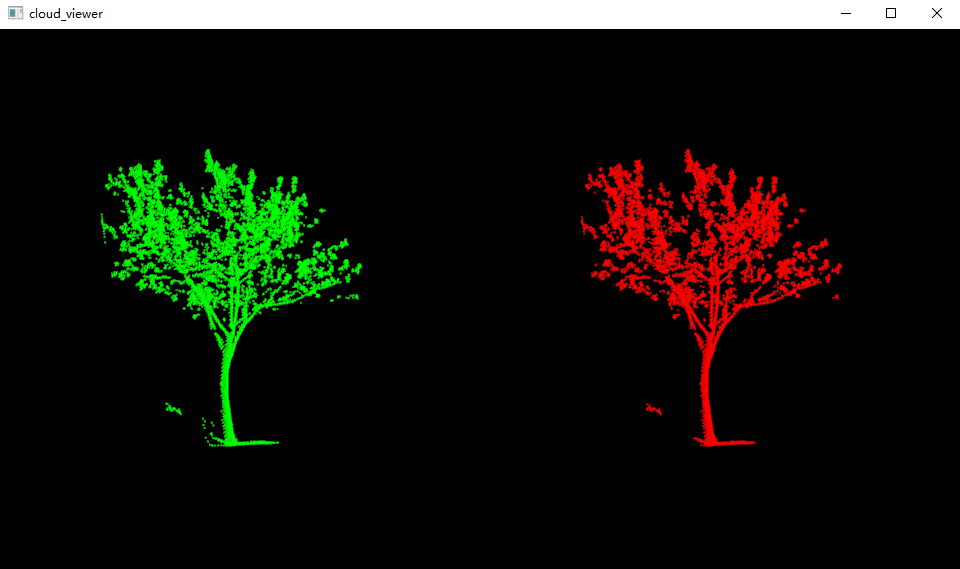
Fourth, filter discrete points, visualize, observe and compare the filtering effects of different thresholds, and determine the best denoising threshold.
3. References
[1] Xu Yongchao, song Jianguo, Li Zhe, Zhang Jiwei, Yu Mingkai. 3D breakpoint data clustering method based on PCL [A]. Professional Committee of oil and gas geophysics of Chinese Geophysical Society. Proceedings of the fourth annual academic conference of oil and gas geophysics [C]. Professional Committee of oil and gas geophysics of Chinese Geophysical Society: Professional Committee of oil and gas geophysics of Chinese Geophysical Society, 2021:4
[2] Li Ruixue, Zou Jiwei. Research on Point Cloud Filtering Algorithm Based on PCL library [J]. Satellite TV and broadband multimedia, 2020 (13): 237-238
2, Code implementation
from pclpy import pcl


def point_cloud_viewer(cloud, cloud_filtered):
    # Open 3D viewer and add point cloud and normals
    viewer = pcl.visualization.PCLVisualizer("cloud_viewer")
    v0 = 1
    viewer.createViewPort(0.0, 0.0, 0.5, 1.0, v0)
    viewer.setBackgroundColor(0.0, 0.0, 0.0, v0)
    single_color = pcl.visualization.PointCloudColorHandlerCustom.PointXYZ(cloud, 0.0, 255.0, 0.0)
    viewer.addPointCloud(cloud, single_color, "sample cloud1", v0)

    v1 = 2
    viewer.createViewPort(0.5, 0.0, 1.0, 1.0, v1)
    viewer.setBackgroundColor(0.0, 0.0, 0.0, v1)
    single_color = pcl.visualization.PointCloudColorHandlerCustom.PointXYZ(cloud_filtered, 255.0, 0.0, 0.0)
    viewer.addPointCloud(cloud_filtered, single_color, "sample cloud2", v1)

    viewer.setPointCloudRenderingProperties(0, 1, "sample cloud1", v0)
    viewer.setPointCloudRenderingProperties(0, 1, "sample cloud2", v1)
    # viewer.addCoordinateSystem(1.0)  # Display axis
    while not viewer.wasStopped():
        viewer.spinOnce(10)


if __name__ == '__main__':
    # Read point cloud data
    cloud = pcl.PointCloud.PointXYZ()
    cloud_filtered = pcl.PointCloud.PointXYZ()
    reader = pcl.io.PCDReader()
    reader.read('tree.pcd', cloud)
    print("The number of points before filtering is: ", cloud.size())

    # Create radius filter
    ror = pcl.filters.RadiusOutlierRemoval.PointXYZ()
    ror.setInputCloud(cloud)  # Input point cloud
    ror.setRadiusSearch(0.2)  # Set the radius to 0.2m to find adjacent points
    ror.setMinNeighborsInRadius(10)  # Set the number of neighborhood point sets of query points to be less than 10 and delete
    ror.filter(cloud_filtered)
    print("The number of points after radius filtering is: ", cloud_filtered.size())

    # writer = pcl.io.PCDWriter()
    # writer.write("rs.pcd", cloud_filtered)
    # Visualization results
    point_cloud_viewer(cloud, cloud_filtered)
3, Result display
