1. Overview
Performance analysis of IO has always been one of the focuses of performance analysis, and the idea of analysis is:

With clear logic in the code, you can completely know which files are read and written frequently. But for performance analysts, it's often a system that's not written by them, or sometimes produced by multiple teams. There will be a lot of evasions and disputes. If you can quickly put the problem into a specific code, to a specific file, you can improve the efficiency of communication.
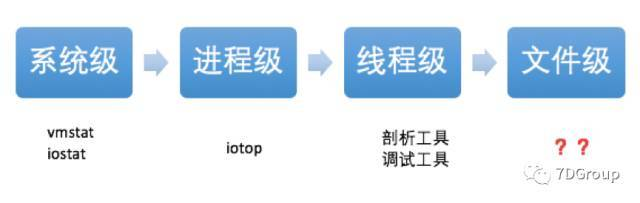
Usually in linux environment, disk IO exceptions can be found through vmstat or iostat command, system-level disk read and write and CPU usage can be seen, but it is not clear which process is causing the problem. After iotop is installed, it can be located to the process, but it does not know what file the improvement process is operating on.
2. Core Principles
This article considers this from a system-level tool, which is more versatile. Before that, you need to understand one of the important properties of a file: inode.
What is inode? Let's start with a diagram:
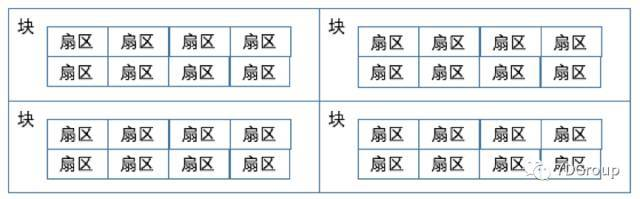
The smallest unit of storage on disk is the sector sector, where each eight sectors form a block (4096 bytes). As follows:
[root@7DGroup2 ~]# tune2fs -l /dev/vda1|grep  Block
Block count:              10485504
Block size:               4096
Blocks per group:         32768
[root@7DGroup2 ~]#
File storage consists of these blocks, and when there are more, it becomes like this (there are actually many more blocks on disk than in this diagram, here is just a diagram):
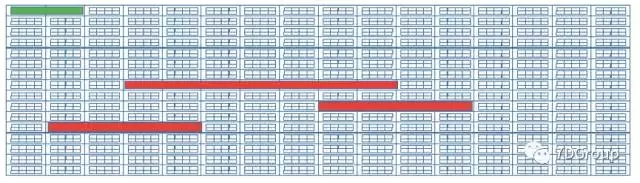
The red part is the stored file, and we usually operate on paths when operating files directly on the file system or with other commands, which are the upper commands. When we execute a command, the operating system will find these files to do the appropriate operation, how to find these files, then inode is needed. Inode stores meta-information for these files, which is the index node. It includes information such as:
- Number of bytes
- User ID
- Group ID
- Read, write, execute permissions
- There are three timestamps: ctime refers to the time when the inode was last changed, mtime refers to the time when the file content was last changed, atime refers to the time when the file was last opened
- Number of links, how many file names point to this inode
- Location of File Data block
With this information, we can operate on files. This inode is actually stored on disk and takes up some space, as shown in the green section in the figure above.
When we see high IO at the system level, as shown in the following figure:
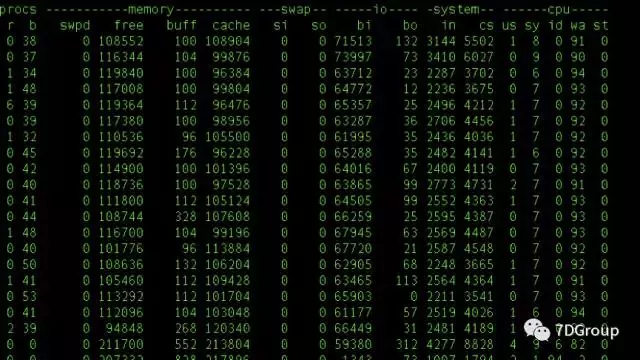
As you can see from the figure above, almost all CPU s in this system are waiting for IO. What should I do now? Look at the IO at the process and thread levels using the analysis ideas we mentioned earlier to find specific files. Let's do it.
Here we're using systemtap, which was mentioned in a previous article about the tool 7Dgroup, but it's not expanded. Later, if possible, we'll write a few more similar tools and how to use them.
The logical diagram of Systemtap is as follows:
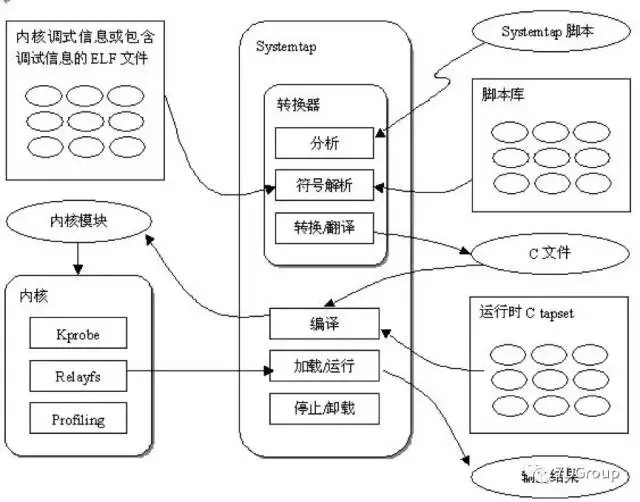
From a logical diagram, it works at the core level, not at the shell level.
SystemTap opens the door to the system's core, and its own examples provide some examples of disk IO-related monitoring.
With iotop.stp for example, the source code is as follows:
#!/usr/bin/stap
global reads, writes, total_io

probe vfs.read.return {
    reads[execname()] +=  bytes_read
}

probe vfs.write.return {
    writes[execname()] +=  bytes_written
}


# print top 10 IO processes every 5 seconds
probe timer.s(5) {
    foreach (name in writes)
        total_io[name] +=  writes[name]
    foreach (name in reads)
        total_io[name] +=  reads[name]

    printf ("%16s\t%10s\t%10s\n",  "Process", "KB Read", "KB Written")

    foreach (name in total_io-  limit 10)
         printf("%16s\t%10d\t%10d\n", name,
                reads[name]/1024, writes[name]/1024)

    delete reads
    delete writes
    delete total_io
    print("\n")

}
The result is that the top 10 processes in total read and write are printed every 5 seconds.
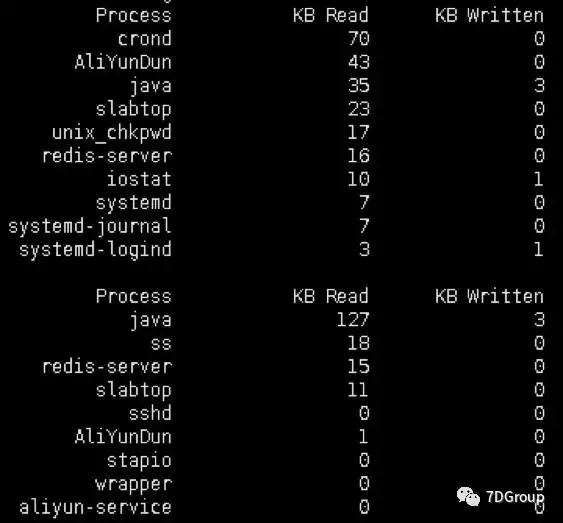
The script has two problems:
-
According to the process name statistics, there are statistical errors, process names are identical, but processes with different PID s are all counted together.
-
We still don't know what files the process manipulated.
By analyzing the probe point (sudo stap-L'vfs. {write, read}'), we know that vfs.read, vfs.write has a local variable ino to use, ino is the inode of the file, so we can clearly detect the processes and files that read and write the most.
$ sudo stap -L 'vfs.{write,read}'
vfs.read  file:long pos:long buf:long bytes_to_read:long dev:long devname:string  ino:long name:string argstr:string $file:struct file* $buf:char*  $count:size_t $pos:loff_t*
vfs.write  file:long pos:long buf:long bytes_to_write:long dev:long devname:string  ino:long name:string argstr:string $file:struct file* $buf:char const*  $count:size_t $pos:loff_t*
The extended script is as follows:
#!/usr/bin/stap
global reads, writes, total_io

probe vfs.read.return {
     reads[execname(),pid(),ino] += bytes_read
}


probe vfs.write.return {
     writes[execname(),pid(),ino] += bytes_written
}


# print top 10 IO processes every 5 seconds
probe timer.s(5) {
    foreach  ([name,process,inode] in writes)
         total_io[name,process,inode] += writes[name,process,inode]
    foreach ([name,process,inode] in reads)
         total_io[name,process,inode] += reads[name,process,inode]
    printf  ("%16s\t%8s\t%8s\t%10s\t%10s\n", "Process",  "PID", "inode", "KB Read", "KB  Written")
    foreach  ([name,process,inode] in total_io- limit 10)
         printf("%16s\t%8d\t%8d\t%10d\t%10d\n", name,process,inode,
                reads[name,process,inode]/1024, writes[name,process,inode]/1024)

    delete reads
    delete writes
    delete total_io
    print("\n")
}
3. An experiment
Let's do an experiment and execute the dd command to do a high disk read-write operation.
The following commands are executed:
dd bs=64k count=4k if=/dev/zero of=test oflag=dsync
The effect of this command is that dd writes synchronously every time it executes, reads 64 k of data from/dev/zero, and writes to the test file in the current directory, a total of 4 K repetitions. On linux systems, /dev/zero is a special file that provides infinite empty characters (NULL, ASCII NUL, 0x00) when you read it.
Iotop. The STP monitoring results are as follows:
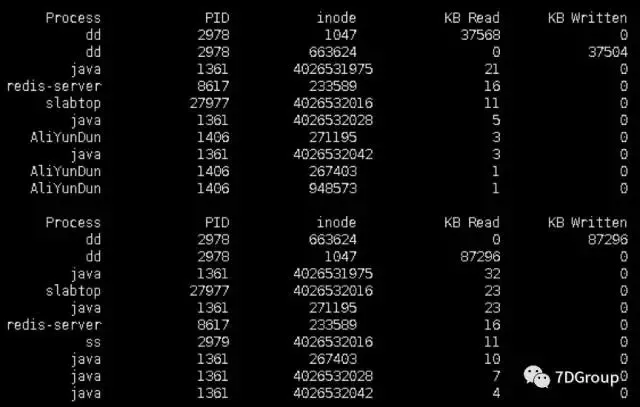
By monitoring, we know that the dd process with PID 2978 reads inode 1047 files and writes inode 663624 files, which are the operations with the most reads and writes.
Normally, we don't know where the inode file is located, so we can find it by find / -inum 1047.
With the stat command, we can see a detailed description of the file inode.
$ stat /dev/zero
   Files:"/dev/zero"
   Size: 0           Block: 0          IO Block: 4096 character special file
 Device: 5 h/5d     Inode: 1047        Hard link: 1     Device type: 1,5
 Jurisdiction:(0666/crw-rw-rw-)  Uid: (    0/     root)   Gid: (    0/     root)
Environmental Science: system_u:object_r:zero_device_t:s0
 Recent Visits: 2017-05-02  10:50:03.242425632 +0800
 Recent changes: 2017-05-02  10:50:03.242425632 +0800
 Recent changes: 2017-05-02  10:50:03.242425632 +0800
 Creation time:-
This analytical thinking can be used in any system, but different systems use different tools. The environment used this time is CentOS, and in other systems, only other tools can be found.
4. Summary
Again, the key point of performance analysis is to understand the principles and clarify the ideas. Tools are used to validate ideas. Never let go of the cost.