Performance tuning cases
| time | 2021-09-02 |
|---|---|
| environment | centos7. 6. JMeter, redis, mysql, Java applications |
1, jmeter's command line uses
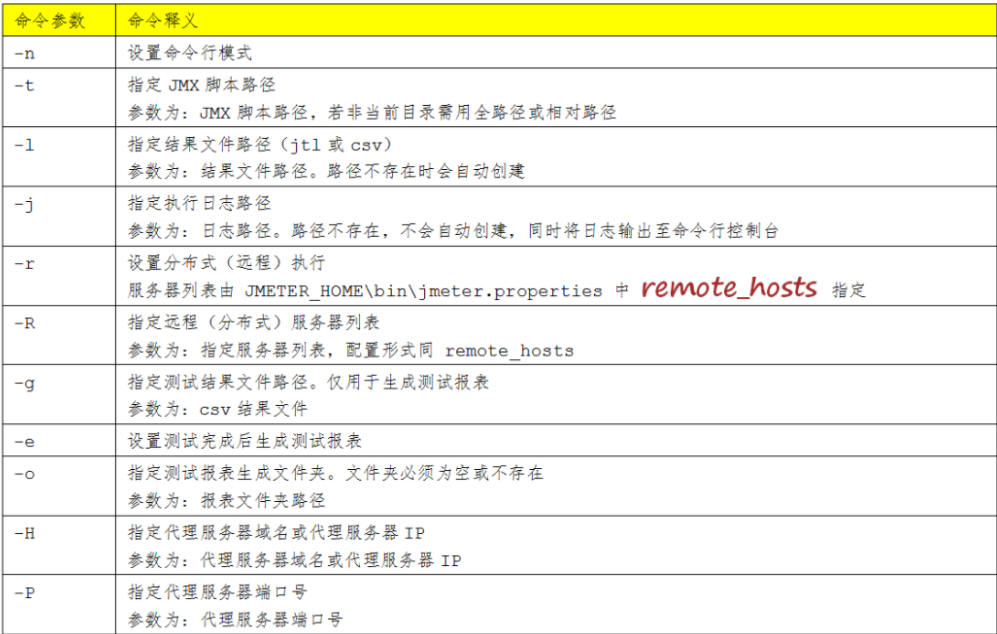
give an example:
# Run in command line mode and execute test JMX test script, and save the test results to result In JTL
jmeter   -n   -t   test.jmx   -l  result.jtl
# Specify IP distributed operation
jmeter -n -t test1.jmx -R 192.168.10.25:1036 -l report\01-result.csv -j report\01-log.log
jmeter command output format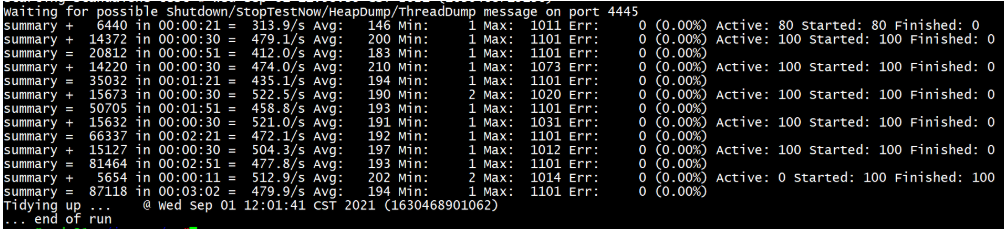
summary + 6440 in 00:00:21 313.9/s means that 6440 test cases are executed in 21 seconds, with an average of 313.9 executed per second, that is, TPS=313.9
6440 / 21 = 306.7, how is TPS calculated?
Avg average response time, Min minimum response time, Max maximum response time
active: the number of threads currently executing, start: the number of threads starting execution, and finish: the number of threads ending execution
In the first line, in 00:00:21 active 80 means that 80 threads have been started. In the second line, in 00:00:30, active 100 means that 100 threads have been started
Number of threads: simulate virtual users
Requests: the number of requests initiated by these virtual users. Requests > threads
2, JVM tuning js, jmap, jstat
(1) Official website document https://docs.oracle.com/javase/1.5.0/docs/tooldocs/share/jmap.html
(2) Jmap command
Java Virtual Machine Memory Map generates a memory dump snapshot of the virtual machine (heapdump) file. The jmap command can obtain a snapshot of the heap of the running jvm, so that you can analyze the heap offline to check memory leaks, check the creation of some large objects that seriously affect performance, check what objects are the most in the system, the memory size occupied by various objects, etc. you can use jmap to generate Heap Dump.
Reference documents: https://blog.csdn.net/jiang_zf/article/details/79540234
-Heap displays Java heap details, such as which collector to use, parameter configuration, generation status, and so on
-histo displays statistics of objects in the heap, including classes, number of instances, and total capacity
View the usage of java heap
###Start the card closing service: first start the middleware databases such as reids, rocketmq and MYSQL, and then start the card management application. Check the application log to see if the startup is normal
[root@iZbp1ecjj2jqnihvrx19piZ ehcServer]# jps     # View processes using the JVM
8027 Jps
7967 WrapperSimpleApp
[root@iZbp1ecjj2jqnihvrx19piZ ehcServer]# jmap -heap   7967
Attaching to process ID 7967, please wait...
Debugger attached successfully.
Server compiler detected.
JVM version is 25.231-b11

using thread-local object allocation.
Parallel GC with 2 thread(s)       # Default cpu cores for gc (garbage collection) threads

Heap Configuration:  #Heap memory initialization configuration
   MinHeapFreeRatio         = 0    #-20: Minheapfreeratio sets the minimum idle ratio of JVM heap
   MaxHeapFreeRatio         = 100  #-20: Maxheapfreeratio sets the maximum idle ratio of the JVM heap
   MaxHeapSize              = 1073741824 (1024.0MB)  #-20: Maxheapsize = set the maximum size of JVM heap, and the default memory size is 1 / 4
   NewSize                  = 357564416 (341.0MB)	 #-20: Newsize = sets the default size of the 'new generation' of the JVM heap
   MaxNewSize               = 357564416 (341.0MB)    #-20: Maxnewsize = sets the maximum size of the 'Cenozoic' of the JVM heap
   OldSize                  = 716177408 (683.0MB)    #-20: Oldsize = sets the size of the 'older generation' of the JVM heap
   NewRatio                 = 2		#-20: Newratio =: 'new generation' and 'old generation' size ratio
   SurvivorRatio            = 8      #-20: Survivorratio = set the size ratio of Eden area to Survivor area in the young generation
   MetaspaceSize            = 21807104 (20.796875MB)
   CompressedClassSpaceSize = 1073741824 (1024.0MB)
   MaxMetaspaceSize         = 17592186044415 MB
   G1HeapRegionSize         = 0 (0.0MB)

Heap Usage:
PS Young Generation
#Memory distribution in Cenozoic area, including Eden Park + 1 Survivor area
Eden Space:  #Eden memory distribution
   capacity = 284164096 (271.0MB)
   used     = 149041648 (142.13719177246094MB)
   free     = 135122448 (128.86280822753906MB)
   52.44914825552064% used
From Space:
   capacity = 36700160 (35.0MB)
   used     = 36678544 (34.97938537597656MB)
   free     = 21616 (0.0206146240234375MB)
   99.94110107421875% used
To Space:
   capacity = 36700160 (35.0MB)
   used     = 0 (0.0MB)
   free     = 36700160 (35.0MB)
   0.0% used
PS Old Generation
   capacity = 716177408 (683.0MB)
   used     = 152398744 (145.3387680053711MB)
   free     = 563778664 (537.6612319946289MB)
   21.279468229190496% used

26423 interned Strings occupying 2749688 bytes.
(3) Tuning parameters
Default standard of parameter call: the default xmx (maximum heap memory) of jvm is 1 / 4 of the machine memory, the default number of cpu cores of gc thread, and the parallel of gc algorithm
-Xmx3550m   #JVM maximum available memory
-Xms3550m   #Set the JVM initial memory to 3550m. This value can be set to the same value as - Xmx to avoid the JVM reallocating memory after each garbage collection.
USEG1GC    UseParallelGC      #GC mode. Parallel GC is generally used https://www.cnblogs.com/yuanzipeng/p/13374690.html
wrapper.java.additional.2=-XX:+UseParallelGC
wrapper.java.addtional.11=-Xms1g
wrapper.java.addtional.12=-Xmx1g
(4) Check tuning jstat
Dynamic view: use jstat to count the frequency and time-consuming of jvm in memory recycling and whether there is full gc. Use this data to evaluate whether a memory configuration parameter and gc parameter are reasonable. YGC YGCT FGC FGCT
[root@iZbp1ecjj2jqnihvrx19piZ conf]# jps
16723 Jps
22046 WrapperSimpleApp
[root@iZbp1ecjj2jqnihvrx19piZ conf]# jstat -gc  22046
 S0C    S1C    S0U    S1U      EC       EU        OC         OU       MC     MU    CCSC   CCSU   YGC     YGCT    FGC    FGCT     GCT
3584.0 3584.0 2304.0  0.0   342016.0 173818.6  699392.0   257431.9  81944.0 77727.9 9776.0 9054.6    530   17.479   3      1.521   19.001

#S0C: size of the first surviving area
#S1C: size of the second surviving area
#S0U: use size of the first surviving area
#S1U: use size of the second surviving area
#EC: the size of Eden Park
#EU: use size of Eden Park
#OC: old age size
#OU: size used in old age
#MC: method area size
#MU: size of method area
#CCSC: compressed class space size
#CCSU: compressed class space usage size
#YGC: garbage collection times of the younger generation
#YGCT: waste collection time of young generation
#FGC: garbage collection times in old age
#FGCT: waste collection time in old age
#GCT: total time consumed by garbage collection (how much time is normal? The less, the better)
#Reference article: https://www.cnblogs.com/sxdcgaq8080/p/11089841.html
3, Redis tuning
1. Set the maximum memory that redis can use
maxmemory 2g
2 replacement strategy after reaching the maximum memory
#If the maximum memory is reached, the replacement strategy needs to be set (analogous to the memory space managed by the operating system, and the memory is replaced by LRU, FIFO and other algorithms)
maxmemory-policy   volatile-lru
When Redis memory usage reaches maxmemory, you need to select the set maxmemory policy to replace the old data.
(1) noeviction: no replacement means that no replacement will be performed even if the memory reaches the upper limit. All commands that can cause memory increase will return error
(2) Allkeys LRU: delete the least frequently used keys first to save new data
(3) Volatile LRU: only select the most infrequently used key from the keys that expire set to delete to save new data
(4) All keys random: randomly select some keys from all keys to delete to save new data
(5) Volatile random: only select some keys from the expired set keys to delete to save new data
(6) Volatile TTL: only select the key with the shortest TTL from the keys with expired set to delete to save new data
Is the expiration time of the key set in the code? What is the appropriate expiration time? If the expiration time is not set, the allkeys LRU algorithm is more appropriate.
Suggestions for selecting maxmemory policy:
(1) If all keys are the most frequently used recently, you need to select allkeys LRU to replace the least frequently used key. If you are not sure which strategy to use, allkeys LRU is recommended
(2) If the access probabilities of all keys are similar, you can use the allkeys random policy to replace the data
(3) If you know enough about the data and can specify hint for the key (specified by expire/ttl), you can select volatile TTL for replacement
3. If the business does not need redis persistence, close it
RDB is enabled by default, and can be closed by commenting out three lines of sava
AOF closes appendonly no by default
After redis turns off persistence, each redis request does not need to brush the disk, which can improve performance
4, Mysql optimization
Tuning criteria: try to read less disk and cross network
1. SQL statement optimization
2 index optimization
3 configuration optimization
innodb_buffer_pool_size=3G
innodb_flush_log_at_trx_commit=2
sync_binlog=10
(1)innodb_buffer_size
innodb_buffer_size cached content
Data caching – this is definitely its most important purpose
Index cache – this is the same buffer pool used
Buffering – changed data (often referred to as dirty data) is buffered before being flushed to the hard disk
Storage internal structure – some structures such as adaptive hash index or row lock are also stored in the InnoDB buffer pool
innodb_buffer_size sets the size of the
In a stand-alone system that uses only the InnoDB engine MySQL In the server, according to experience, it is recommended to set InnoDB buffer pool size to 50% ~ 80% of the total available memory of the server
Change innodb_buffer_size command
root identity
mysql> SET GLOBAL innodb_buffer_pool_size=size_in_bytes;
Reference link: https://blog.csdn.net/weixin_41782053/article/details/87269158
(2) innodb_flush_log_at_trx_commit (when log_buffer writes to disk memory mapped cache)
mysql cache (log_buffer) -- disk memory mapping (CACHE) -- disk
Log writing to disk requires two caches, one of which is mysql's own log_buffer, the other is the disk memory mapping cache of the operating system (the cache between disk and memory)
mysql can call flush to actively refresh the log buffer to the disk memory mapping, or call fsync to force the operating system to synchronize the disk mapping file to the disk. You can also call flush + fsync at the same time to drop the cache directly to the disk.
innodb_flush_log_at_trx_commit = 0 means that flush + fsync is called every second, and the timer Mysql maintains itself. If Mysql crashes, 1s data will be lost
innodb_flush_log_at_trx_commit = 1 is to call flush + fsync in real time. Batch processing is impossible and the performance is very low.
innodb_flush_log_at_trx_commit = 2 means real-time flush, timing fsync, timer OS maintenance. Operating system crash will lose 1s data
Reference link: https://blog.csdn.net/u010833547/article/details/109293213
(3) sync_binlog=0|n (when disk memory mapping is written to disk)
sync_binlog=0. The operating system determines when to write. The performance is the best and the risk is the greatest.
After the transaction is committed, MySQL does not perform disk synchronization instructions such as fsync to refresh the binlog_ The information in the cache is sent to the disk, and the file system decides when to synchronize, or synchronize to the disk only after the cache is full.
sync_binlog=n every time a transaction is committed n times, mysql calls fsync to write the disk memory map to the disk.
After every n transaction commits, MySQL will perform a disk synchronization instruction such as fsync to synchronize the binlog_ The data in the cache is forced to write to the disk.
https://www.cnblogs.com/jpfss/p/10772952.html
5, Error reporting and summary:
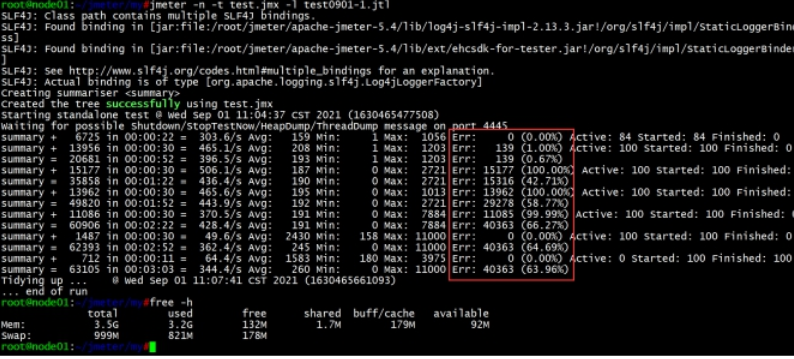
1. When JMeter executes test cases, the error rate of test cases is high
There may be insufficient server resources.
2. During pressure measurement, nginx log access The log has not changed
The df -h disk is full, or the log is not enabled in the nginx configuration, or the user request has not passed through nginx.
3 understand the path requested by the user
For example:
The user sends a request ---- > nginx ---- > java application ---- > redis cache ---- > MySQL database
The user sends a request --------- > java application --------- > redis cache --------- > MySQL database
4 pressure measurement execution process
Start service: start middleware and database, and then start service
 Check the service: check the application log and verify that it is started successfully
 Perform pressure test
 View the response time of the request: for example, in ngixn Add people to the log $request_time
 Check the status of middleware and database: for example jvm of GC Times and time, mysql Slow log for
 View system hardware indicators: CPU Utilization, memory utilization, find processes that consume more resources.