At present, there are few visual data about PointNet + + prediction results on the Internet, which are generally direct visual data sets. Here is a code I use Matplotlib to visualize prediction. I hope it can be helpful to you.
Principle:
Briefly explain the principle of the code. Firstly, we use the network to give the prediction results of the input image and store them as txt files; Then use Matplotlib to read txt files and draw 3d images.
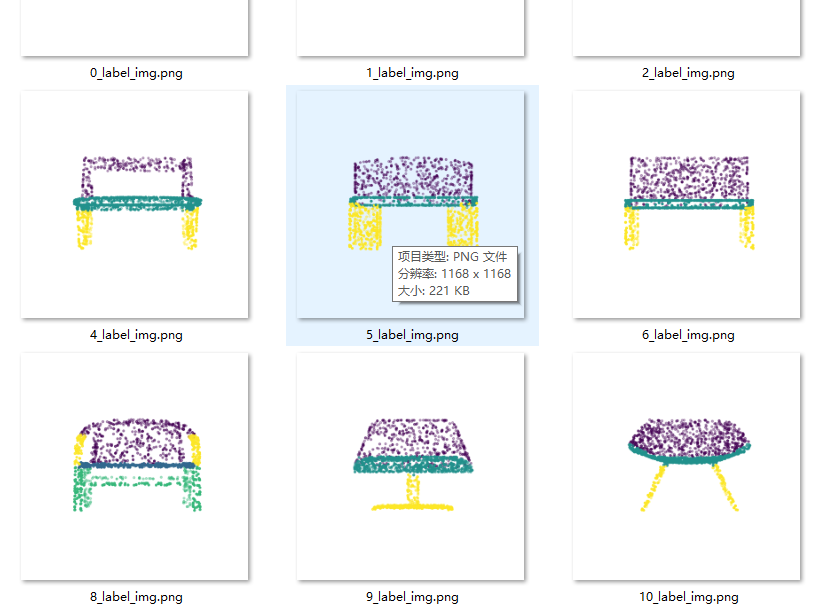
Prediction effect
Since the 3d image cannot be displayed directly and requires specific software, we can only convert it into 2d image and report an error. The results are as follows
Preparation of materials
1) Network model. This code is based on PointNet + + of pytorch version, so the input and output format of the network model should be consistent. (comments will be made in the code)
2) Data set. Now that the prediction results are ready, we should have a more detailed understanding of the overall process of the network. The preparation of data sets will not be introduced in detail here. It should be noted that different data sets output different contents. For example, ShapeNet will output point cloud images, label (classification category) and target (segmentation category), while S3DIS will only output point cloud images and segmentation categories. Here we need to adjust.
3) Trained weight file. Save the trained weight file in PointNet + + format.
When the above materials are ready, you can start preparing to generate prediction results.
Main code
class Generate_txt_and_3d_img:
    def __init__(self,img_root,target_root,num_classes,testDataLoader,model_dict,color_map=None):
        self.img_root = img_root # Point cloud data path
        self.target_root = target_root  # Generate txt label and forecast result path
        self.testDataLoader = testDataLoader
        self.num_classes = num_classes
        self.color_map = color_map
        self.heat_map = False # Controls whether heatmap is output
        self.label_path_txt = os.path.join(self.target_root, 'label_txt') # txt file for label
        self.make_dir(self.label_path_txt)

        # Get the model and load the weight
        self.model_name = []
        self.model = []
        self.model_weight_path = []

        for k,v in model_dict.items():
            self.model_name.append(k)
            self.model.append(v[0])
            self.model_weight_path.append(v[1])

        # Load weight
        self.load_cheackpoint_for_models(self.model_name,self.model,self.model_weight_path)

        # create folder
        self.all_pred_image_path = [] # Path list of all forecast results
        self.all_pred_txt_path = [] # A list of all predicted paths
        for n in self.model_name:
            self.make_dir(os.path.join(self.target_root,n+'_predict_txt'))
            self.make_dir(os.path.join(self.target_root, n + '_predict_image'))
            self.all_pred_txt_path.append(os.path.join(self.target_root,n+'_predict_txt'))
            self.all_pred_image_path.append(os.path.join(self.target_root, n + '_predict_image'))
        "Forecast corresponding to the model txt Results and img When the results are generated, several elements are added to the list corresponding to several models"

        self.generate_predict_to_txt() # Generate forecast txt
        self.draw_3d_img() # Drawing

    def generate_predict_to_txt(self):

        for batch_id, (points, label, target) in tqdm.tqdm(enumerate(self.testDataLoader),
                                                                      total=len(self.testDataLoader),smoothing=0.9):

            #Point cloud data, label of the whole image, label of each point, point cloud data without normalization (with label) torch Size([1, 7, 2048])
            points = points.transpose(2, 1)
            #print('1',target.shape) # 1 torch.Size([1, 2048])
            xyz_feature_point = points[:, :6, :] # B C N ---->B N C
            # Save the label as a txt file
            point_set_without_normal = np.asarray(torch.cat([points.permute(0, 2, 1),target[:,:,None]],dim=-1)).squeeze(0)  # Generation labels have no normalized numpy form of point cloud data
            np.savetxt(os.path.join(self.label_path_txt,f'{batch_id}_label.txt'), point_set_without_normal, fmt='%.04f') # Store it as a txt file
            " points  torch.Size([16, 2048, 6])  label torch.Size([16, 1])  target torch.Size([16, 2048])"

            assert len(self.model) == len(self.all_pred_txt_path) , 'The path does not match the number of models, please check'

            for n,model,pred_path in zip(self.model_name,self.model,self.all_pred_txt_path):
                points = points.long()
                seg_pred, trans_feat = model(points, self.to_categorical(label, 16))
                seg_pred = seg_pred.cpu().data.numpy()
                #=================================================

                seg_pred = np.argmax(seg_pred, axis=-1)  # Obtain the prediction results b n c of the network
                #=================================================
                seg_pred = np.concatenate([np.asarray(xyz_feature_point), seg_pred[:, None, :]],
                        axis=1).transpose((0, 2, 1)).squeeze(0)  # Splice the point cloud with the prediction results and prepare to generate a txt file
                svae_path = os.path.join(pred_path, f'{n}_{batch_id}.txt')
                np.savetxt(svae_path,seg_pred, fmt='%.04f')

    def draw_3d_img(self):
        #   Call matpltlib to draw 3d images

        each_label = os.listdir(self.label_path_txt)  # All label txt paths
        self.label_path_3d_img = os.path.join(self.target_root, 'label_3d_img')
        self.make_dir(self.label_path_3d_img)

        assert  len(self.all_pred_txt_path) == len(self.all_pred_image_path)


        for i,(pre_txt_path,save_img_path,name) in enumerate(zip(self.all_pred_txt_path,self.all_pred_image_path,self.model_name)):
            each_txt_path = os.listdir(pre_txt_path) # Get the full name of the txt file

            for idx,(txt,lab) in tqdm.tqdm(enumerate(zip(each_txt_path,each_label)),total=len(each_txt_path)):
                if i == 0:
                    self.draw_each_img(os.path.join(self.label_path_txt, lab), idx,heat_maps=False)
                self.draw_each_img(os.path.join(pre_txt_path,txt),idx,name=name,save_path=save_img_path,heat_maps=self.heat_map)

        print(f'All forecast pictures have been generated. Please go to:{self.all_pred_image_path} see')

    def draw_each_img(self,root,idx,name=None,skip=1,save_path=None,heat_maps=False):
        "root: each txt Path to file"
        points = np.loadtxt(root)[:, :3]  # xyz coordinates of point cloud
        points_all = np.loadtxt(root)  # All coordinates of the point cloud
        points = self.pc_normalize(points)
        skip = skip  # Skip every n points

        fig = plt.figure()
        ax = fig.add_subplot(111, projection='3d')
        point_range = range(0, points.shape[0], skip)  # skip points to prevent crash
        x = points[point_range, 0]
        z = points[point_range, 1]
        y = points[point_range, 2]

        "Generate customized dye board according to the number of categories passed in. Label 0 corresponds to random color 1. Label 1 corresponds to random color 2"
        if self.color_map is not None:
            color_map = self.color_map
        else:
            color_map  = {idx: i for idx, i in enumerate(np.linspace(0, 0.9, num_classes))}
        Label = points_all[point_range, -1] # Get the label
        # Pass the label into the previous dictionary, find the corresponding color and put it in the list

        Color = list(map(lambda x: color_map[x], Label))

        ax.scatter(x,  # x
                   y,  # y
                   z,  # z
                   c=Color,  # Color,  # height data for color
                   s=25,
                   marker=".")
        ax.axis('auto')  # {equal, scaled}
        ax.set_xlabel('X')
        ax.set_ylabel('Y')
        ax.set_zlabel('Z')
        ax.axis('off')  # Sets the axis invisible
        ax.grid(False)  # Sets the background grid invisible
        ax.view_init(elev=0, azim=0)


        if save_path is None:
            plt.savefig(os.path.join(self.label_path_3d_img,f'{idx}_label_img.png'), dpi=300,bbox_inches='tight',transparent=True)
        else:
            plt.savefig(os.path.join(save_path, f'{idx}_{name}_img.png'), dpi=300, bbox_inches='tight',
                        transparent=True)

    def pc_normalize(self,pc):
        l = pc.shape[0]
        centroid = np.mean(pc, axis=0)
        pc = pc - centroid
        m = np.max(np.sqrt(np.sum(pc ** 2, axis=1)))
        pc = pc / m
        return pc

    def make_dir(self, root):
        if os.path.exists(root):
            print(f'{root} Path already exists, no need to create')
        else:
            os.mkdir(root)
    def to_categorical(self,y, num_classes):
        """ 1-hot encodes a tensor """
        new_y = torch.eye(num_classes)[y.cpu().data.numpy(),]
        if (y.is_cuda):
            return new_y.cuda()
        return new_y

    def load_cheackpoint_for_models(self,name,model,cheackpoints):

        assert cheackpoints is not None,'Please fill in the weight file'
        assert model is not None, 'Please instantiate the model'

        for n,m,c in zip(name,model,cheackpoints):
            print(f'Loading{n}Weight of.....')
            weight_dict = torch.load(os.path.join(c,'best_model.pth'))
            m.load_state_dict(weight_dict['model_state_dict'])
            print(f'{n}Weight loading completed')


if __name__ =='__main__':
    import copy


    img_root = r'Your dataset path' # Dataset path
    target_root = r'Path to save forecast results' # Output result path

    num_classes = 13 # Fill in the number of categories of the dataset
    choice_dataset = 'S3dis'
    # Import model section
    "All models in PointNet++Two parameters for standard input and two parameters for output. If the model outputs only one, it can be modified to output one more None!!!!"
    #==============================================
    from models.pointnet2_sem_seg import get_model as pointnet2
    from models.finally_csa_part_seg import get_model as csa
    from models.pointcouldtransformer_part_seg import get_model as pct
    model1 = pointnet2(num_classes=num_classes).eval()
    model2 = csa(num_classes, normal_channel=True).eval()
    model3 = pct(num_class=num_classes,normal_channel=False).eval()
    #============================================
    # Instantiated dataset
    "Dataset Similarly, press ShapeNet Format output three variables point_set, cls, seg # pointset is point cloud data, cls has 16 categories, and seg is a small category corresponding to different points in the data“
    "If it is not in this format, add one manually"

    if choice_dataset == 'ShapeNet':
        print('instantiation  ShapeNet')
        TEST_DATASET = PartNormalDataset(root=img_root, npoints=2048, split='test', normal_channel=True)
        testDataLoader = torch.utils.data.DataLoader(TEST_DATASET, batch_size=1, shuffle=False, num_workers=0,
                                                     drop_last=True)
        color_map = {idx: i for idx, i in enumerate(np.linspace(0, 0.9, num_classes))}
    else:
        TEST_DATASET = S3DISDataset(split='test', data_root=img_root, num_point=4096, test_area=5,
                                    block_size=1.0, sample_rate=1.0, transform=None)
        testDataLoader = torch.utils.data.DataLoader(TEST_DATASET, batch_size=1, shuffle=False, num_workers=0,
                                                     pin_memory=True, drop_last=True)
        color_maps = [(152, 223, 138), (174, 199, 232), (255, 127, 14), (91, 163, 138), (255, 187, 120), (188, 189, 34),
                     (140, 86, 75)
            , (255, 152, 150), (214, 39, 40), (197, 176, 213), (196, 156, 148), (23, 190, 207), (112, 128, 144)]

        color_map = []
        for i in color_maps:
            tem = ()
            for j in i:
                j = j / 255
                tem += (j,)
            color_map.append(tem)
        print('instantiation  S3DIS')


    #Fill in the model and weight path in the dictionary and fill it in the following format
    # If an error is reported in the loading weight, you can view the loading weight part in the class and modify it accordingly
    model_dict = {
        'PonintNet': [model1,r'Weight path 1'],
        'CSA': [model2, r'Weight path 2'],
        'PCT': [model3,r'Weight path 3']
    }


    c = Generate_txt_and_3d_img(img_root,target_root,num_classes,testDataLoader,model_dict,color_map)
Through this script, you can draw the pre results using matplotlib. Due to my limited strength, these codes are based on PointNet + +, so you should attribute PointNet + + code when predicting. Some points for attention are annotated and explained in the code, which is emphasized here again:
1. Therefore, the models have two inputs and two outputs
2. Remember to import the data set. By default, the data set outputs three values with ShapNet as the template. See ShapeNet data set for details. (the data set is not imported, remember to import it yourself if necessary). The preprocessing of training and prediction data sets must be the same, otherwise the prediction effect will be very poor.
3. All models and weights should be placed in the model_dict
4. If you think the saved image has a strange viewing angle, you can set the angle through ax.view_init(elev=0, azim=0)
What else can you think of later.
Start import
Import part at the beginning
"Pass in the model weight file, read the prediction points and generate the predicted weight txt file"

import tqdm
import matplotlib.pyplot as plt
import matplotlib
import torch
import os
import json
import warnings
import numpy as np
from torch.utils.data import Dataset
warnings.filterwarnings('ignore')
matplotlib.use("Agg")
def pc_normalize(pc):
    centroid = np.mean(pc, axis=0)
    pc = pc - centroid
    m = np.max(np.sqrt(np.sum(pc ** 2, axis=1)))
    pc = pc / m
    return pc
It must be added here
warnings.filterwarnings('ignore')
matplotlib.use("Agg")
These two lines of code, otherwise it will cause interruption when drawing. It seems that the drawing program of Matplotlib can't draw too many at one time. If it is too many, it may report an error (probably more than 1w)
The above code is my own code. I have no problem using it. If you have any problems, you can read the code for corresponding adjustment or leave a message in the comment area. I hope it can help you.
reference resources:
https://blog.csdn.net/ssq183/article/details/104603454/
Finally, we must remember:
