2. intermediate articles
2.1. Drawing Shapes
Drawing graphics is not only the use of lines to achieve drawing, but also a fast way to draw graphics.
1. Drawing Rectangles
2. Drawing an arc
2.1.1. Draw Rectangles
Method of drawing rectangle:
1.CanvasRenderingContext2D.strokeRect
2.CanvasRenderingContext2D.fillRect
3.CanvasRenderingContext2D.rect
Note: The rect method is a rectangular path, and fills or strokes are needed to see the effect. Therefore, strokeRect or fillRect are usually used to see the result directly.
Clear the rectangular area: Canvas RenderingContext2D. clearRect
2.1.1.1. Draw rectangular boxes
Syntax: Canvas RenderingContext2D. strokeRect (x, y, width. height)
Description:
1. Drawing a rectangle is much simpler than using moveTo and lineTo directly.
2. The first two parameters of the method represent the coordinates of the upper left corner of the drawing rectangle. The last two parameters represent the width and height of the rectangle.
3. Using this method, we do not need to use moveTo method to set the starting point, nor do we need to call stroke and other painting methods.
4. Drawn rectangle supports strokeStyle to set color style.
Case study:
ctx.strokeStyle = 'red';
ctx.strokeRect( 100, 100, 200, 100 );
Effect: 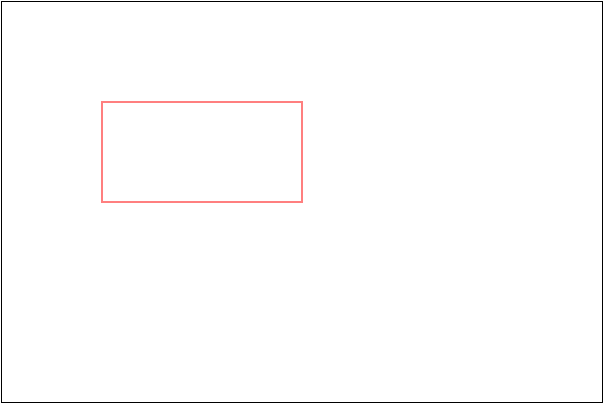
2.1.1.2. Drawing Filled Rectangles
Syntax: Canvas RenderingContext2D. fillRect (x, y, width. height)
Description:
1. Drawing a rectangle is much simpler than using moveTo and lineTo directly.
2. The first two parameters of the method represent the coordinates of the upper left corner of the drawing rectangle. The last two parameters represent the width and height of the rectangle.
3. Using this method, we do not need to use moveTo method to set the starting point, nor do we need to call stroke and other painting methods.
4. The drawn rectangle supports fillStyle to set the color style.
Case study:
ctx.fillStyle = 'green';
ctx.fillRect( 100, 100, 200, 100 );
Effect: 
2.1.1.3. Clear rectangular areas
Syntax: Canvas RenderingContext2D. clearRect (x, y, width, height)
Description:
1. Used to clear the rectangular area of the canvas.
2. The parameters X and Y denote the coordinates of the upper left corner of the rectangular region, and width and height denote the width and height of the rectangular region.
Case study:
ctx.fillRect( 100, 100, 200, 100 );
ctx.clearRect( 110, 110, 50, 50 );
Effect: 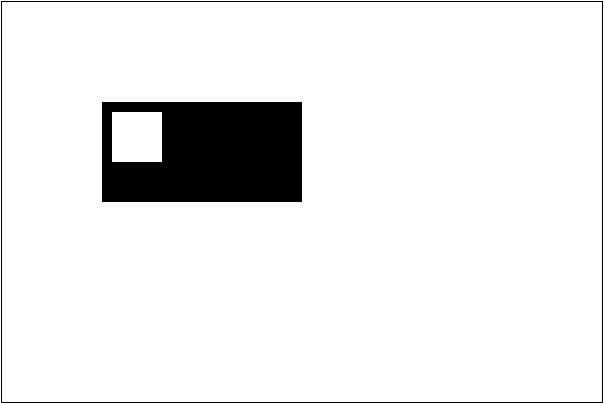
2.1.1.4. Cases
Simple animation can be achieved by drawing graphics and clearing rectangular areas. For example, code:
 var x = 10, y = 10, oldx = 10, oldy = 10;
    var width = 100, height = 50;
    var intervalId = setInterval(function () {
        ctx.clearRect( oldx - 1, oldy - 1, width + 2, height + 2 );

        ctx.strokeRect( x, y, width, height );

        oldx = x;
        oldy = y;

        x += 4;
        y += 2;

        if ( oldy >= 200 ) {
            // clearInterval( intervalId );
            x = 10, y = 10;
        }
    }, 20);
Effect: 
Sometimes the entire canvas is cleared for simplicity, so that the problem of clearance does not need to be calculated every time.
ctx.clearRect( 0, 0, cas.width, cas.height );
    // You can also set the width of the canvas so that it will be cleared automatically.
    cas.width = cas.width;
2.1.2. Drawing an arc
The methods of drawing circular arcs are as follows.
CanvasRenderingContext2D.arc()
CanvasRenderingContext2D.arcTo()
2.1.2.1. Drawing an arc
Syntax: Canvas RenderingContext2D.arc (x, y, radius. startAngle. endAngle, anticlockwise)
Description:
1. This method is used to draw a section of arc. The sector shape can be drawn by combining the position of the starting point with the stroke method or fill ing method.
2. The first two parameters X and Y in the method represent the coordinates of the center of the circle drawing the arc.
3. The radius parameter represents the radius of an arc in radians.
4. The parameters startAngle and endAngle represent the angle from beginning to end. The angle is 0 radian from horizontal to right and clockwise to positive.
5. The parameter anticlockwise indicates whether the default positive angle is used or not, and if true is passed in, the inverse pointer is positive. This parameter is optional.
Case study:
 // stay 200, 200 Draw a radius of 100 Arc, The center angle is - PI / 2 reach PI / 4
    ...
    ctx.arc( 200, 200, 100, -Math.PI/2, Math.PI/4 );
    ctx.stroke();

    // Draw coordinate axes to make it easier to see the structure clearly.
    ctx.beginPath();
    ctx.strokeStyle = 'red';
    ctx.moveTo( 50, 200 );
    ctx.lineTo( 350, 200 );

    ctx.moveTo( 200, 50 );
    ctx.lineTo( 200, 350 );

    ctx.moveTo( 200, 200 );
    ctx.lineTo( 300, 300 );

    ctx.stroke();
Effect: 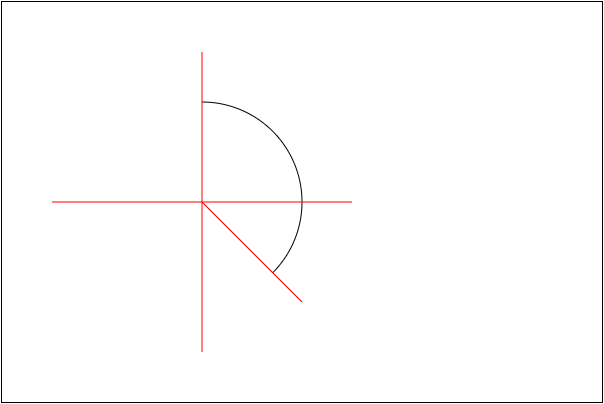
2.1.2.1.1. Notes
1. When using arc drawing, if moveTo is not set, the starting point will be the place where the arc is drawn. If moveTo is set, the starting point of the arc will be connected.
2. If stroke method is used, then the starting position of the line to the arc will be from the beginning. If fill method is used, the path filling will be closed automatically.
For example: 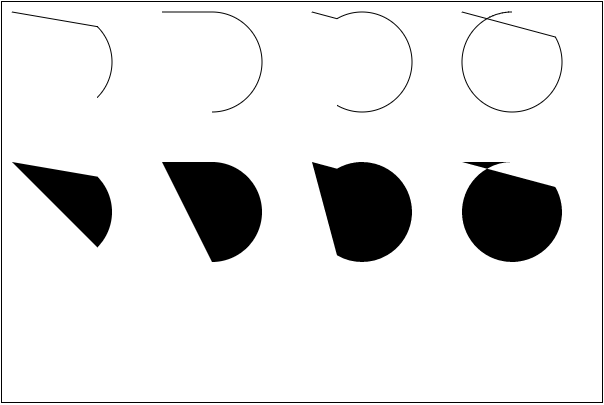
2.1.2.2. Drawing sector
The key point of drawing a sector is to set the starting position as the center of the circle and then close the path.
 ...
    ctx.strokeStyle = 'red';
    ctx.fillStyle = 'pink';

    ctx.moveTo( 100, 200 );
    ctx.arc( 100, 200, 100, -Math.PI/3, Math.PI/3 );
    ctx.closePath();
    ctx.stroke();

    ctx.beginPath();
    ctx.moveTo( 300, 200 );
    ctx.arc( 300, 200, 100, -Math.PI/3, Math.PI/3 );
    ctx.closePath();
    ctx.fill();
Effect: 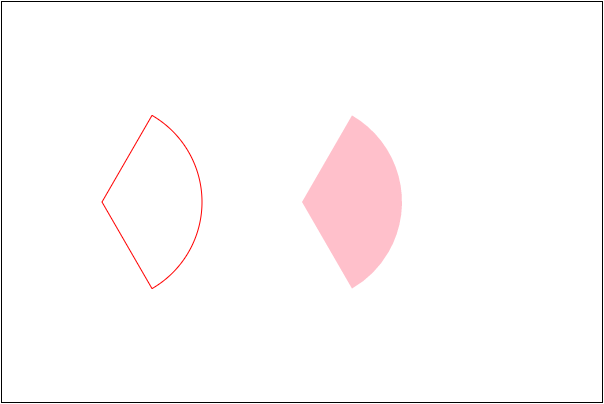
2.1.2.3. Drawing sector animation
Drawing sector animation is to erase the previous drawing content every few milliseconds (20 milliseconds) and then draw a little more than before on the basis of the previous drawing. The content of drawing here is determined by the angle. For example, the angle is drawn from - Math.PI / 2 at the beginning. Then every angle is + 0.1 until drawing to Math. PI * 3/2.
...
    ctx.fillStyle = 'green';
    var startAngle = -Math.PI / 2,
        angle = startAngle,
        x = 200, y = 200,
        r = 100;
    var intervalId = setInterval(function () {
        // Clear up what was drawn before
        ctx.clearRect( 0, 0, cas.width, cas.height );
        // Angle increment
        angle += 0.1;
        // Determine whether to stop the timer
        if ( angle >= Math.PI * 3 / 2 ) {
            clearInterval( intervalId);
            angle = Math.PI * 3 / 2;
            console.log( 'Rendering completed' );
        }
        // Draw
        ctx.moveTo( x, y );
        ctx.arc( x, y, r, startAngle, angle );
        ctx.fill();
    }, 20);
2.1.2.4. Drawing pie chart
The greatest feature of pie chart drawing is that the angles are superimposed. Start drawing from - Math.PI/2. After reaching the execution angle x, the next area starts drawing from x, and then stops at a corner y. Repeat until the end of Math. PI* 3/2.
2.1.2.4.1. Trisection pie graph
Draw a pie chart with three equal parts. The color is red, green and blue.
 var x = 200, y = 200,
        r = 100,
        step = Math.PI * 2 / 3,     // 120 degrees an area
        start = -Math.PI / 2,       // Starting angle
        colors = [ 'red', 'green', 'blue' ];

    for ( var i = 0; i < 3; i++ ) {
        ctx.beginPath();
        ctx.moveTo( x, y );
        ctx.fillStyle = colors[ i ];
        ctx.arc( x, y, r, start, start+=step );
        ctx.fill();
    }
Effect: 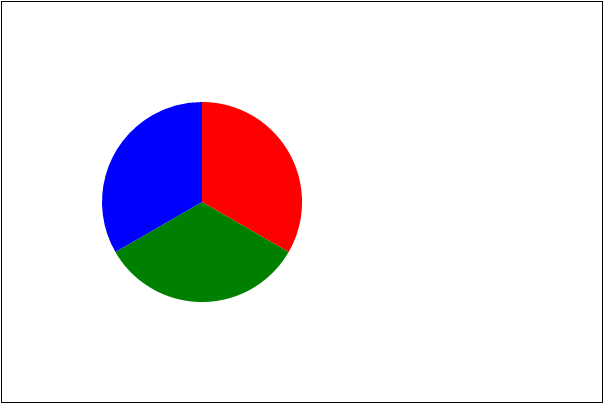
2.1.2.4.2. Perspective of Data Definition
From the point of view of data source definition, it is to sum all the data and calculate the radian value of each data part according to the conclusion that the sum is 2 * Math.PI. At the same time, the color can be defined in advance.
Colour Separated from Konva Library
var colors =
        ( "aliceblue,antiquewhite,aqua,aquamarine,azure,beige,bisque,black,blanchedalmond,blue," +
        "blueviolet,brown,burlywood,cadetblue,chartreuse,chocolate,coral,cornflowerblue,cornsilk," +
        "crimson,cyan,darkblue,darkcyan,darkgoldenrod,darkgray,darkgreen,darkgrey,darkkhaki,darkmagenta," +
        "darkolivegreen,darkorange,darkorchid,darkred,darksalmon,darkseagreen,darkslateblue,darkslategray," +
        "darkslategrey,darkturquoise,darkviolet,deeppink,deepskyblue,dimgray,dimgrey,dodgerblue,firebrick," +
        "floralwhite,forestgreen,fuchsia,gainsboro,ghostwhite,gold,goldenrod,gray,green,greenyellow,grey," +
        "honeydew,hotpink,indianred,indigo,ivory,khaki,lavender,lavenderblush,lawngreen,lemonchiffon," +
        "lightblue,lightcoral,lightcyan,lightgoldenrodyellow,lightgray,lightgreen,lightgrey,lightpink," +
        "lightsalmon,lightseagreen,lightskyblue,lightslategray,lightslategrey,lightsteelblue,lightyellow," +
        "lime,limegreen,linen,magenta,maroon,mediumaquamarine,mediumblue,mediumorchid,mediumpurple," +
        "mediumseagreen,mediumslateblue,mediumspringgreen,mediumturquoise,mediumvioletred,midnightblue," +
        "mintcream,mistyrose,moccasin,navajowhite,navy,oldlace,olive,olivedrab,orange,orangered,orchid," +
        "palegoldenrod,palegreen,paleturquoise,palevioletred,papayawhip,peachpuff,peru,pink,plum,powderblue," +
        "purple,rebeccapurple,red,rosybrown,royalblue,saddlebrown,salmon,sandybrown,seagreen,seashell,sienna," +
        "silver,skyblue,slateblue,slategray,slategrey,snow,springgreen,steelblue,tan,teal,thistle,transparent," +
        "tomato,turquoise,violet,wheat,white,whitesmoke,yellow,yellowgreen" ).split( ',' );
If you get the data
var data = [ 123, 156, 47, 100, 80 ];
When calculating the proportion of each part, we can construct an array of objects that store component values and radians.
var sum = 0;
    for ( var i = 0; i < data.length; i++ ) {
        sum += data[ i ];
    }
    // When you get the total, you have the component ratio.
    var odata = data.map(function ( v, i ) {
        return { value: v, radius: v * 2 * Math.PI / sum };
    });
Finally, start drawing based on the data.
// Start drawing
    var start = -Math.PI / 2,
        x = 200, y = 200,
        r = 100;

    for ( var i = 0; i < odata.length; i++ ) {
        ctx.beginPath();
        ctx.fillStyle = colors[ i + 10 ];
        ctx.moveTo( x, y );
        ctx.arc( x, y, r, start, start+=odata[ i ][ 'radius' ] );
        ctx.fill();
    }
Effect: 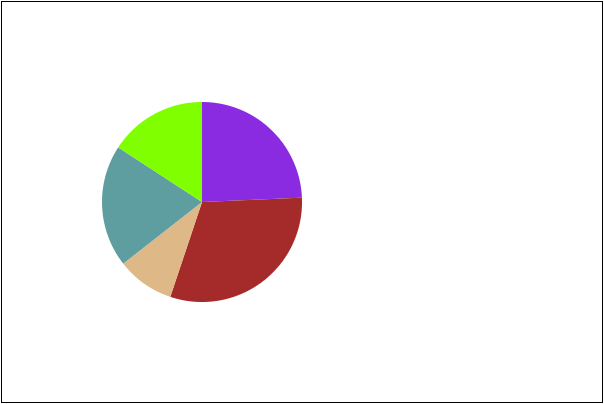
2.1.2.5. Drawing tangent arcs
Syntax: Canvas RenderingContext2D. arcTo (x1, y1, x2, y2, radius)
Description:
1. The method is used to draw circular arcs.
2. The drawing rule is that the current position is connected to the first reference point and the drawn arc is tangent to the line.
3. Connect two reference points at the same time, and the arc is tangent to the line according to its radius.
For example, if there is a starting point (100, 100), draw the point. Set the color to red.
ctx.fillStyle = 'red';
    ctx.fillRect( 100 - 4, 100 - 4, 8, 8 );
Then two reference points (100, 300) and (300, 300) are plotted.
ctx.fillRect( 100 - 4, 300 - 4, 8, 8 );
ctx.fillRect( 300 - 4, 300 - 4, 8, 8 );
Connect two reference points
ctx.beginPath();
ctx.strokeStyle = 'red';
ctx.moveTo( 100, 300 );
ctx.lineTo( 300, 300 );
ctx.stroke();
The results are as follows: 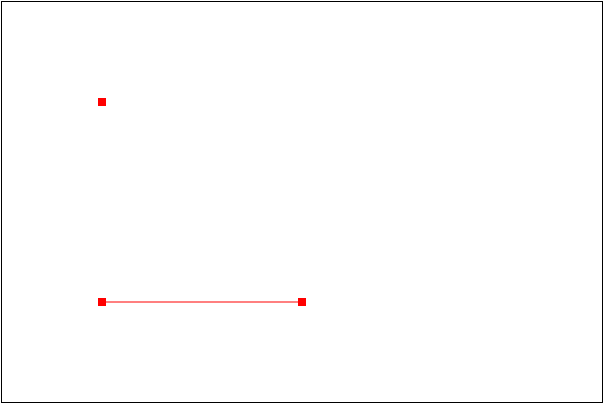
Call the arcTo method to draw an arc. Remember to set the starting point to (100, 100)
ctx.beginPath();
ctx.strokeStyle = 'blue';
ctx.moveTo( 100, 100 );

ctx.arcTo( 100, 300, 300, 300, 100 );
ctx.stroke();
The results are as follows: 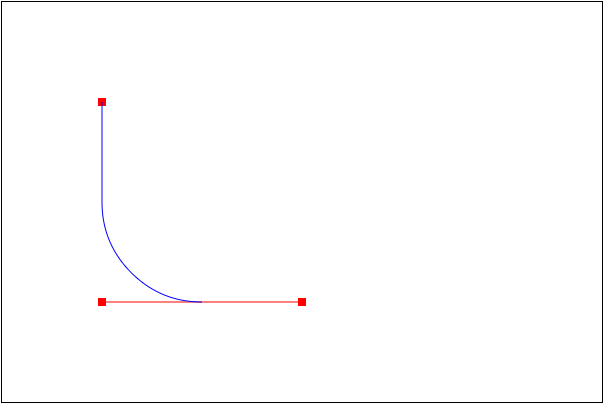
Note: Using this method, two straight lines can be connected by arcs without calculating the complicated starting and ending angles. Therefore, there are many cases for drawing rounded rectangles.
2.1.2.6. Drawing rounded rectangle
Encapsulate a function for drawing rounded rectangles.
1. Referring to rect method, coordinate parameters x, y are needed.
2. Because of the rounded corners, it is necessary to set the cornerRadius of the rounded corners.
3. Length is also needed.
First, we draw a rectangular border. But we need to consider the rounded corners. Although we start drawing from X and y, we need to leave the distance of radius in the middle.
var x = 100, y = 100, width = 300, height = 100,
cornerRadius = 10;
ctx.strokeStyle = 'red';

ctx.moveTo( x + cornerRadius, y );
ctx.lineTo( x + width - cornerRadius, y );

ctx.moveTo( x + width, y + cornerRadius );
ctx.lineTo( x + width, y + height - cornerRadius );

ctx.moveTo( x + width - cornerRadius, y + height );
ctx.lineTo( x + cornerRadius, y + height );

ctx.moveTo( x, y + height - cornerRadius );
ctx.lineTo( x, y + cornerRadius );

ctx.stroke();
The effect is: 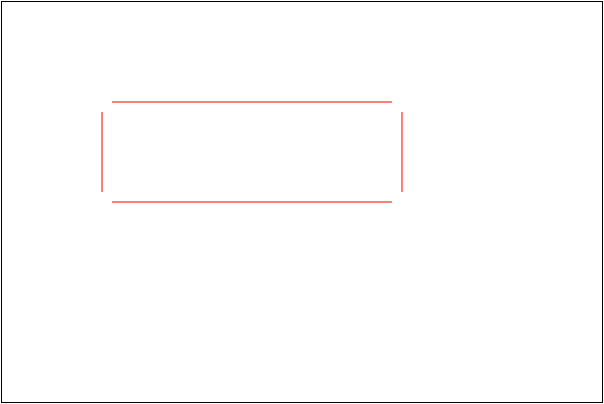
Then draw four corners separately to set the current position and the reference point. Set the current position as a line endpoint, then the reference point is the rectangular vertex and the endpoint of another line segment in turn.
ctx.moveTo( x + cornerRadius, y );
ctx.arcTo( x, y, x, y + cornerRadius, cornerRadius );
You can get: 
Similarly, draw three other rounded corners
ctx.moveTo( x + width - cornerRadius, y );
ctx.arcTo( x + width, y, x + width, y + cornerRadius, cornerRadius );

ctx.moveTo( x + width, y + height - cornerRadius );
ctx.arcTo( x + width, y + height, x + width - cornerRadius, y + height, cornerRadius );

ctx.moveTo( x + cornerRadius, y + height );
ctx.arcTo( x, y + height, x, y + height - cornerRadius, cornerRadius );
You can get: 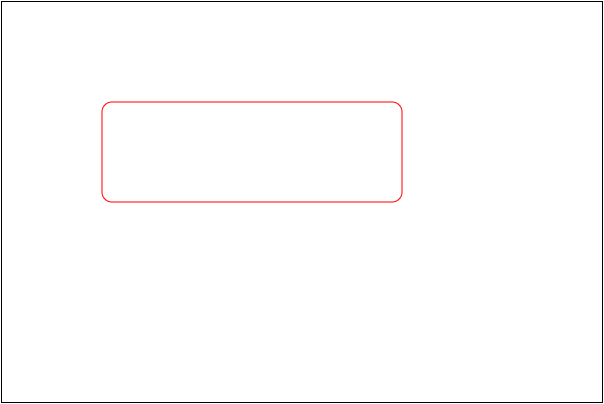
More rounded rectangles can be drawn by encapsulating them into methods. Pay attention to beginPath() and save() and restore() in encapsulation.
function cRect ( x, y, width, height, cornerRadius, color ) {
ctx.save();
ctx.beginPath();
ctx.strokeStyle = color || 'red';
ctx.moveTo( x + cornerRadius, y );
ctx.lineTo( x + width - cornerRadius, y );
ctx.moveTo( x + width, y + cornerRadius );
ctx.lineTo( x + width, y + height - cornerRadius );
ctx.moveTo( x + width - cornerRadius, y + height );
ctx.lineTo( x + cornerRadius, y + height );
ctx.moveTo( x, y + height - cornerRadius );
ctx.lineTo( x, y + cornerRadius );
// Start drawing four rounded corners
ctx.moveTo( x + cornerRadius, y );
ctx.arcTo( x, y, x, y + cornerRadius, cornerRadius );
ctx.moveTo( x + width - cornerRadius, y );
ctx.arcTo( x + width, y, x + width, y + cornerRadius, cornerRadius );
ctx.moveTo( x + width, y + height - cornerRadius );
ctx.arcTo( x + width, y + height, x + width - cornerRadius, y + height, cornerRadius );
ctx.moveTo( x + cornerRadius, y + height );
ctx.arcTo( x, y + height, x, y + height - cornerRadius, cornerRadius );
ctx.stroke();
ctx.restore();
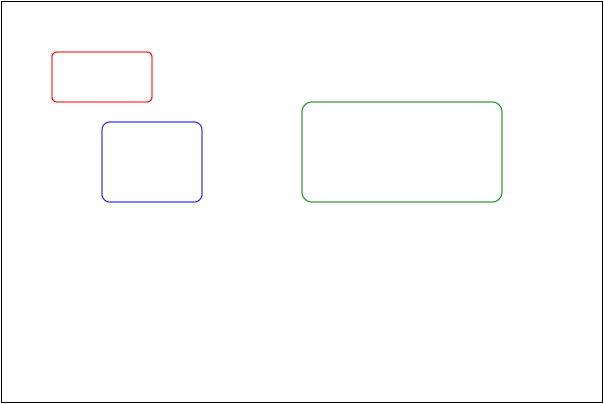
}Call code:
cRect( 50, 50, 100, 50, 5 );
cRect( 100, 120, 100, 80, 8, 'blue' );
cRect( 300, 100, 200, 100, 10, 'green' );
The results are as follows: