1, Overview
Log analysis is the main means for operation and maintenance engineers to solve system faults and find problems. Logs mainly include system logs, application logs and security logs. System operation and maintenance personnel and developers can understand the software and hardware information of the server through the log, check the errors in the configuration process and the causes of the errors. Regular analysis of logs can understand the load, performance and security of the server, so as to take timely measures to correct errors.
ELK is a combination of three open source software: Elasticsearch (log storage and search), Logstash (log collection) and Kibana (log viewing). ELK is a complete set of enterprise level solutions for log collection, analysis and display developed by elastic company. Among the three software, each software is used to complete different functions. ELK is also called ELKstack.
ELK component can be used to solve the following main problems in the operation and maintenance of massive log system: - unified collection of distributed log data to realize centralized query and management
- Troubleshooting
- Security information and event management
- Report function
ELK working principle diagram:
[APPServer cluster] - [logstash Agent collector] - [ElasticSearch cluster] - [Kibana Server] - [Browser]
Logstash collects the logs generated by the AppServer and stores them in the ElasticSearch cluster, while Kibana queries the data from the Es cluster, generates charts, and then returns them to the Browser. In short, the following steps are generally required for Log processing and analysis:
1. Centralized log management (beats)
2. Format the log (logstash)
3. Index and store formatted data (elastic search)
4. Display of front-end data (kibana)
What logs do you want to collect
1) System log - prepare for monitoring
2) Service log
1. Database - mysql - slow query log, error log, general log
2. tomcat, because log4j is developed in java
3) Business log - log4j
How to display (visualize) the logs after they are collected
- kibana
- grafana
How to use the log after it is collected and displayed
1) Give big data analysis as a data source for three-dimensional display
2) For R & D (troubleshooting, bug solving, etc.)
3) Statistical data flow, as the data source of analysis report
2, Advantages
- Flexible processing: elasticsearch is a real-time full-text index with powerful search function (supporting full-text search with any key)
- The configuration is relatively simple: the API of elasticsearch uses JSON interface, logstash uses module configuration, and kibana's configuration file is simpler.
- Efficient retrieval performance: Based on excellent design, although each query is real-time, it can also achieve the query second response of 10 billion data.
- Cluster linear expansion: both elasticsearch and logstash can be linearly expanded flexibly, and the capacity can be expanded if there is a bottleneck in node reading and writing (35711 servers)
- Gorgeous front-end operation: kibana's front-end design is gorgeous and easy to operate (relatively simple in the early days)
3, Elasticsearch
A highly scalable open source full-text search and analysis engine, which can realize real-time full-text search of data, support distributed, achieve high availability, provide API interface, and handle large-scale log data, such as Nginx, Tomcat, system log and other functions.
Elasticsearch, developed in Java language, is a search engine based on Apache Lucene, a full-text search engine,
Elasticsearch features:
- Real time search and analysis
- Distributed architecture, real-time file storage
- Document oriented, all objects are documents
- High availability, easy to expand, support clustering, fragmentation and replication
- Friendly interface and support json
4, Logstash
Logstash is a data collection engine with real-time transmission capability. It can collect and forward logs through plug-ins, support log filtering, support log parsing in common log and custom json format, and finally send the processed logs to elasticsearch.
5, kibana
Kibana provides elasticsearch with a web interface for viewing data. It mainly searches data through the API interface of elasticsearch and visualizes the front-end data. In addition, it can generate corresponding tables, histograms, pie charts, etc. for data in specific formats.
6, Build
1. Environment construction
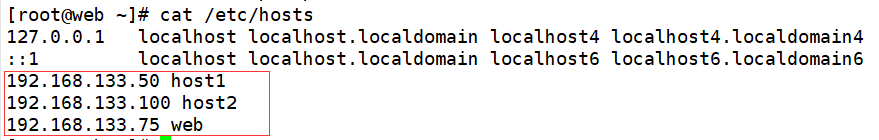
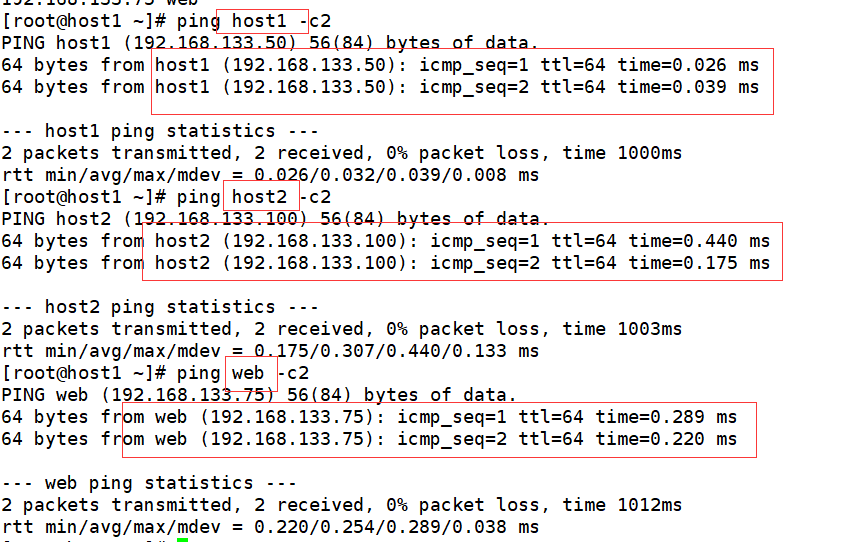
192.168.133.50 host1
192.168.133.100 host2
192.168.133.75 web
systemctl stop firewalld
setenforce 0
hostname host1                                                  host1 Upper execution
su
hostname host2                                                  host2 Upper execution
su
hostname web                                                    web Upper execution
su
echo "192.168.133.50 host1
192.168.133.100 host2
192.168.133.75 web">> /etc/hosts
2. Setup time synchronization:
2.1. Master server settings
[root@host1 ~]# yum install ntp -y
[root@host1 ~]# vim /etc/ntp.conf
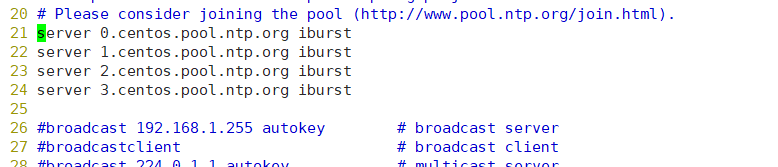
Change to
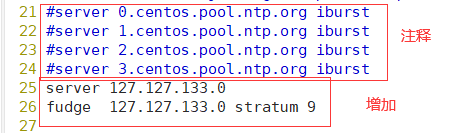
[root@host1 ~]# service ntpd start
Redirecting to /bin/systemctl start ntpd.service
2.2 slave server settings
[root@host2 ~]# yum install ntpdate -y
[root@host2 ~]# service ntpd start
Redirecting to /bin/systemctl start ntpd.service
[root@host2 ~]# /usr/sbin/ntpdate 192.168.133.75
16 Dec 11:40:08 ntpdate[42044]: the NTP socket is in use, exiting
[root@localhost mysql]# crontab -e
no crontab for root - using an empty one
crontab: installing new crontab

[root@host2 ~]# crontab -l
*/10 * * * * /usr/sbin/ntpdata 192.168.133.75
3. Installation
Operation on host1 and host2. Only the operation on host1 is displayed
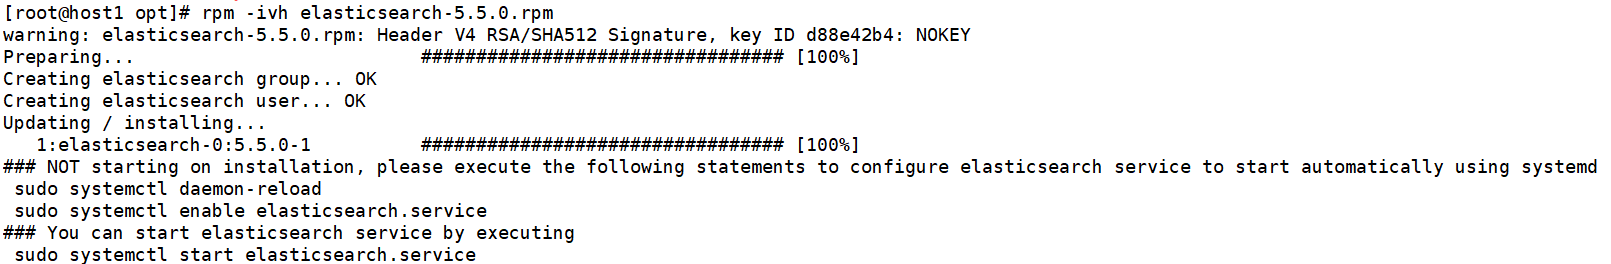
3.1. Installation package elasticsearch-5.5 0.rpm
[root@host1 ~]# cd /opt

rpm -ivh elasticsearch-5.5.0.rpm
[root@host1 opt]# cd /etc/elasticsearch/
[root@host1 elasticsearch]# cp elasticsearch.yml{,.bak}
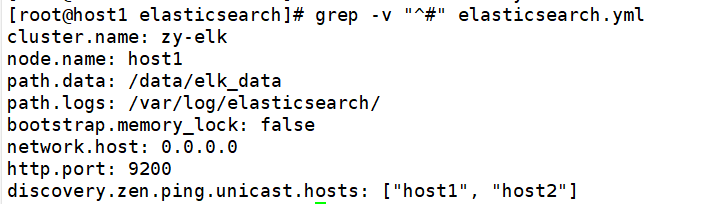
[root@host1 elasticsearch]# vim elasticsearch.yml
 17 #cluster. Name: my application enable and modify the cluster name
 change
 17 cluster.name: zy-elk
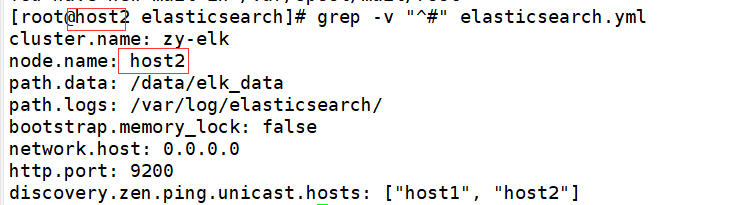
23 #node. Name: start node-1 and change it to the host name. The two machines are changed respectively
 change
23 node.name:host1                                               host1 Up change
23 node.name:host2                                               host2 Up change
33 #path.data: /path/to/data open setting data directory needs to be created and given permission
 change
33 path.data: /data/elk_data
37 #path.logs: /path/to/logs enable and modify the log file path
 change
37 path.logs: /var/log/elasticsearch/
43 #bootstrap.memory_lock: true memory lock cancellation
 change
43 bootstrap.memory_lock: false
55 #network.host: 192.168.0.1 enable and change the listening port
 change
55 network.host: 0.0.0.0
59 #http.port: 9200 open port
 change
59 http.port: 9200
68 #discovery.zen.ping.unicast.hosts: ["host1", "host2"] auto cluster discovery, adding host name
 change
68 discovery.zen.ping.unicast.hosts: ["host1", "host2"]
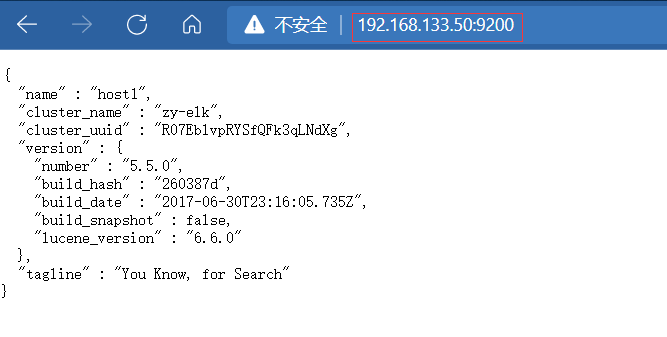
[root@host1 elasticsearch]# mkdir -p /data/elk_data
[root@host1 elasticsearch]# chown -R elasticsearch.elasticsearch /data/elk_data/
[root@host1 elasticsearch]# systemctl enable --now elasticsearch.service
Created symlink from /etc/systemd/system/multi-user.target.wants/elasticsearch.service to /usr/lib/systemd/system/elasticsearch.service.
[root@host1 elasticsearch]# netstat -ntap|grep 9200
tcp6       0      0 :::9200                 :::*                    LISTEN      39393/java
At this time, it can be opened on the client http://192.168.133.50:9200
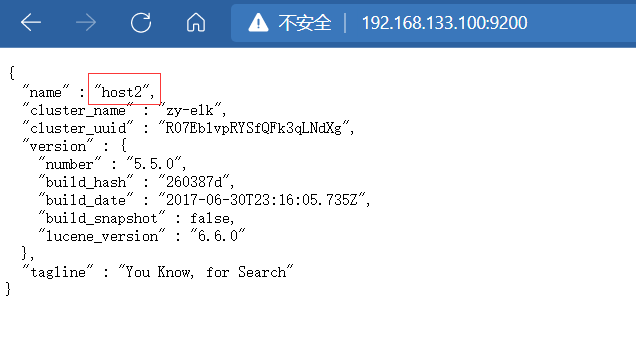
Open on client http://192.168.133.100:9200
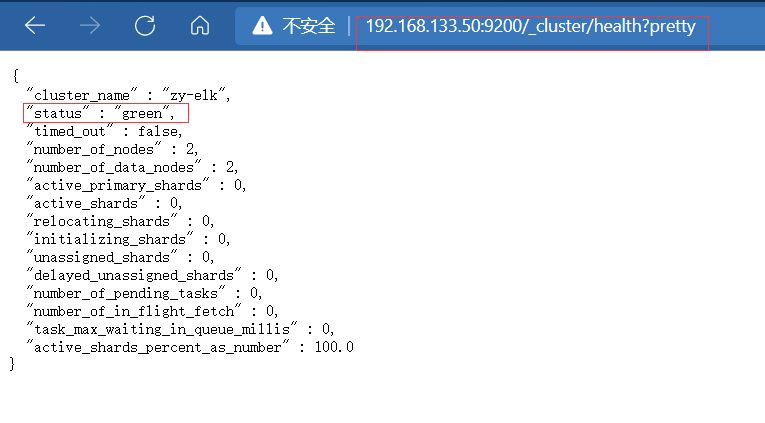
http://192.168.133.50:9200/_cluster/health?pretty
The status can be displayed here as normal
http://192.168.133.50:9200/_cluster/state?pretty
3.2. Install elasticsearch head plug-in
After Elasticsearch version 5.0, Elasticsearch head plug-in needs to be installed as an independent service and npm Installation of tools (Wodeas package management tool). T o install Elasticsearch head, you need to install the dependent software node and phantomjs in advance.
node: it is a JavaScript running environment based on Chrome v8 engine.
phantomjs: it is a JavaScript API based on websit, which can be understood as an invisible browser. It can do anything based on webkit browser.
1. Install node
[root@host1 elasticsearch]# yum install gcc gcc-c++ make -y
[root@host1 opt]# ls

[root@host1 opt]# tar xf node-v8.2.1.tar.gz
[root@host1 opt]# cd node-v8.2.1/
[root@host1 node-v8.2.1]# ./configure
[root@host1 node-v8.2.1]# make && make install
2. Install phantomjs

[root@host1 opt]# tar xf phantomjs-2.1. 1-linux-x86_ 64.tar. Bz2 - C / usr / local / SRC / extract to the specified directory
[root@host1 opt]# cd /usr/local/src/phantomjs-2.1.1-linux-x86_64 / enter directory
[root@host1 phantomjs-2.1.1-linux-x86_64]# ln -s /usr/local/src/phantomjs-2.1.1-linux-x86_64/bin/* /usr/local/bin/
3. Install elasticsearch head

[root@host1 opt]# tar zxvf elasticsearch-head.tar.gz  -C /usr/local/src/
[root@host1 opt]# cd /usr/local/src/elasticsearch-head/
[root@host1 ~]# vi /etc/elasticsearch/elasticsearch. Add 2 lines at the end of YML
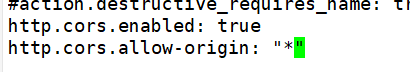
http.cors.enabled: true
#Enable cross domain access support. The default value is false
http.cors.allow-origin: "*"
#Specify that the domain names and addresses allowed for cross domain access are all
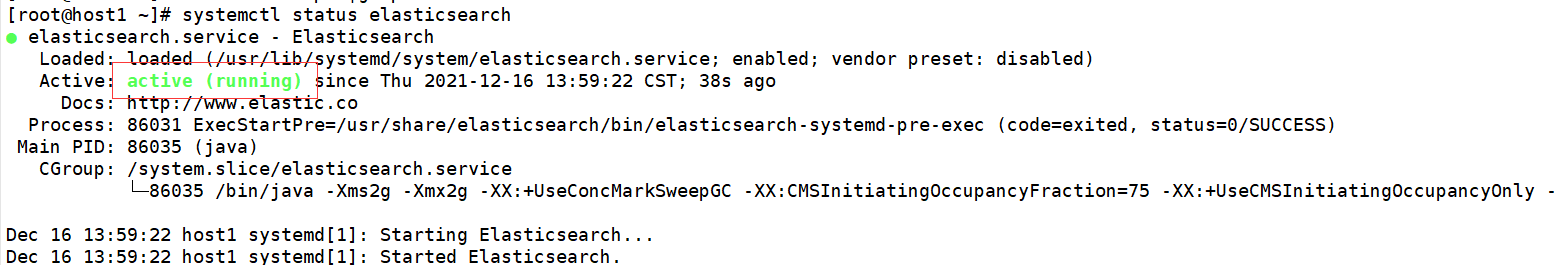
[root@host1 elasticsearch-head]# systemctl restart elasticsearch
[root@host1 ~]# systemctl status elasticsearch
4. Start the server
[root@host1 elasticsearch-head]# cd /usr/local/src/elasticsearch-head/
[root@host1 elasticsearch-head]# npm run start &
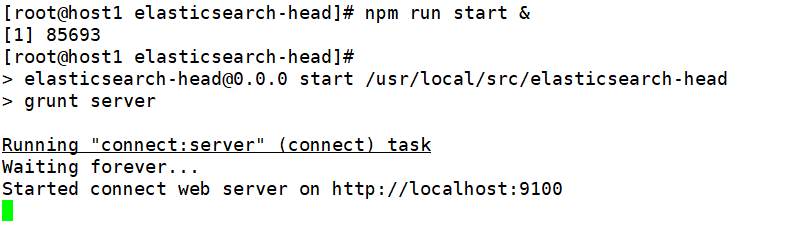

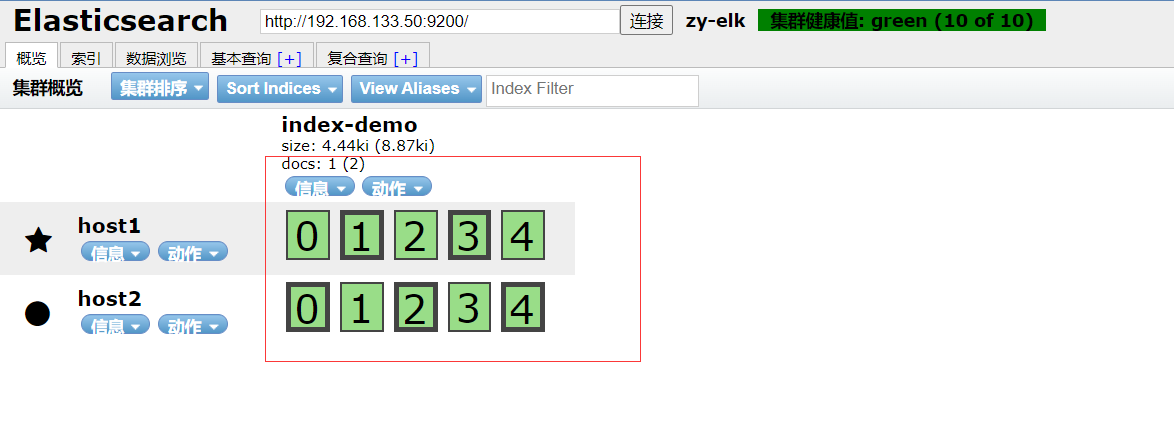
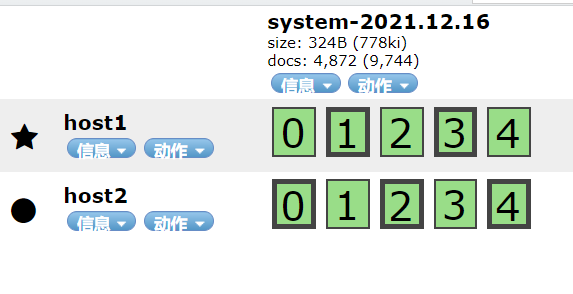
At this time, you can open 192.168 133.50:9100
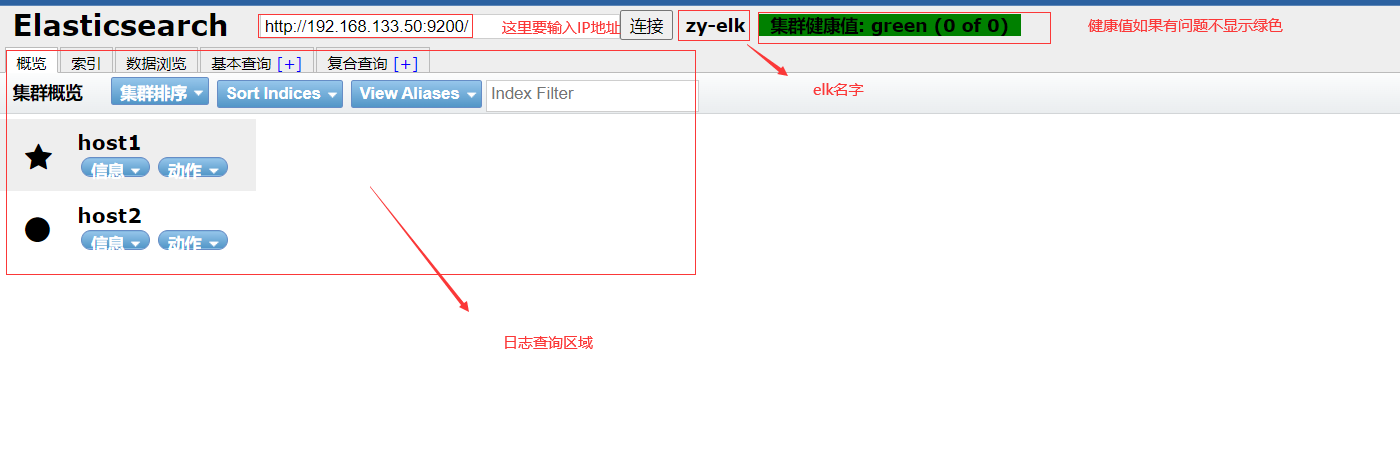
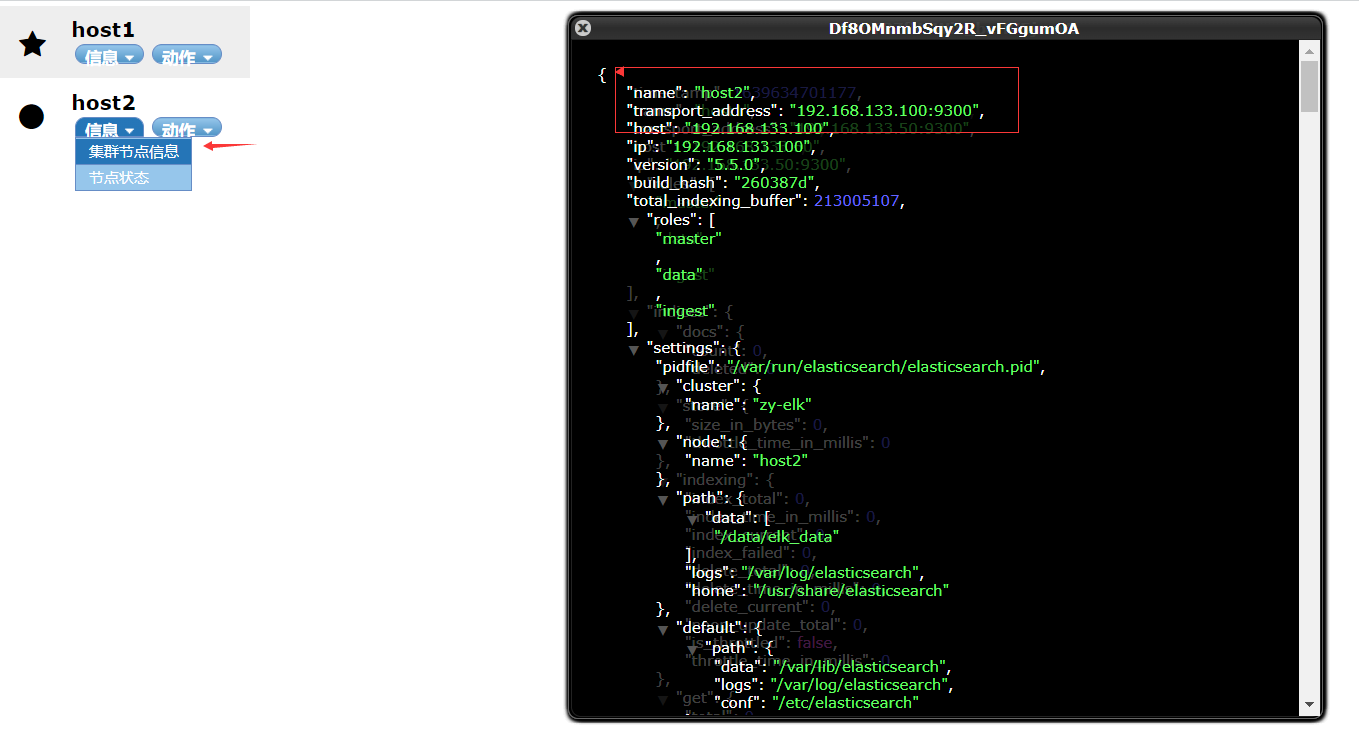
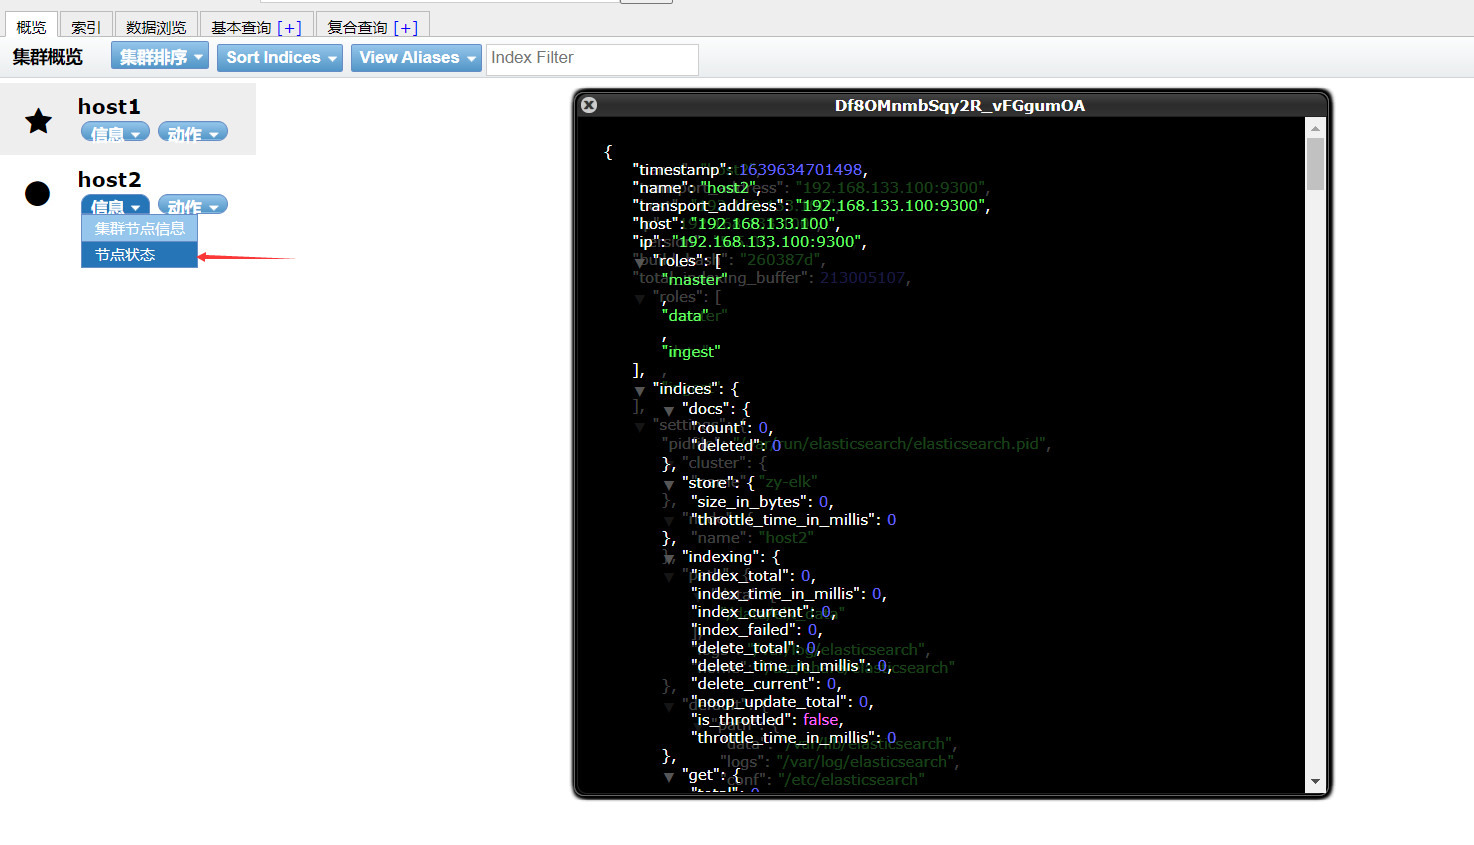

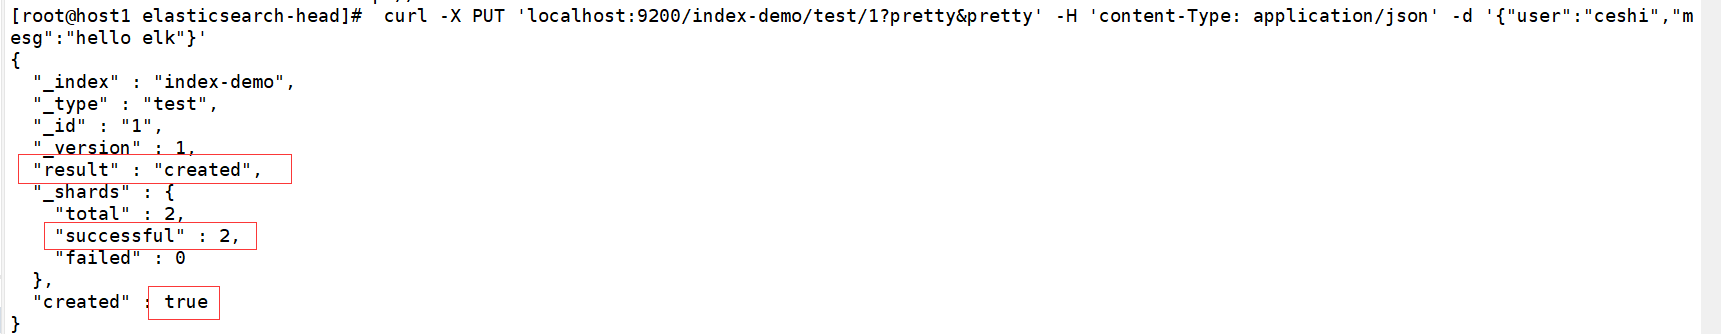
Create an index on host1. The index is index demo and the type is test. You can see the successful creation
[root@host1 elasticsearch-head]# curl -X PUT 'localhost:9200/index-demo/test/1?pretty&pretty' -H 'content-Type: application/json' -d '{"user":"ceshi","mesg":"hello elk"}'
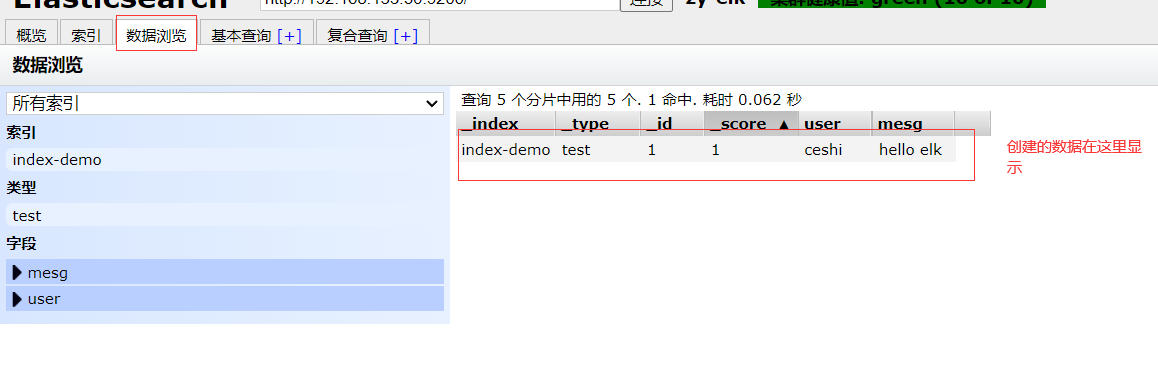
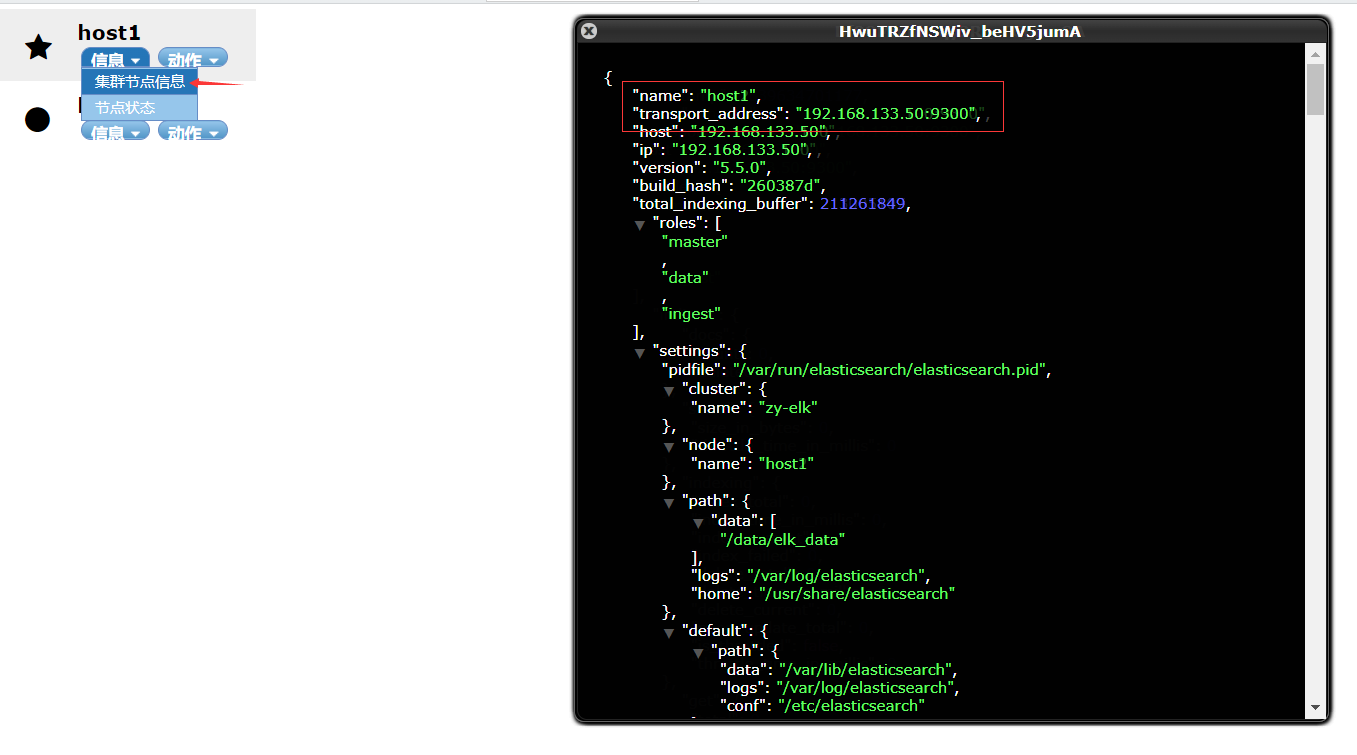
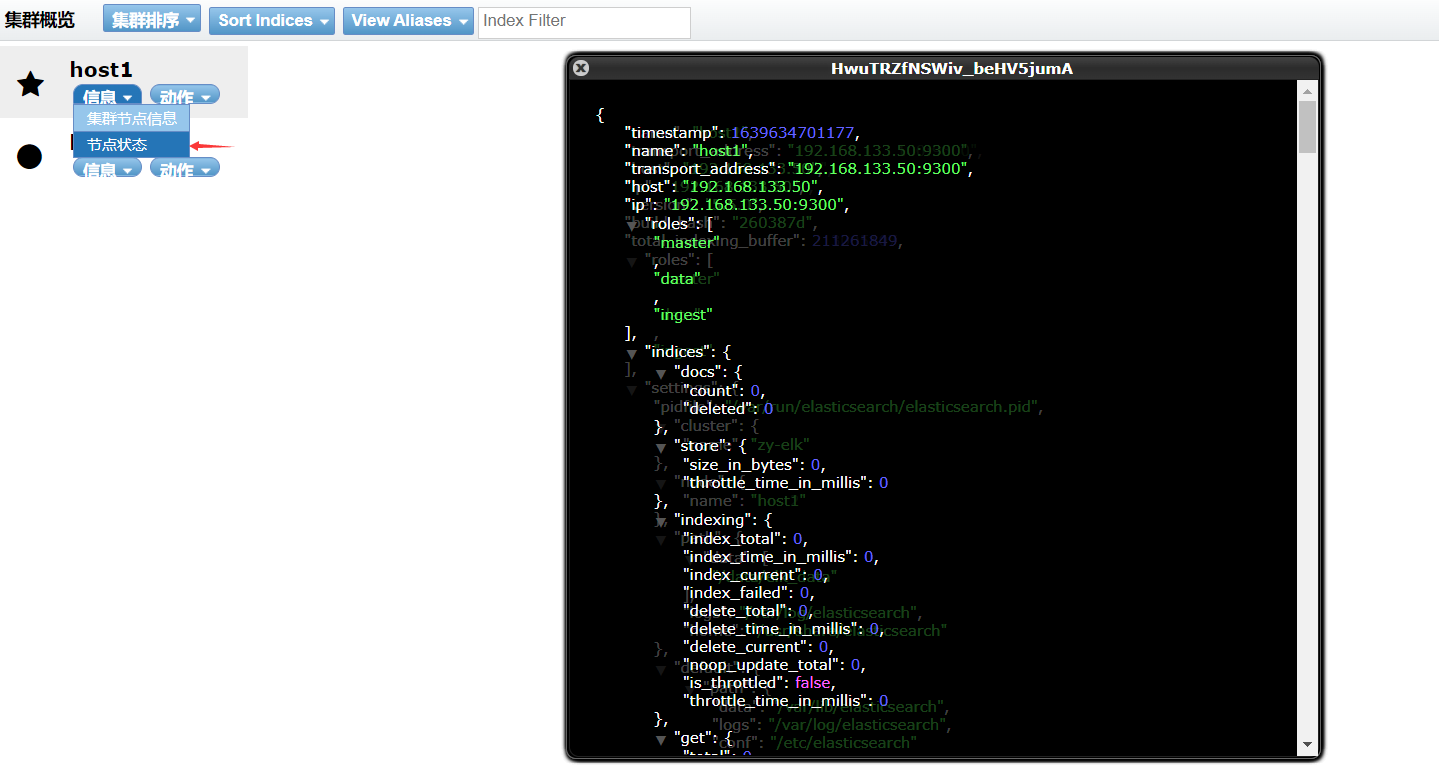
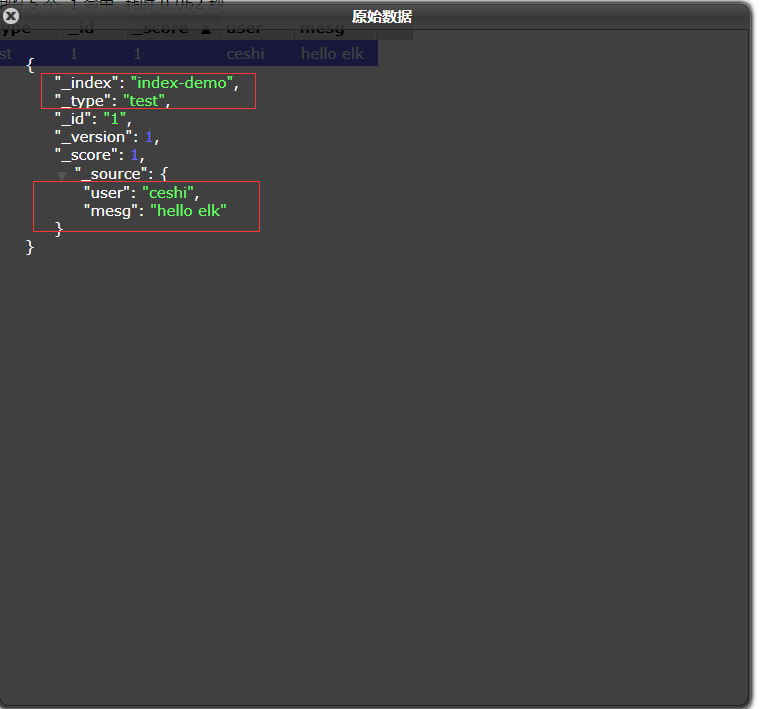
Click to see the details
4. ELK Logstash deployment (operating on a web node)
[root@web ~]# yum install httpd -y
[root@web ~]# systemctl start httpd
[root@web ~]# cd /opt

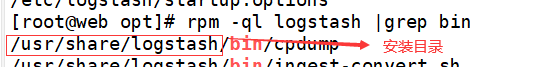
[root@web opt]# rpm -ivh logstash-5.5.1.rpm
[root@web opt]# ln -s /usr/share/logstash/bin/logstash /usr/local/bin/
4.1 check whether the functions of logstash (Apache) and elasticsearch (node) are normal and conduct docking test
Logstash this command tests
Field description and explanation:
● - f through this option, you can specify the configuration file of logstash and configure logstash according to the configuration file
● - e is followed by a string, which can be used as the configuration of logstash (if it is "empty", stdin is used as the input and stdout as the output by default)
● -t test whether the configuration file is correct, and then exit
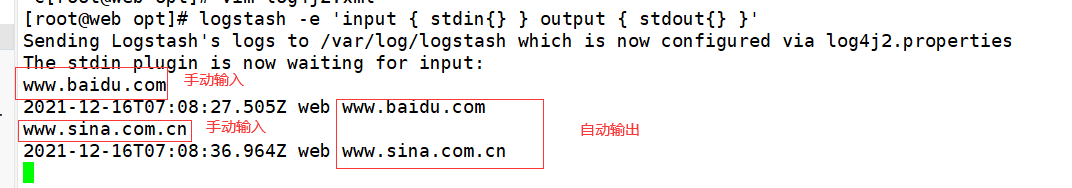
[root@web opt]# logstash -e 'input { stdin{} } output { stdout{} }'
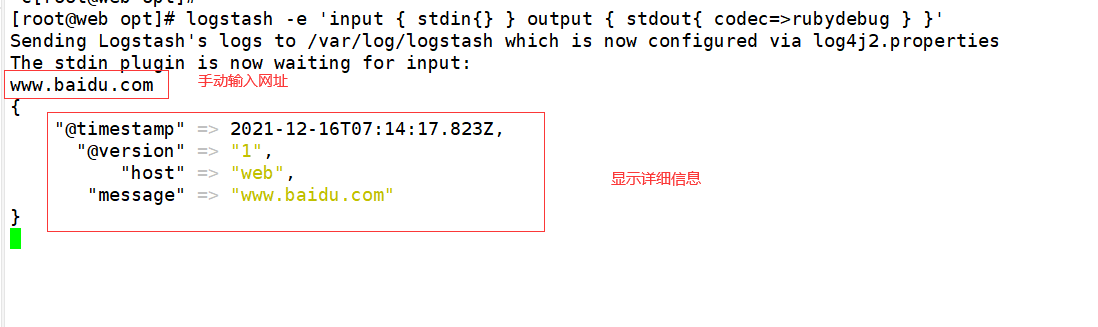
4.2. Use rubydebug to display detailed output. Codec is a codec
[root@web opt]# logstash -e 'input { stdin{} } output { stdout{ codec=>rubydebug } }'
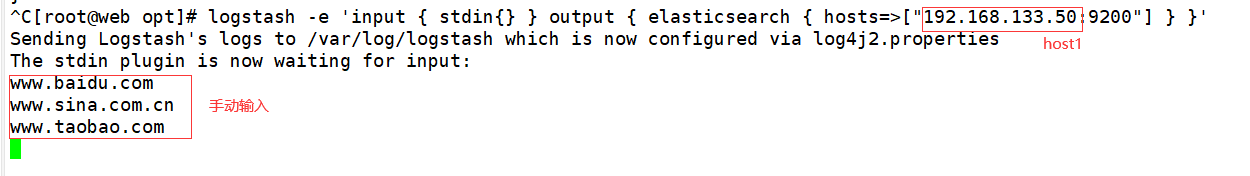
4.3. Use logstash to write information into elasticsearch, input and output
[root@web opt]# logstash -e 'input { stdin{} } output { elasticsearch { hosts=>["192.168.133.50:9200"] } }'
4.4 logstash configuration file
[root@web opt]# ll /var/log/messages

[root@web opt]# chmod o+r /var/log/messages adds readability to Other Users

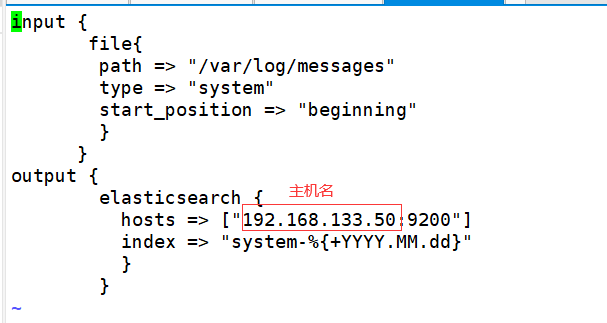
[root@web opt]# vi /etc/logstash/conf.d/system.conf
input {
       file{
        path => "/var/log/messages"
        type => "system"
        start_position => "beginning"
        }
      }
output {
        elasticsearch {
          hosts => ["192.168.133.50:9200"]
          index => "system-%{+YYYY.MM.dd}"
          }
        }
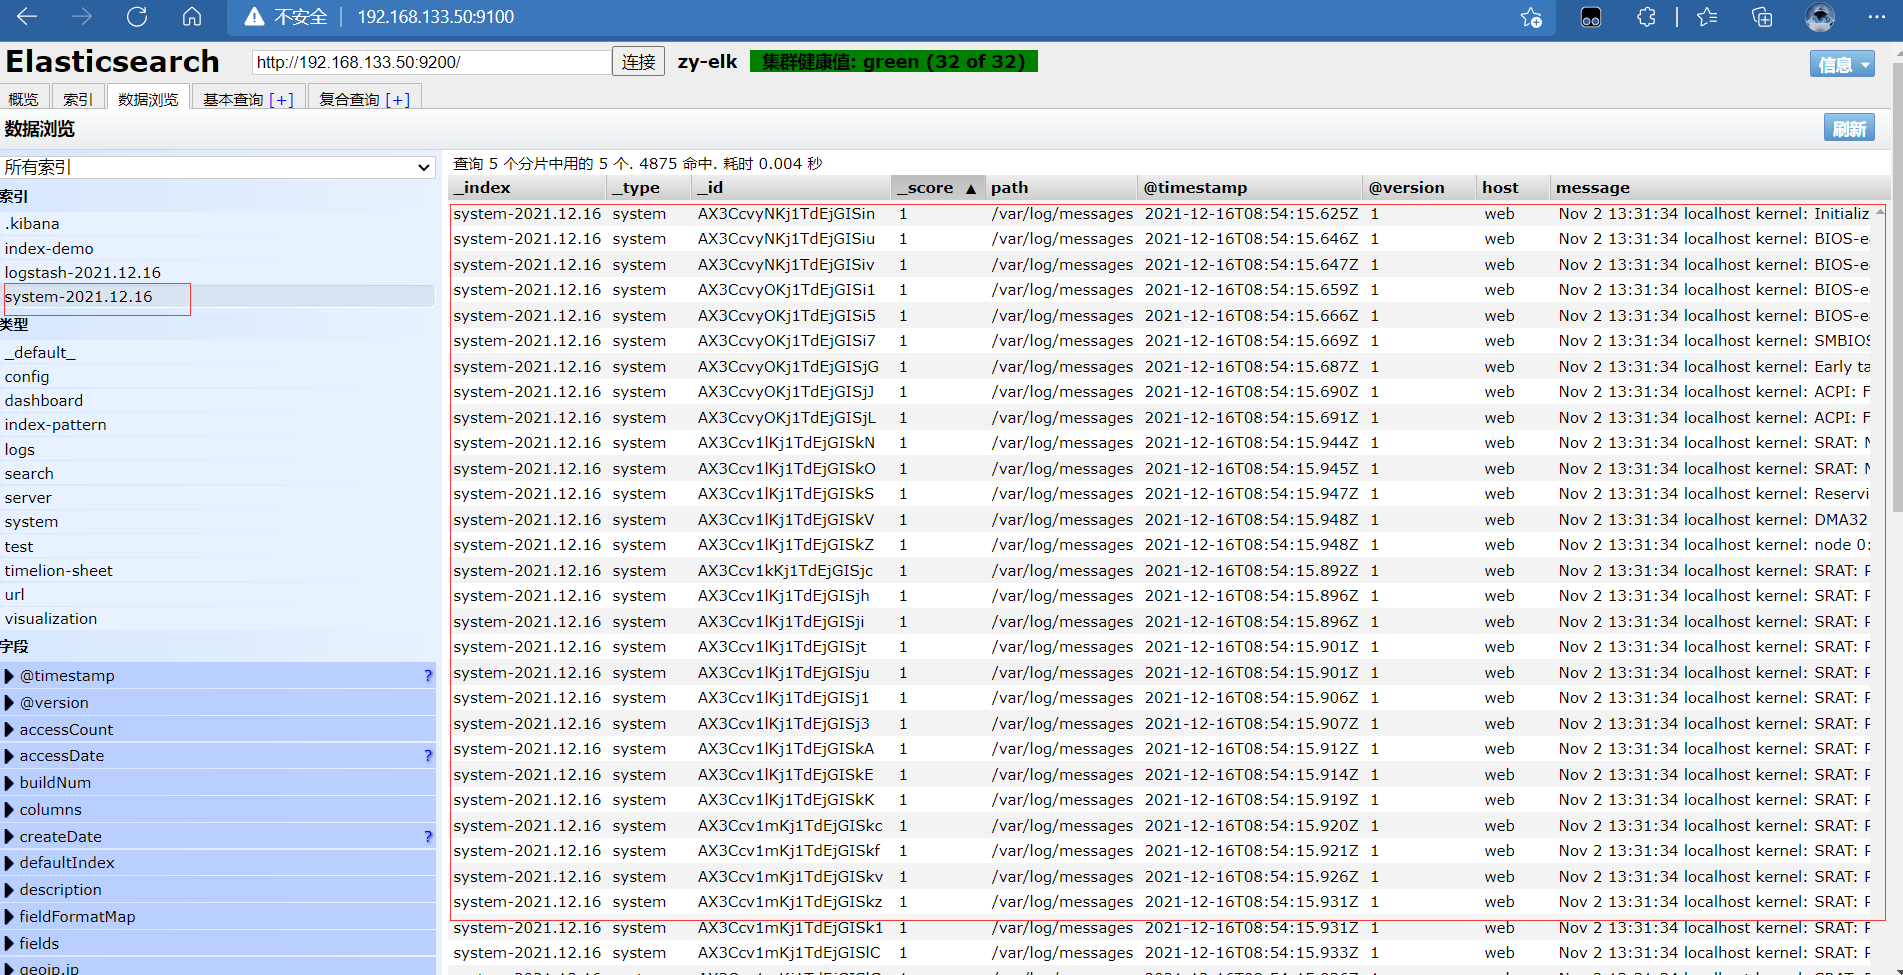
Location determination
[root@web opt]# vi /etc/logstash/logstash.yml

[root@web opt]# systemctl restart logstash.service
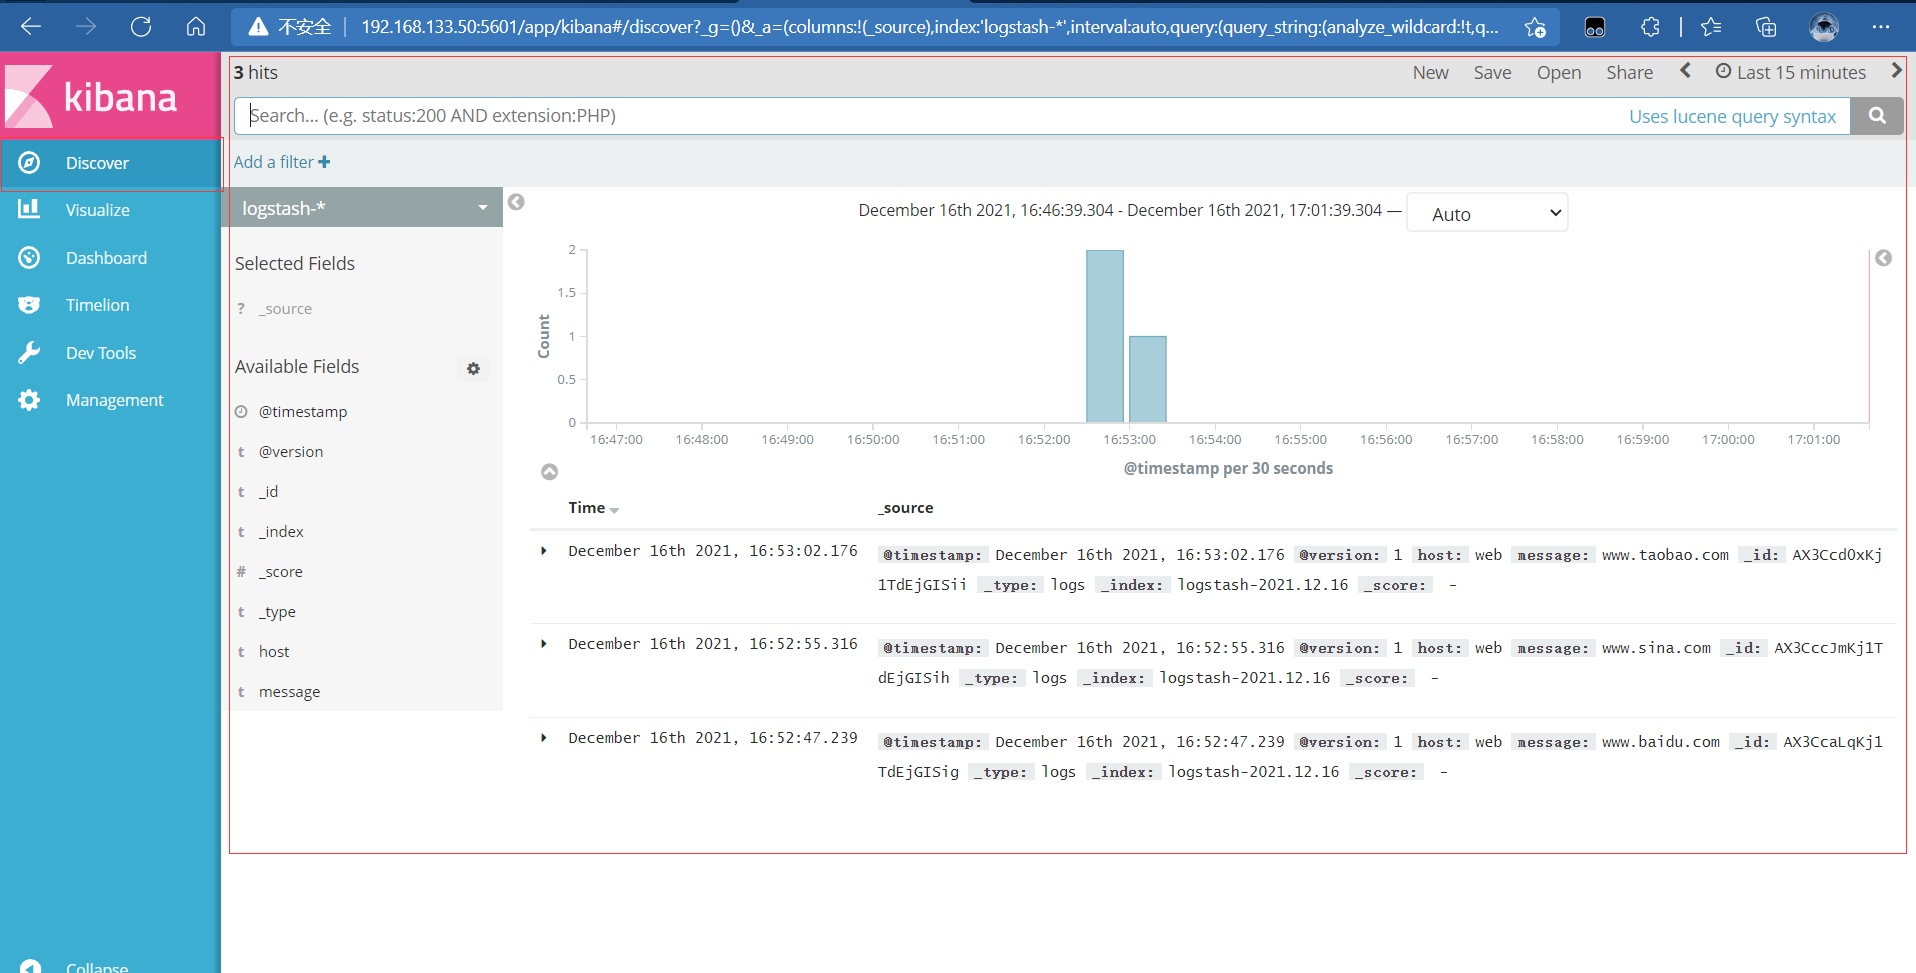
To 192.168 At 133.50:9100, you can see the log we just found
Login 192.168 133.50 host1 host
Install kibana on host1 host
[root@host1 ~]# cd /usr/local/src

[root@host1 src]#  rpm -ivh kibana-5.5.1-x86_64.rpm
[root@host1 kibana]# cp kibana.yml kibana.yml.bak
[root@host1 kibana]#  vi /etc/kibana/kibana.yml
 2 #server. Port: 5601 kibana open port
 change
2 server.port: 5601
7 #server.host: "localhost" listening port is opened and modified
 change
7 server.host: "0.0.0.0"
21 #elasticsearch.url: "http://localhost:9200 "Open, modify and contact elasticsearch"
change
21 elasticsearch.url: "http://192.168.133.50:9200"
30 #kibana.index: ".kibana" is added in elasticsearch Kibana index
 open
30 kibana.index: ".kibana"
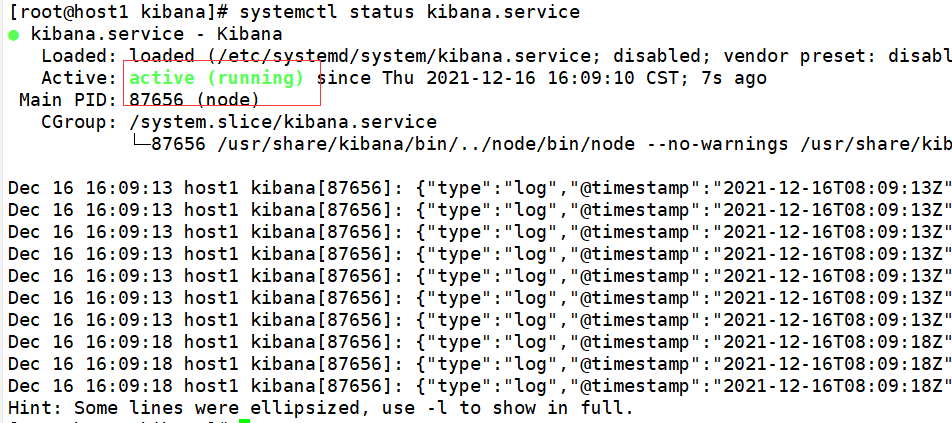
[root@host1 kibana]# systemctl start kibana.service
[root@host1 kibana]# systemctl status kibana.service
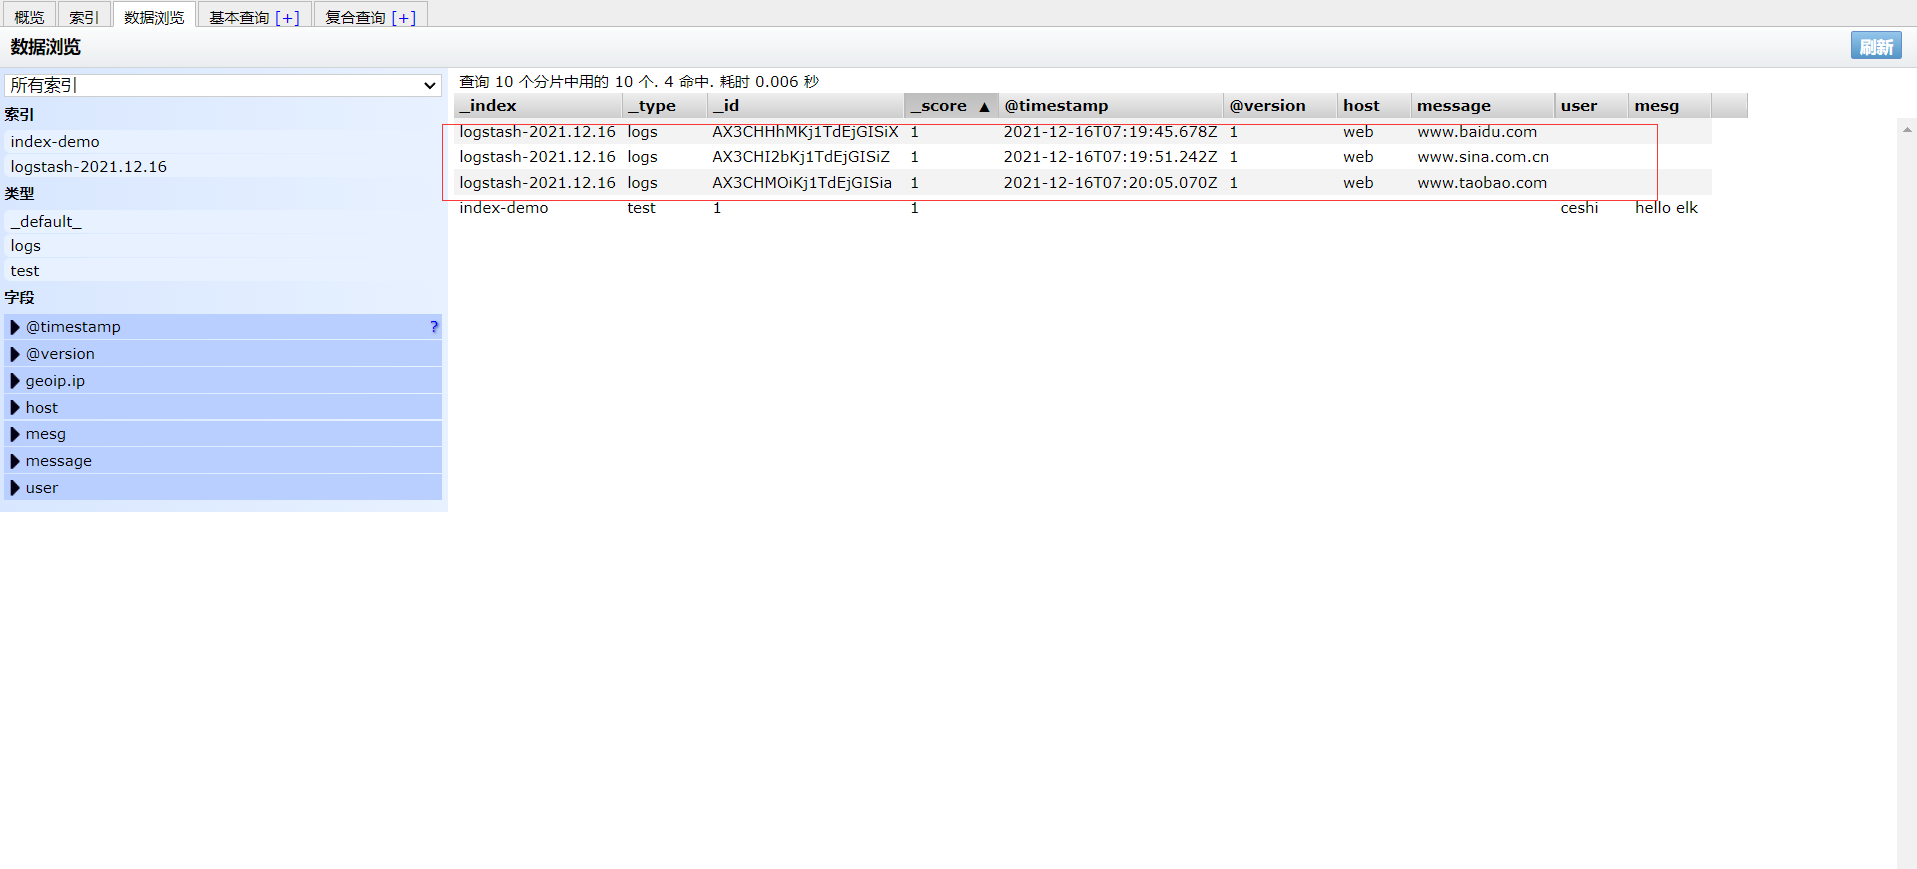
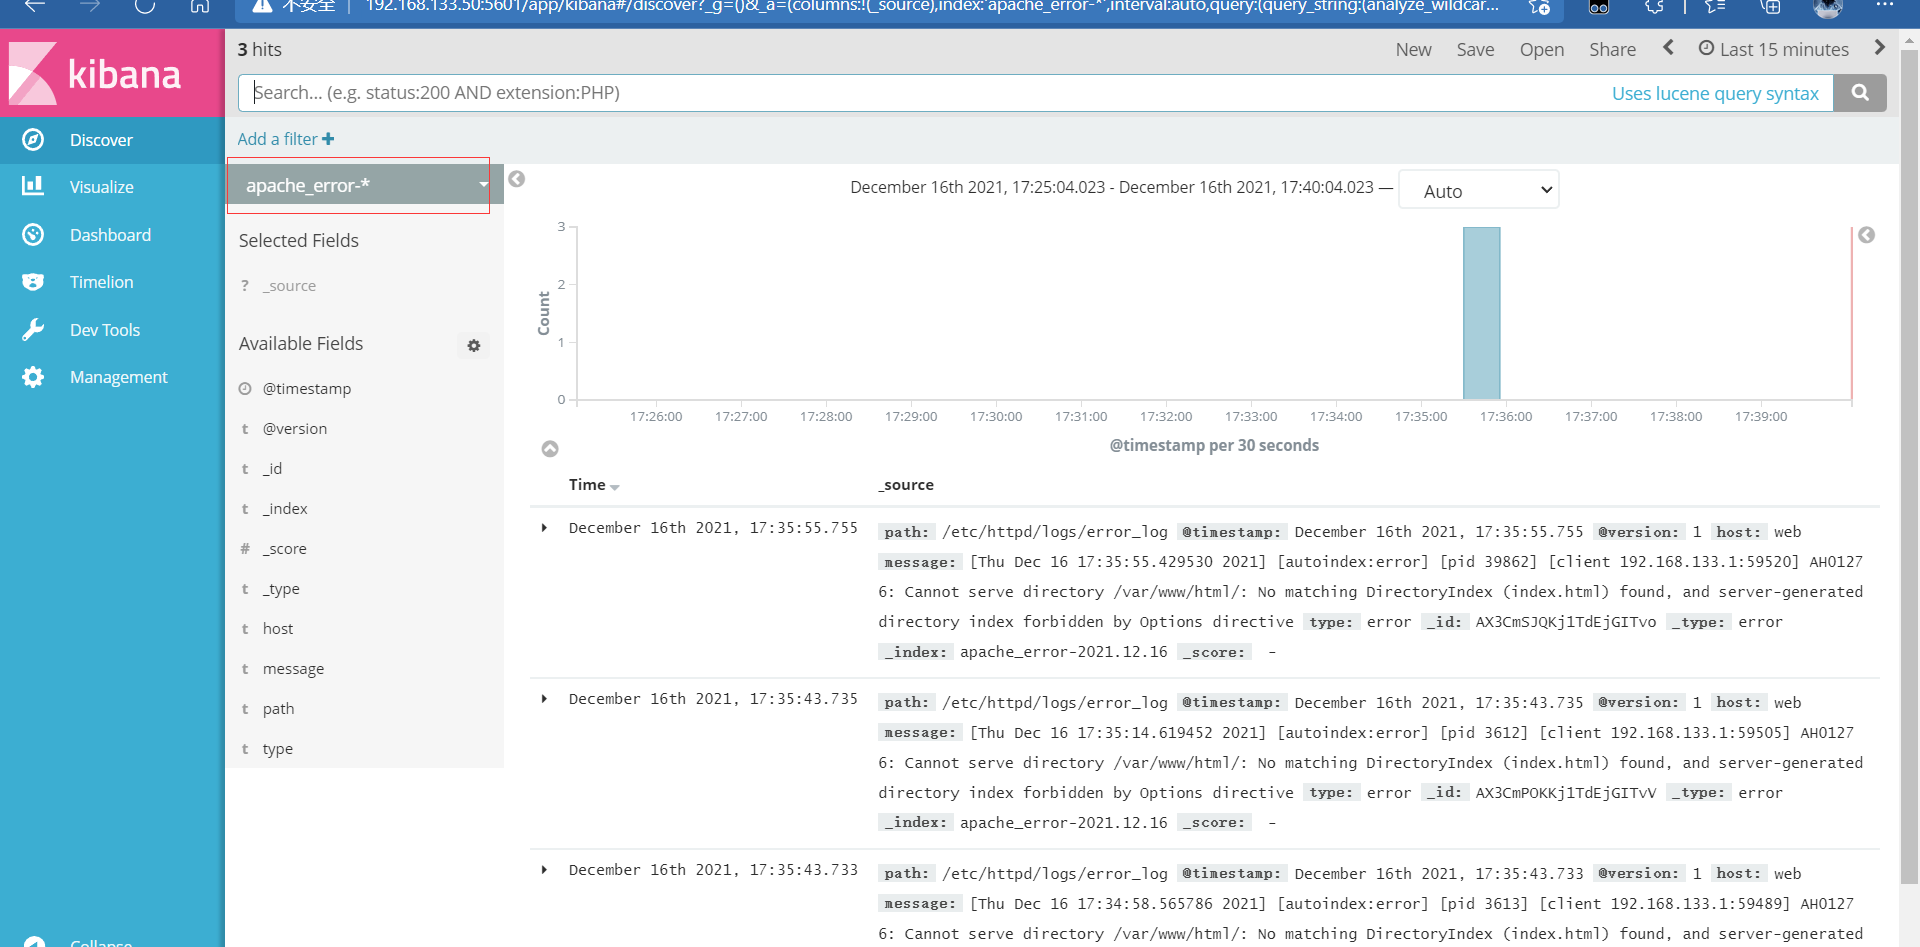
Then open it on the client http://192.168.133.50:5601
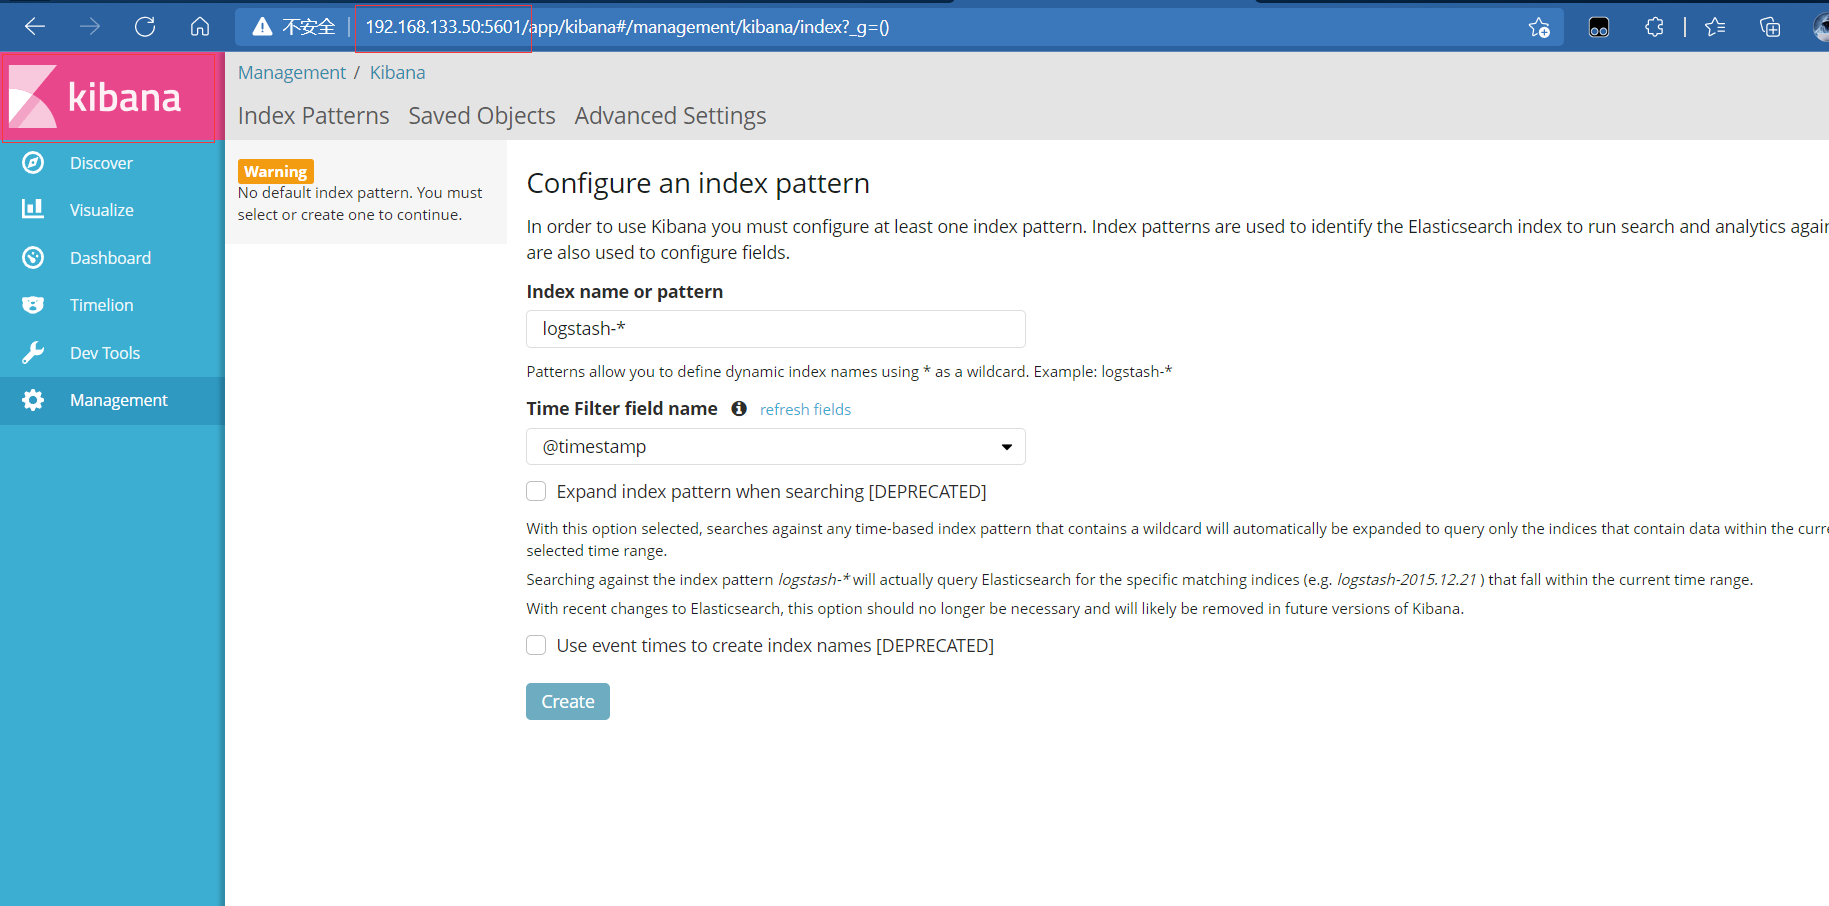
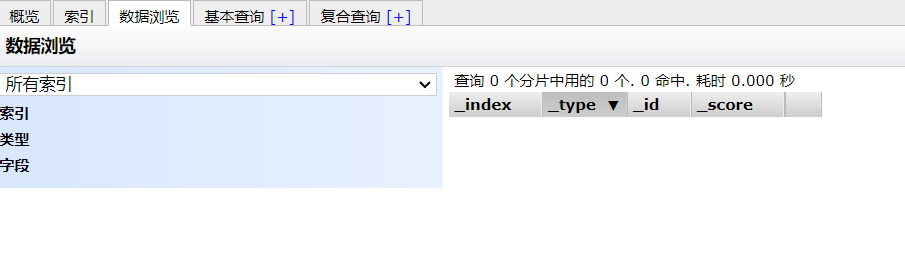
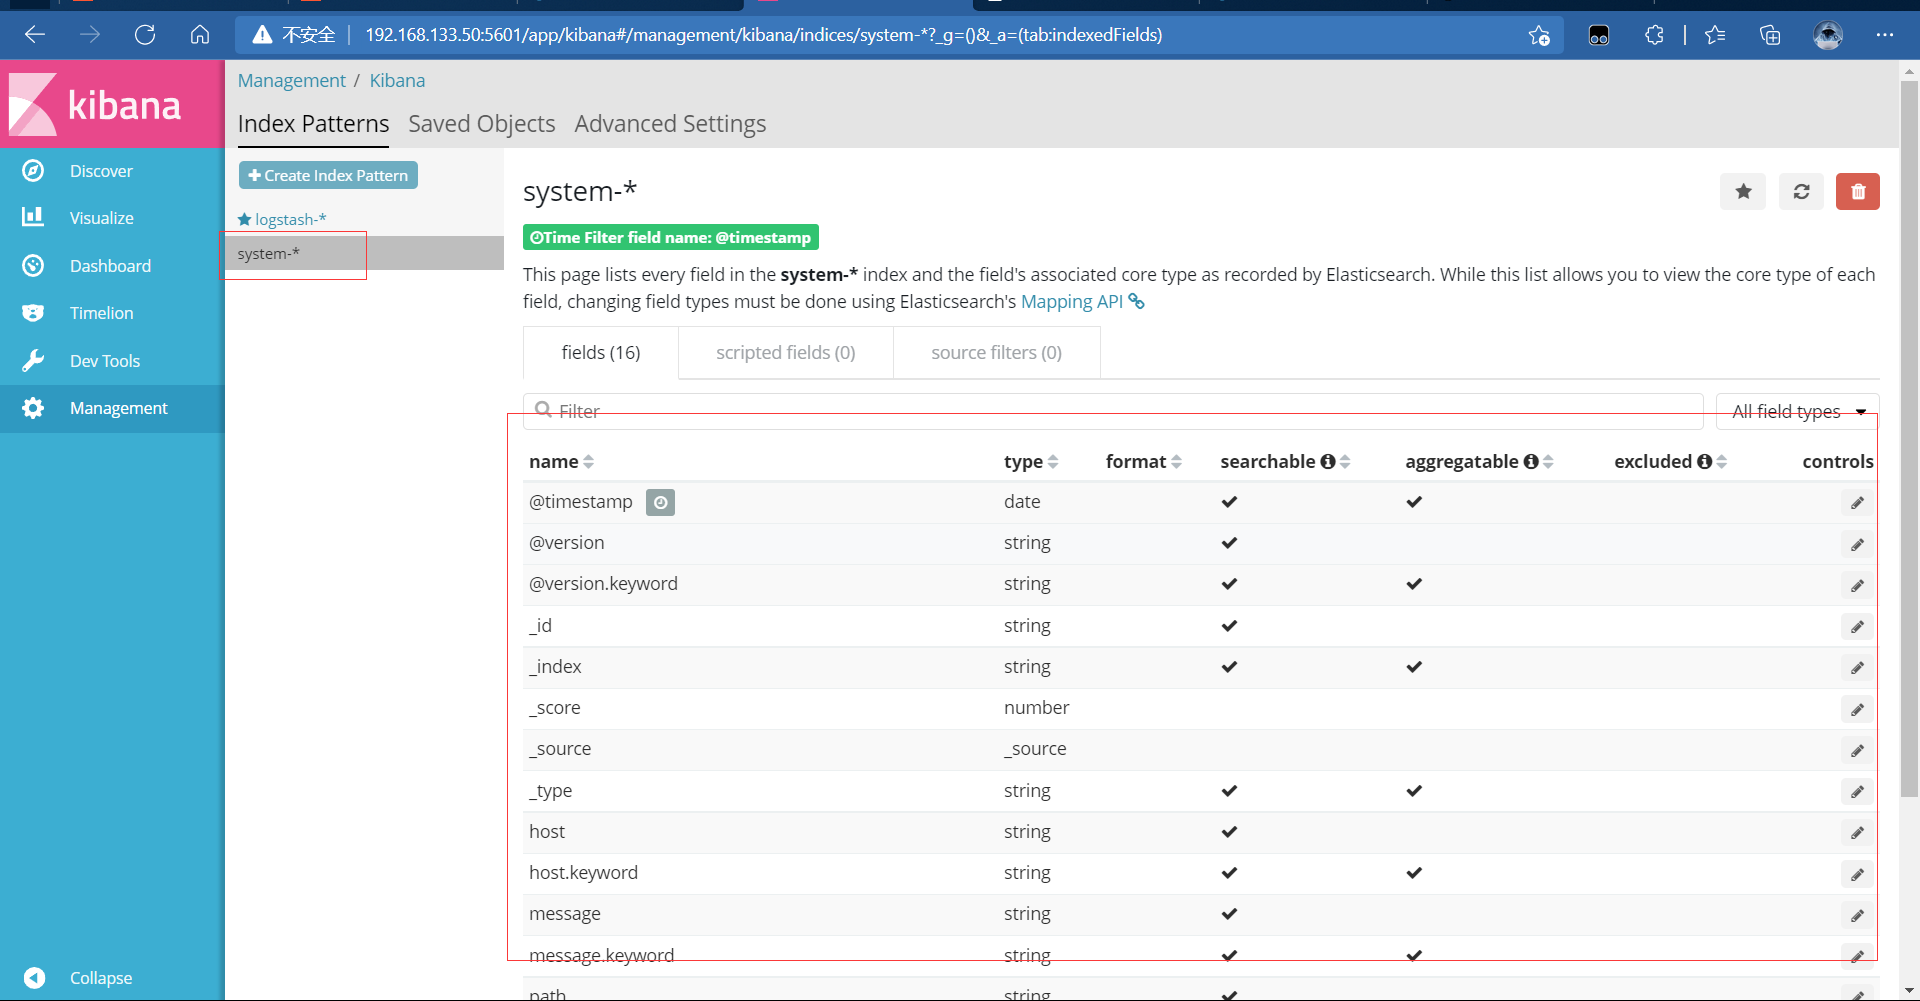
It can be created from the previous index key
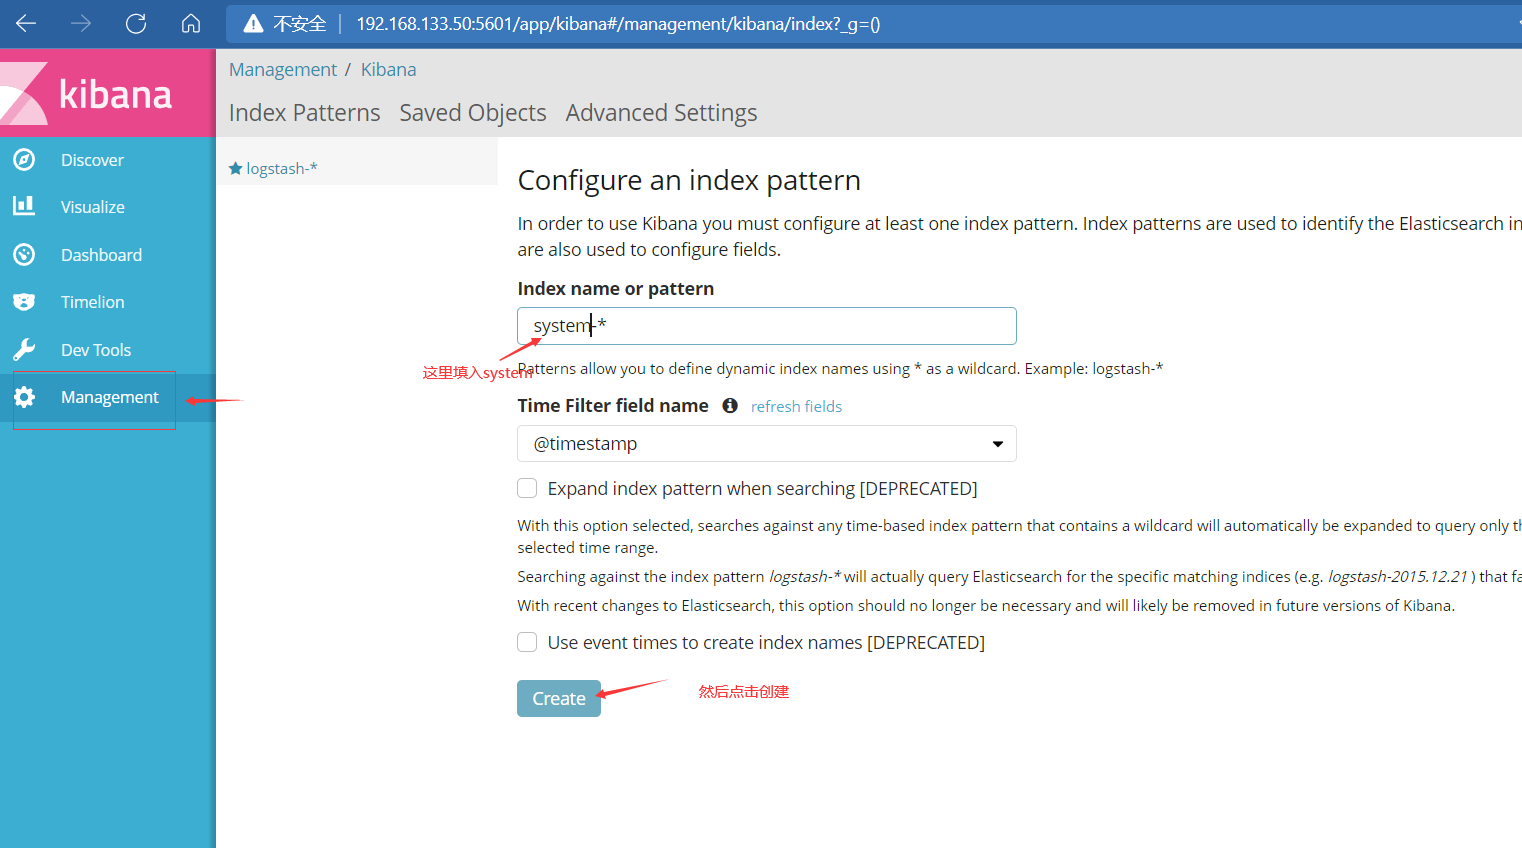
After creation, you can view it
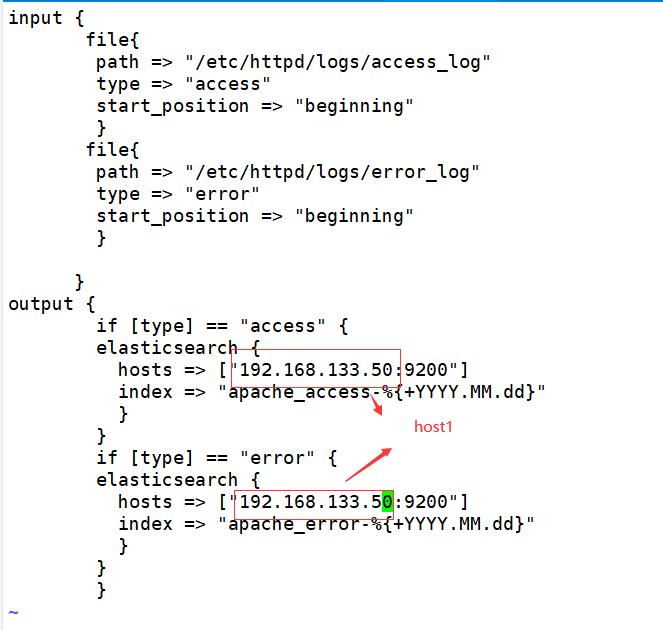
4.5. Connect Apache log files of Apache host (accessed and wrong)
[root@web ~]# cd /etc/logstash/conf.d/
[root@web conf.d]# touch apache_log.conf
[root@web conf.d]# vi apache_log.conf
input {
       file{
        path => "/etc/httpd/logs/access_log"
        type => "access"
        start_position => "beginning"
        }
       file{
        path => "/etc/httpd/logs/error_log"
        type => "error"
        start_position => "beginning"
        }

      }
output {
        if [type] == "access" {
        elasticsearch {
          hosts => ["192.168.133.50:9200"]
          index => "apache_access-%{+YYYY.MM.dd}"
          }
        }
        if [type] == "error" {
        elasticsearch {
          hosts => ["192.168.133.50:9200"]
          index => "apache_error-%{+YYYY.MM.dd}"
          }
        }
        }
[root@web conf.d]# pwd
/etc/logstash/conf.d
[root@web conf.d]# /usr/share/logstash/bin/logstash -f apache_log.conf runs under this folder

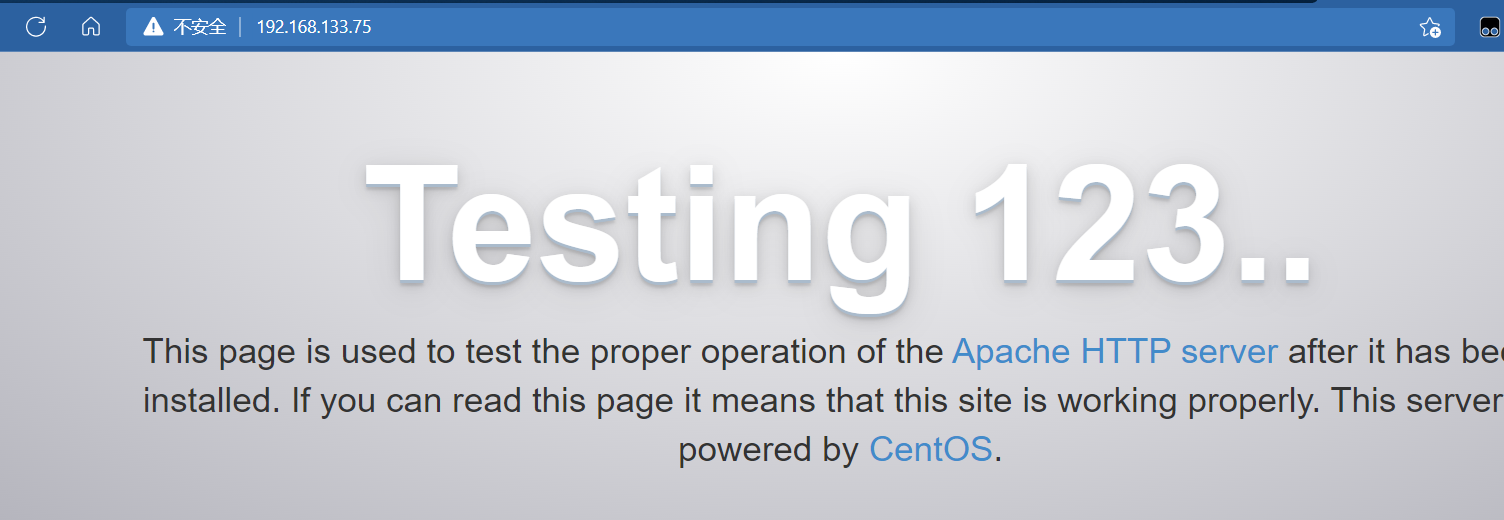
Login 192.168 133.75 the web host cannot display the access log otherwise
So at 192.168 These two indexes can be seen on 133.50:9200
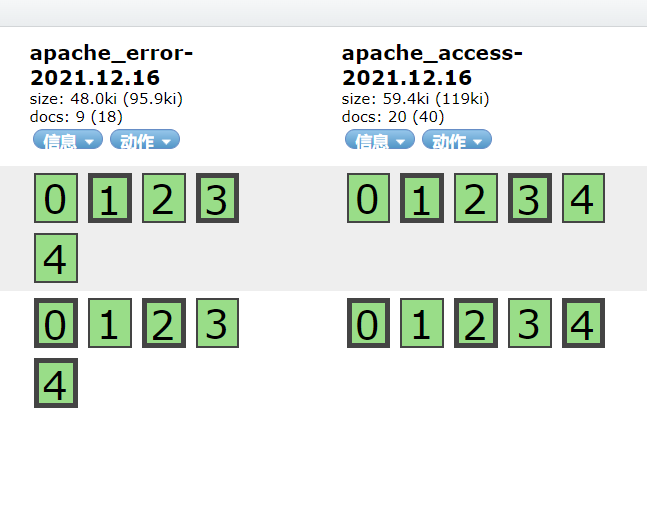
You can also create an index to view
7, elk architecture selection
1. Ordinary Edition
Since the normal logstash is placed on the server, there may be too many threads and occupy resources
We can put logstash on a separate server as the log server
Log segmentation is delivered periodically
NFS mount
rsync (used when the amount of data is small, or in combination with NFS)
2. Upgrade
logstash only does formatting, filtering and output
Join the filebeat collection and put it on the server
Logstash is clustered, and multiple logstash
Or in
Add some middleware to filebeat and logstash
For example, redis functions together
MQ message broker kafka