This is the fourth in a series, so let's continue to talk about how to deploy a simplified private cloud environment in your notebook to meet low-cost, low-power, low-latency experimental environments.
In the first three articles, we talked about basic virtualization-related Pre-preparation And prepared to avoid blind touch during construction Monitoring Services And the last one Basic Storage Service Build. Next, we will make some basic monitoring configurations and improve the monitoring services so that the storage services can run relatively steadily in our "vision".
Write before
In the previous article, we Mentioned Monitoring services, including Prometheus, work in two main modes: push and pull. To be able to use push mode, we deployed "Push Gateway: Push-Gateway" But is the Pull mode out of the box?
Except for some cloud-native applications, most default applications do not include interfaces that allow Prometheus to pull data out of the box and include application performance metrics data.
For these applications, in order to enable monitoring services and their continuous "data interaction", we need to set up some data reporting services on the application side that needs monitoring to provide this "data open" capability. These services are commonly referred to as "exporter s". They summarize the current running state of the application by using the application API, file monitoring, application data reading, etc. based on the actual situation of the application. They are provided when Prometheus captures data, which is generally called "metrics".
Then, let's chat next to the monitoring integration of several services mentioned earlier, just as their monitoring configurations are typical. The application configuration mentioned in this article has also been uploaded GitHub In, students in need can take their own.
Monitoring Integration for MinIO
The first app to talk about is a typical cloud native app that comes with an interface that lets Prometheus come out of the box. However, considering application performance and privacy requirements of operational data, this interface is not turned on by default.
Open the performance metrics interface for MinIO
In order for Prometheus to monitor MinIO, we need to first turn on its performance indicator interface by configuring variables, edit the docker-compose.yml file mentioned above, and add a new environment variable:
    environment:
      - MINIO_PROMETHEUS_AUTH_TYPE=public
There is also jwt for this optional configuration value here, but it is not recommended because Traefik will eventually be used for unified authentication management in our series and there is no need to add another layer. If you're interested in another pattern, you can Know for yourself.
After updating the configuration, we restart the application using docker-compose down & & docker-compose up-d, and MinIO's monitoring interface is ready for accessibility testing using the following address:
curl http://s3.storage.lab.com/minio/v2/metrics/cluster
If successful, you will see something similar to the following:
# HELP minio_bucket_objects_size_distribution Distribution of object sizes in the bucket, includes label for the bucket name.
# TYPE minio_bucket_objects_size_distribution gauge
minio_bucket_objects_size_distribution{bucket="public",range="BETWEEN_1024_B_AND_1_MB",server="127.0.0.1:9000"} 1
minio_bucket_objects_size_distribution{bucket="public",range="BETWEEN_10_MB_AND_64_MB",server="127.0.0.1:9000"} 0
minio_bucket_objects_size_distribution{bucket="public",range="BETWEEN_128_MB_AND_512_MB",server="127.0.0.1:9000"} 0
minio_bucket_objects_size_distribution{bucket="public",range="BETWEEN_1_MB_AND_10_MB",server="127.0.0.1:9000"} 0
minio_bucket_objects_size_distribution{bucket="public",range="BETWEEN_64_MB_AND_128_MB",server="127.0.0.1:9000"} 0
minio_bucket_objects_size_distribution{bucket="public",range="GREATER_THAN_512_MB",server="127.0.0.1:9000"} 0
minio_bucket_objects_size_distribution{bucket="public",range="LESS_THAN_1024_B",server="127.0.0.1:9000"} 0
# HELP minio_bucket_replication_received_bytes Total number of bytes replicated to this bucket from another source bucket.
# TYPE minio_bucket_replication_received_bytes gauge
minio_bucket_replication_received_bytes{bucket="public",server="127.0.0.1:9000"} 0
# HELP minio_bucket_usage_object_total Total number of objects
...
(The printed content above is the performance metrics data captured regularly when Prometheus actually works as mentioned earlier.)
Configure Prometheus to capture MinIO performance metrics data
When the data is ready to be reported, let's configure the capture configuration for Prometheus so that the data can be continuously written to Prometheus's temporal database.
In the monitoring section, we mentioned Prometheus's Deployment and Configuration The main capture configurations are saved in config/prometheus.yml, so we need to continue to modify this configuration so that it can grab MinIO.
  - job_name: minio
    scrape_interval: 10s
    metrics_path: /minio/v2/metrics/cluster
    scheme: http
    static_configs:
    - targets: ['s3.storage.lab.com']
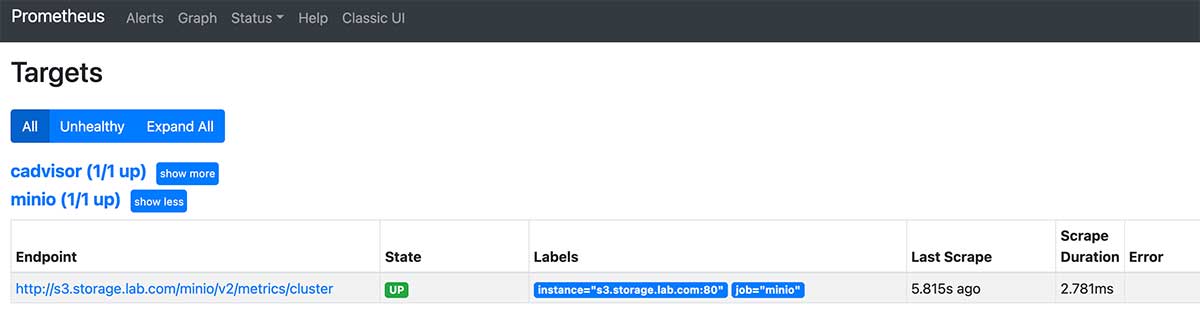
After updating the configuration, restart prometheus using docker-compose down & & docker-compose up-d as well, and then access it in the browser: http://monitor.lab.com:9090/targets , you can see in the list that MinIO has been used correctly as a new data source.
Configure Grafana monitoring panel for MinIO
To visualize MinIO's performance, we can continue to configure a monitoring panel for MinIO in Grafana. MinIO has officially uploaded a more generic template to the Grafana template market, which we can use directly.
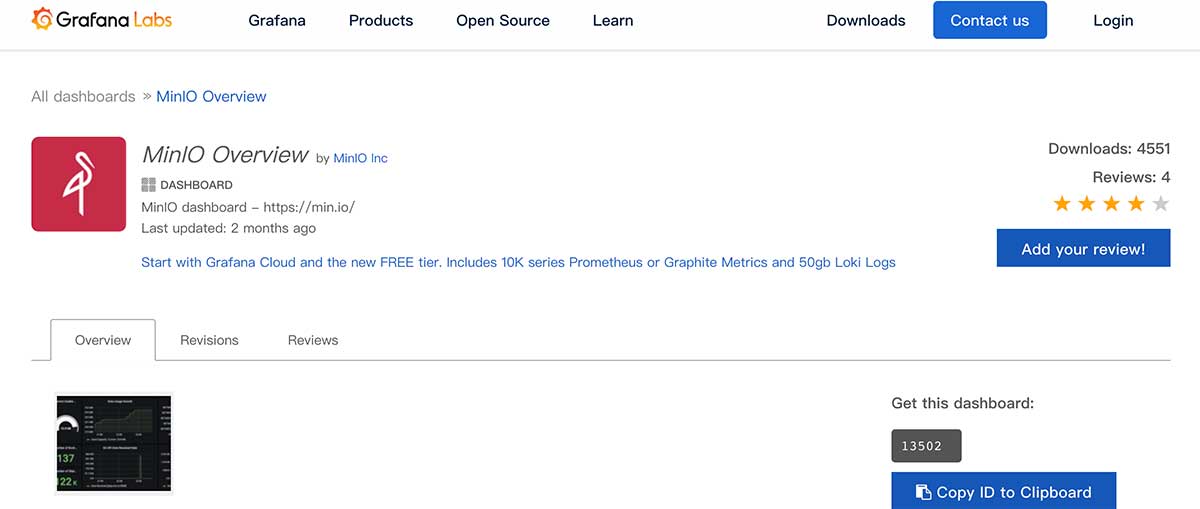
Reference to the " Grafana Control Panel Import "Mode, import the panel number"13502"into Grafana, you can see the monitoring panel interface below.
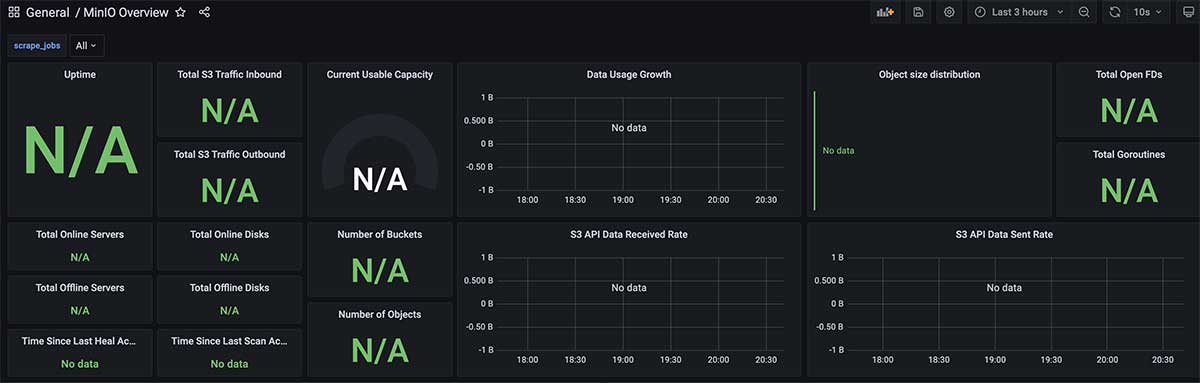
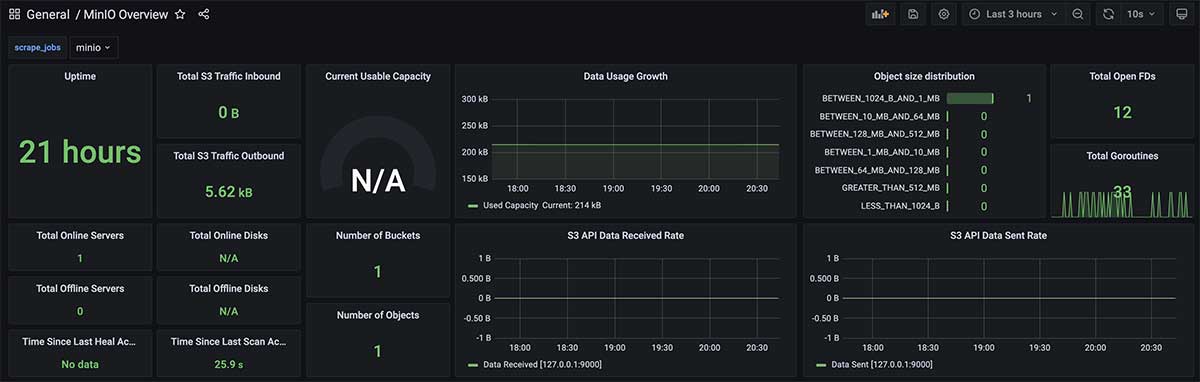
You can see that there are a lot of "N/A" in the interface above, because Grafana doesn't know which reported application data we're going to use to show it. After filtering and using "minio" in the upper left corner of the interface (the last section on Prometheus Capture Configuration), we can see the correct monitoring interface.
Next, let's talk about another common application's monitoring configuration.
Monitoring Integration for Syncthin
Unlike MinIO, Syncthin native supports running data queries through API s, but it does not meet the monitoring data format requirements of Prometheus, so we need to set up a monitoring indicator interface service (exporter) for it to expose data and configure Prometheus to capture data.
Configure Syncthin Performance Indicator Service
Details about how Syncthing Exporter works can be watched GitHub's warehouse . For better performance, I rebuilt the container image of this project and uploaded it to https://github.com/soulteary/syncthing_exporter . The image has been pushed to DockerHub, so you can get this smaller container image (only 12M after compression) by:
docker pull soulteary/syncthing-exporter
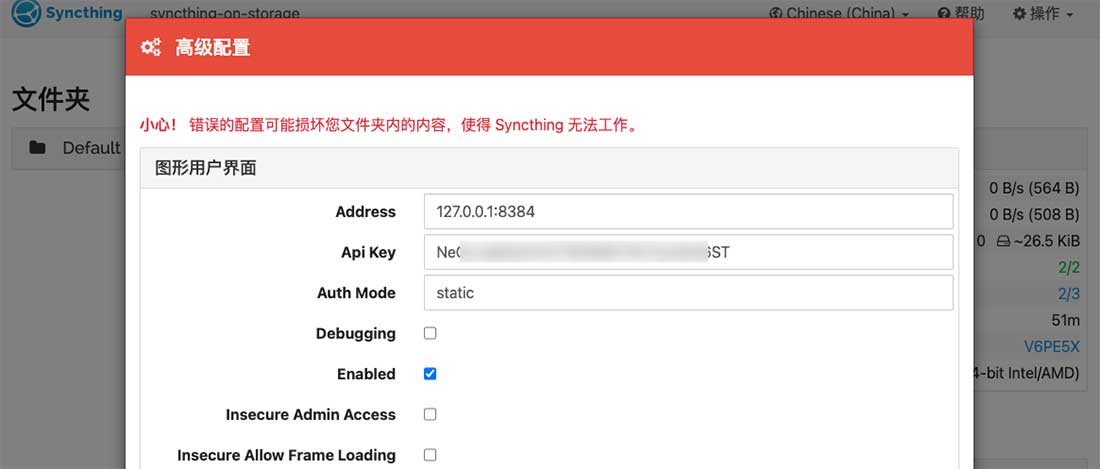
Visit https://syncthing.storage.lab.com , click the action button on the right side of the top navigation bar, select the Advanced Configuration menu, and get the API KEY we want to use next in the dialog box that pops up.
Next, edit the last article Syncthing mentioned Environment variable profile.env, add the following at the end of the file and replace the following "DOCKER_EXPORTER_API_TOKEN" with the API you just obtained:
# == exporter
DOCKER_EXPORTER_IMAGE_NAME=soulteary/syncthing-exporter
DOCKER_EXPORTER_API_TOKEN=YOUR_API_TOKEN
DOCKER_EXPORTER_HOSTNAME=syncthing-exporter-on-storage
DOCKER_EXPORTER_DOMAIN=syncthing-exporter.storage.lab.com
Then, write the container configuration docker-compose.exporter.yml for Exporter:
version: "3"

services:
  syncthing-exporter:
    image: ${DOCKER_EXPORTER_IMAGE_NAME}
    container_name: DOCKER_EXPORTER_HOSTNAME
    expose:
      - 9093
    restart: always
    environment:
      SYNCTHING_URI: "http://${DOCKER_SYNCTHING_HOSTNAME}:8384/"
      SYNCTHING_TOKEN: ${DOCKER_EXPORTER_API_TOKEN}
    labels:
      - "traefik.enable=true"
      - "traefik.docker.network=traefik"

      - "traefik.http.routers.sync-exporter-http.entrypoints=http"
      - "traefik.http.routers.sync-exporter-http.rule=Host(`${DOCKER_EXPORTER_DOMAIN}`)"
      - "traefik.http.routers.sync-exporter-http.service=sync-exporter-backend"

      - "traefik.http.routers.sync-exporter-https.entrypoints=https"
      - "traefik.http.routers.sync-exporter-https.tls=true"
      - "traefik.http.routers.sync-exporter-https.rule=Host(`${DOCKER_EXPORTER_DOMAIN}`)"
      - "traefik.http.routers.sync-exporter-https.service=sync-exporter-backend"

      - "traefik.http.services.sync-exporter-backend.loadbalancer.server.scheme=http"
      - "traefik.http.services.sync-exporter-backend.loadbalancer.server.port=9093"
    networks:
      - traefik
    logging:
      driver: "json-file"
      options:
        max-size: "1m"

networks:
  traefik:
    external: true
Start the application using docker-compose-f docker-compose.exporter.yml up-d. If you use docker logs to view this newly created container, you will see a log similar to the following:
level=info ts=2021-11-09T13:11:20.621Z caller=main.go:94 msg="Starting syncthing_exporter" version="(version=0.3.2, branch=main, revision=84736272309b3b08d6b6feb08cc7d41f13b4cd5e)"
level=info ts=2021-11-09T13:11:20.621Z caller=main.go:95 msg="Build context" build_context="(go=go1.17.3, user=local, date=09 Nov 2021 10:20:09 UTC)"
level=info ts=2021-11-09T13:11:20.621Z caller=main.go:108 msg="Listening on" address=:9093
Also use commands to see the accessibility of services:
curl http://syncthing-exporter.storage.lab.com/metrics
You will see log data similar to the previous one:
# HELP go_gc_duration_seconds A summary of the pause duration of garbage collection cycles.
# TYPE go_gc_duration_seconds summary
go_gc_duration_seconds{quantile="0"} 2.2292e-05
go_gc_duration_seconds{quantile="0.25"} 2.2292e-05
go_gc_duration_seconds{quantile="0.5"} 2.2292e-05
go_gc_duration_seconds{quantile="0.75"} 2.2292e-05
go_gc_duration_seconds{quantile="1"} 2.2292e-05
go_gc_duration_seconds_sum 2.2292e-05
go_gc_duration_seconds_count 1
# HELP go_goroutines Number of goroutines that currently exist.
# TYPE go_goroutines gauge
go_goroutines 11
# HELP go_info Information about the Go environment.
# TYPE go_info gauge
go_info{version="go1.17.3"} 1
# HELP go_memstats_alloc_bytes Number of bytes allocated and still in use.
# TYPE go_memstats_alloc_bytes gauge
go_memstats_alloc_bytes 3.236424e+06
# HELP go_memstats_alloc_bytes_total Total number of bytes allocated, even if freed.
# TYPE go_memstats_alloc_bytes_total counter
go_memstats_alloc_bytes_total 4.851856e+06
# HELP go_memstats_buck_hash_sys_bytes Number of bytes used by the profiling bucket hash table.
# TYPE go_memstats_buck_hash_sys_bytes gauge
...
Configure Prometheus to grab Syncthin performance metrics data
When the data is ready to be reported, we continue to configure the data capture configuration for Prometheus so that the data can be written to the Prometheus database as consistently as possible. Continue editing the config/prometheus.yml configuration file:
  - job_name: syncthing
    scrape_interval: 10s
    metrics_path: /metrics
    scheme: http
    static_configs:
      - targets: ['syncthing-exporter.storage.lab.com']
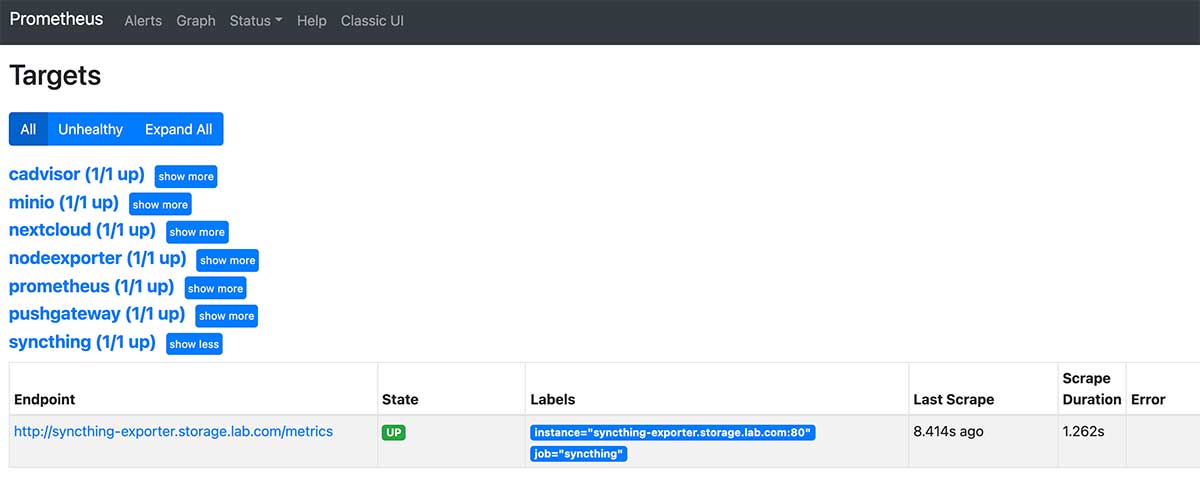
After updating the above configuration, restart prometheus using docker-compose down & & docker-compose up-d and access it in your browser: http://monitor.lab.com:9090/targets Syncthin's data source appears in the list.
Configure Grafana monitoring panel for Syncthin
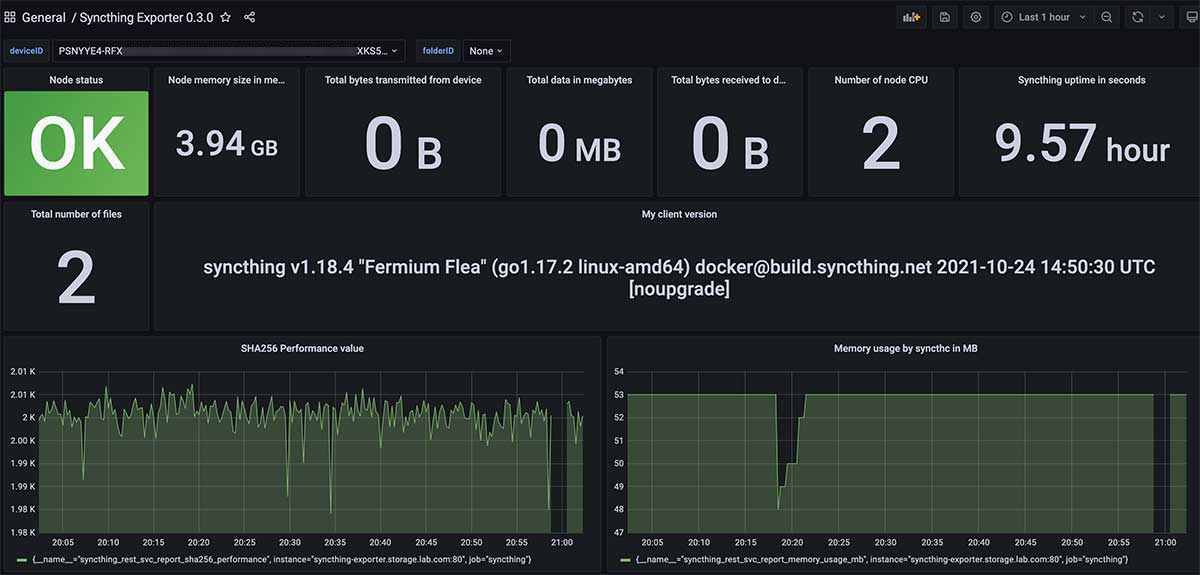
Syncthin is not configured for upload in Grafana's official panel market. I modified the panel configuration for the Syncthin open source project and uploaded it to GitHub.
Copy everything in this JSON configuration, then paste it in the text box of the import configuration using Grafana to import the configuration, and the Syncthin monitoring panel is ready.
NextCloud Setup and Monitoring Configuration
In the previous article, to be lazy, I used directly those previously used by the top international academics NextCloud scheme . However, some students suggested that "I only have a small number of users (such as myself) using NextCloud, can I not use independent databases, use lightweight SQLite, and save some system resources?"
The answer is yes, NextCloud supports using SQLite for data storage by default, so it's not a big problem as a self-use solution without noticing that data is backed up regularly.
NextCloud Single Use Simple Configuration
In order to let students lazy, here is a simple configuration of NextCloud, the complete configuration has been uploaded to GitHub:
version: "3.6"

services:

  nextcloud:
    image: ${DOCKER_NEXTCLOUD_IMAGE_NAME}
    container_name: ${DOCKER_NEXTCLOUD_HOSTNAME}
    restart: always
    expose:
      - 80
    volumes:
      # Using in Linux
      # - /etc/localtime:/etc/localtime:ro
      # - /etc/timezone:/etc/timezone:ro
      - ./data:/var/www/html:rw
    extra_hosts:
      - "${DOCKER_NEXTCLOUD_DOMAIN}:127.0.0.1"
    networks:
      - traefik
    labels:
      - "traefik.enable=true"
      - "traefik.docker.network=traefik"
      - "traefik.http.routers.www-nextcloud.entrypoints=http"
      - "traefik.http.routers.www-nextcloud.rule=Host(`${DOCKER_NEXTCLOUD_DOMAIN}`)"
      - "traefik.http.routers.ssl-nextcloud.entrypoints=https"
      - "traefik.http.routers.ssl-nextcloud.tls=true"
      - "traefik.http.routers.ssl-nextcloud.rule=Host(`${DOCKER_NEXTCLOUD_DOMAIN}`)"
      - "traefik.http.services.www-nextcloud-backend.loadbalancer.server.scheme=http"
      - "traefik.http.services.www-nextcloud-backend.loadbalancer.server.port=80"
    logging:
        driver: "json-file"
        options:
            max-size: "1m"
networks:
  traefik:
    external: true
And the.env environment variables to be used for this configuration:
# == nextcloud
DOCKER_NEXTCLOUD_IMAGE_NAME=nextcloud:22.2.0
DOCKER_NEXTCLOUD_HOSTNAME=nextcloud.storage.lab.com
DOCKER_NEXTCLOUD_DOMAIN=nextcloud.storage.lab.com
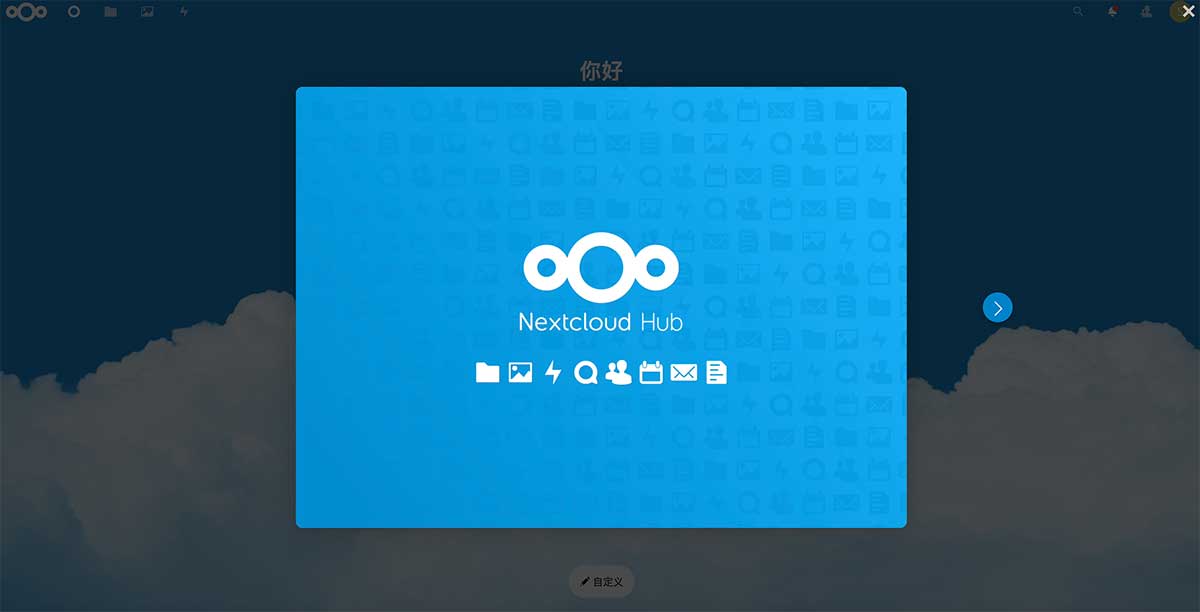
Start the service with docker-compose up-d and open our configured domain name nextcloud.storage.lab.com in the browser to start the configuration installation of NextCloud. After the installation (initialization) is complete, you will be able to see the long-lost welcome screen.
Configure NextCloud's Performance Indicator Service
When the NextCloud service is ready, NextCloud, like Syncthin, does not directly support data collection using Prometheus itself. So we also need to create an Exporter service for it. First in the environment variable.env file used by NextCloud, continue adding the configuration you need to use (replace the following configuration with your own application account and password):
# == exporter
DOCKER_EXPORTER_IMAGE_NAME=xperimental/nextcloud-exporter
DOCKER_EXPORTER_USER=soulteary
DOCKER_EXPORTER_PASS=soulteary
DOCKER_EXPORTER_DOMAIN=nextcloud-exporter.storage.lab.com
Next, write the container configuration that Exporter needs to use:
version: "3.6"

services:

  nextcloud-exporter:
    image: ${DOCKER_EXPORTER_IMAGE_NAME}
    restart: always
    environment:
      NEXTCLOUD_SERVER: http://${DOCKER_NEXTCLOUD_DOMAIN}
      NEXTCLOUD_USERNAME: ${DOCKER_EXPORTER_USER}
      NEXTCLOUD_PASSWORD: ${DOCKER_EXPORTER_PASS}
      NEXTCLOUD_TIMEOUT: 5s
    expose:
      - 9205
    networks:
      - traefik
    labels:
      - "traefik.enable=true"
      - "traefik.docker.network=traefik"
      - "traefik.http.routers.http-nextcloud-exporter.entrypoints=http"
      - "traefik.http.routers.http-nextcloud-exporter.rule=Host(`${DOCKER_EXPORTER_DOMAIN}`)"
      - "traefik.http.routers.nextcloud-exporter.entrypoints=https"
      - "traefik.http.routers.nextcloud-exporter.tls=true"
      - "traefik.http.routers.nextcloud-exporter.rule=Host(`${DOCKER_EXPORTER_DOMAIN}`)"
      - "traefik.http.services.nextcloud-exporter-backend.loadbalancer.server.scheme=http"
      - "traefik.http.services.nextcloud-exporter-backend.loadbalancer.server.port=9205"
    logging:
        driver: "json-file"
        options:
            max-size: "1m"
networks:
  traefik:
    external: true
Then start the service using docker-compose-f docker-compose.exporter.yml up-d.
We also use commands to check the availability of services:
curl http://nextcloud-exporter.storage.lab.com/metrics
Not surprisingly, you'll see a "familiar" log:
# HELP go_gc_duration_seconds A summary of the pause duration of garbage collection cycles.
# TYPE go_gc_duration_seconds summary
go_gc_duration_seconds{quantile="0"} 0.000185922
go_gc_duration_seconds{quantile="0.25"} 0.000185922
go_gc_duration_seconds{quantile="0.5"} 0.000224615
go_gc_duration_seconds{quantile="0.75"} 0.000224615
go_gc_duration_seconds{quantile="1"} 0.000224615
go_gc_duration_seconds_sum 0.000410537
go_gc_duration_seconds_count 2
# HELP go_goroutines Number of goroutines that currently exist.
# TYPE go_goroutines gauge
go_goroutines 9
# HELP go_info Information about the Go environment.
# TYPE go_info gauge
go_info{version="go1.15.3"} 1
# HELP go_memstats_alloc_bytes Number of bytes allocated and still in use.
# TYPE go_memstats_alloc_bytes gauge
go_memstats_alloc_bytes 3.402328e+06
# HELP go_memstats_alloc_bytes_total Total number of bytes allocated, even if freed.
# TYPE go_memstats_alloc_bytes_total counter
go_memstats_alloc_bytes_total 7.031024e+06
# HELP go_memstats_buck_hash_sys_bytes Number of bytes used by the profiling bucket hash table.
# TYPE go_memstats_buck_hash_sys_bytes gauge
go_memstats_buck_hash_sys_bytes 1.446245e+06
# HELP go_memstats_frees_total Total number of frees.
# TYPE go_memstats_frees_total counter
go_memstats_frees_total 31048
...
Configure Prometheus to capture NextCloud performance metrics data
The third repeat operation, should be a familiar light car: D. Continue editing the config/prometheus.yml configuration file:
  - job_name: nextcloud
    scrape_interval: 10s
    metrics_path: /metrics
    scheme: http
    static_configs:
      - targets: ['nextcloud-exporter.storage.lab.com']
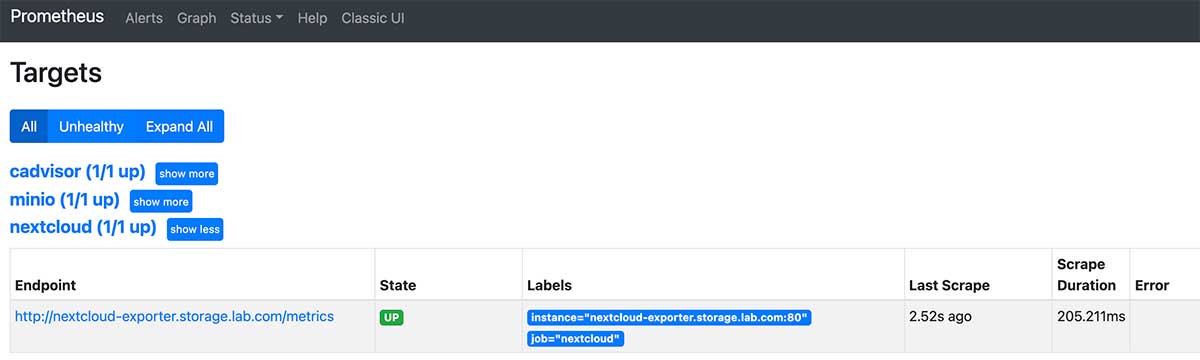
Restart Prometheus using docker-compose down & & docker-compose up-d and access it in your browser: http://monitor.lab.com:9090/targets , confirm that the list contains the newly configured data source for NextCloud.
Configure Grafana monitoring panel for NextCloud
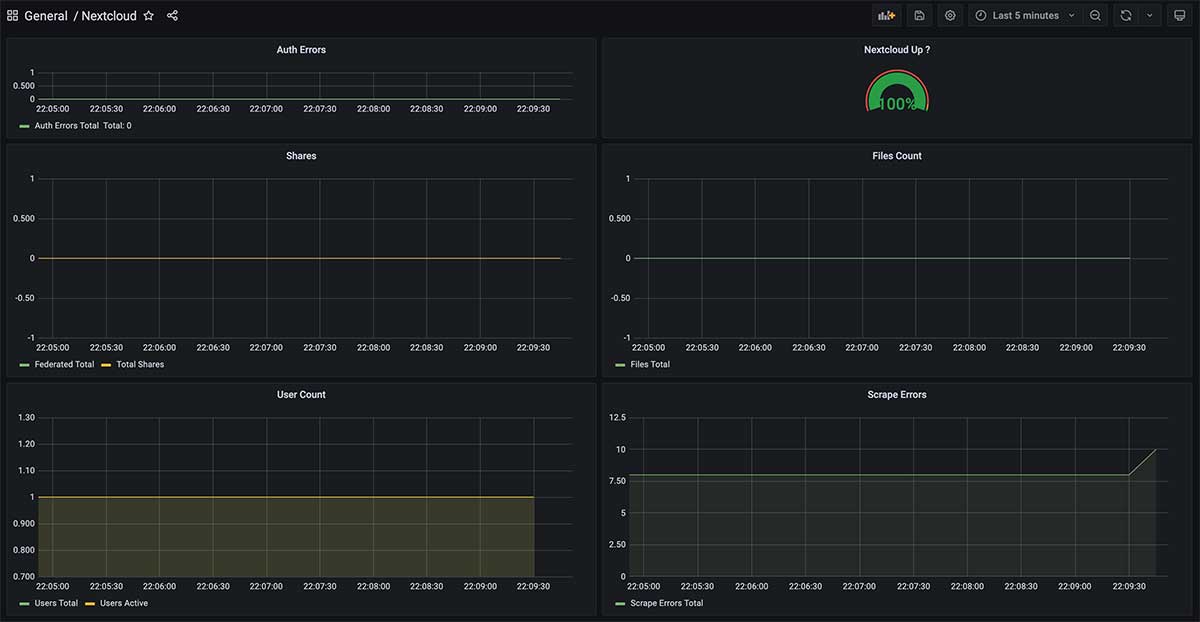
Contributors to NextCloud Exporter's open source project provide an out-of-the-box panel, so configuring the monitoring panel is much simpler than Syncthin.
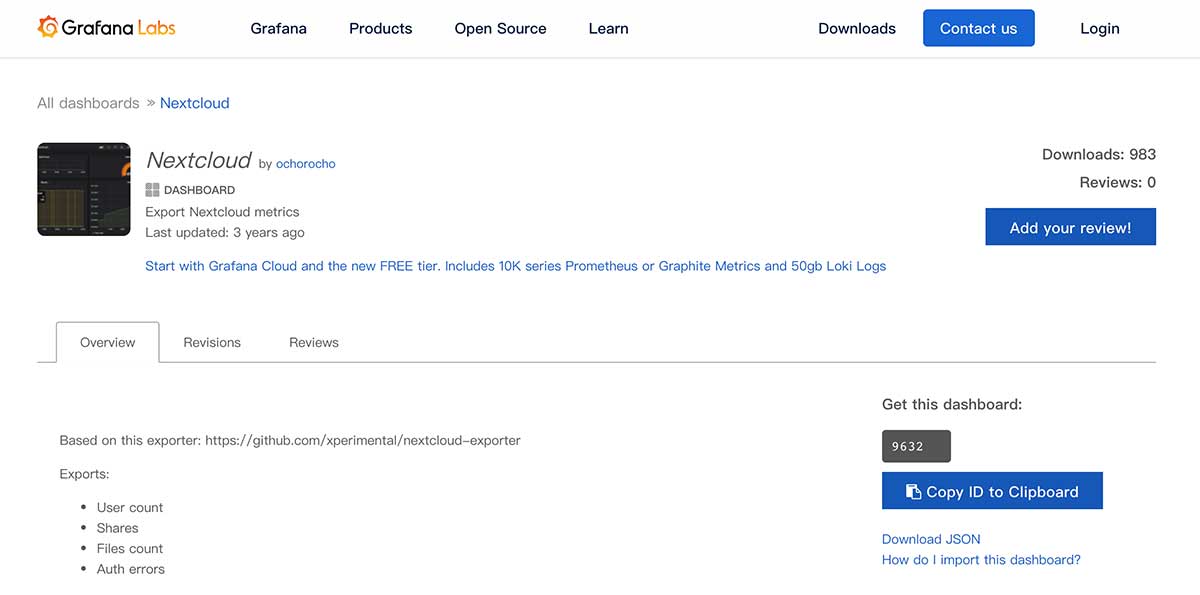
Or refer to the " Grafana Control Panel Import "Way, import the panel number"9632"into Grafana, and you will see a panel interface similar to the one below.
Last
When writing this series of "Private Cloud Environments Installed in Notebooks", the number of words (including code) in the article will exceed the maximum number of words allowed on various platforms, so this article must be split up.
So far, we have almost completed the entire storage service and monitoring configuration. In the next article, I will continue to talk about "Data Backup" and the building and use of typical network storage applications mentioned in the previous article.
–EOF
We have a small group of twists and turns with hundreds of little partners who like to twist.
Without advertising, we will chat about hardware and software, HomeLab, programming and other issues, and also share some technical salon information in the group at irregular intervals.
Enjoy tossing buddies welcome to add friends. (Add a friend, please note the real name, indicate the source and purpose, otherwise it will not pass the audit)
About tossing around in groups
If you find the content useful, you are welcome to share it with your friends. Thank you here.
This article uses the "Signature 4.0 International (CC BY 4.0)" license agreement and welcomes reprinting, or re-modifying the use, provided the source is indicated. Signature 4.0 International (CC BY 4.0)
Author of this article: Suyang
Created: 09 November 2021
Statistics word count: 15042 words
Reading time: 31 minutes
Links to this article: https://soulteary.com/2021/11/09/private-cloud-environment-installed-in-a-notebook-storage-part-2.html