1 ps/top [[monitor progress]
ps -ef
Display information:
F S UID PID PPID C PRI NI ADDR SZ WCHAN TTY TIME CMD
0 S 500 3081 3080 0 80 0 - 1173 wait pts/0 00:00:00 bash
0 R 500 4463 3081 1 80 0 - 1116 - pts/0 00:00:00 ps
Parameter meaning:
- UID: the user who started these processes.
- PID: process ID of the process.
- PPID: the process number of the parent process (if the process was started by another process).
- C: CPU utilization in the process lifecycle.
- STIME: system time when the process starts.
- TTY: terminal device when the process starts.
- TIME: the cumulative CPU TIME required to run the process.
- CMD: name of the program started.
Disadvantages: Although ps command is very useful in collecting process information running on the system, it also has disadvantages: it can only display information at a specific point in time.
The top instruction displays process information in real time.
By default, the top command sorts the processes according to the% CPU value at startup. You can use a variety of interactive commands to reorder when top is running.
Each interactive command is a single character. When the top command is running, you can change the behavior of top by typing:
- Type f to allow you to select the fields to sort the output,
- Typing d allows you to modify the polling interval.
- Type q to exit top.
The displayed information is as follows [the number of CPUs viewed by top under Linux is also the number of logical CPUs]:
[root@hdp-jiangxue ~]# top
top - 10:19:36 up 94 days, 20:09,  1 user,  load average: 0.00, 0.01, 0.05
Tasks: 209 total,   1 running, 208 sleeping,   0 stopped,   0 zombie
%Cpu(s):  0.4 us,  0.4 sy,  0.0 ni, 99.2 id,  0.0 wa,  0.0 hi,  0.0 si,  0.0 st
KiB Mem : 16378664 total,   343132 free, 14923576 used,  1111956 buff/cache
KiB Swap:  2097148 total,   123496 free,  1973652 used.   985392 avail Mem

   PID USER      PR  NI    VIRT    RES    SHR S  %CPU %MEM     TIME+ COMMAND
 27241 root      20   0 2214808 364292   5464 S   1.0  2.2 748:41.35 java
 18381 root      20   0 3102436 207996   2528 S   0.7  1.3 842:56.06 java
 21171 root      20   0 2893492 352456   6956 S   0.7  2.2   1283:11 java
   517 root      20   0       0      0      0 S   0.3  0.0  56:58.31 xfsaild/dm-0
  2314 root      20   0 4780608 259256   6612 S   0.3  1.6  87:29.34 java
  9856 root      20   0 3907688  93924   1872 S   0.3  0.6 219:10.73 java
 21321 root      20   0 2886176 561516   6852 S   0.3  3.4 966:31.66 java
 21828 root      20   0 2928204 257340   6484 S   0.3  1.6 237:24.95 java
 29601 root      20   0 2156112 149960   5004 S   0.3  0.9 145:42.31 java
 56051 root      20   0 6771692  71376   1632 S   0.3  0.4 118:23.42 java
 93840 root      20   0       0      0      0 S   0.3  0.0   0:00.23 kworker/0:2
 94489 root      20   0  162112   2376   1596 R   0.3  0.0   0:02.43 top
115277 zabbix    20   0   79244   2128   1096 S   0.3  0.0  22:55.17 zabbix_agentd
     1 root      20   0  134760   3516   1396 S   0.0  0.0  41:39.13 systemd
     2 root      20   0       0      0      0 S   0.0  0.0   0:10.29 kthreadd
     4 root       0 -20       0      0      0 S   0.0  0.0   0:00.00 kworker/0:0H
     6 root      20   0       0      0      0 S   0.0  0.0  42:22.97 ksoftirqd/0
     7 root      rt   0       0      0      0 S   0.0  0.0   0:14.37 migration/0
     8 root      20   0       0      0      0 S   0.0  0.0   0:00.00 rcu_bh
The detailed explanation is as follows:
top - 10:12:34 up 94 days, 20:02, 1 user, load average: 0.00, 0.01, 0.0
The first line shows the current time, the running time of the system, the number of logged in users and the average load of the system. [the average load has three values: the average load in the last 1 minute, the average load in the last 5 minutes and the average load in the last 15 minutes.]
⚠️: The higher the value, the higher the system load. Due to the short-term sudden activity of the process, it is also common to have a high load value in the last minute, but if the average load in the last 15 minutes is very high, it indicates that there may be a problem with the system. [high load depends on the hardware configuration of the system and the programs normally running on the system. Generally, if the load value of the system exceeds 2, it indicates that the system is busy.]
Tasks: 210 total, 3 running, 207 sleeping, 0 stopped, 0 zombie
The second line shows the process profile - the process is called a task in the output of the top command: how many processes are in the running, sleeping, stopping or rigid state (rigid state means that the process has completed but the parent process has not responded).
%Cpu(s): 0.5 us, 0.4 sy, 0.0 ni, 99.1 id, 0.0 wa, 0.0 hi, 0.0 si, 0.0 st
The third line shows the summary information of the CPU. top divides the CPU utilization into several types of output according to the owner of the process (user or system) and the state of the process (running, idle or waiting).
KiB Mem : 16378664 total,   343180 free, 14923536 used,  1111948 buff/cache
KiB Swap:  2097148 total,   123496 free,  1973652 used.   985432 avail Mem
In case of multi-core computing, the average value of all CPUs is displayed. Press the number "1" to monitor the status of each logical CPU.
%Cpu0  :  0.3 us,  0.0 sy,  0.0 ni, 99.7 id,  0.0 wa,  0.0 hi,  0.0 si,  0.0 st
%Cpu1  :  0.7 us,  1.0 sy,  0.0 ni, 98.3 id,  0.0 wa,  0.0 hi,  0.0 si,  0.0 st
%Cpu2  :  0.7 us,  0.7 sy,  0.0 ni, 98.7 id,  0.0 wa,  0.0 hi,  0.0 si,  0.0 st
%Cpu3  :  0.0 us,  0.0 sy,  0.0 ni,100.0 id,  0.0 wa,  0.0 hi,  0.0 si,  0.0 st
The fourth and fifth lines describe the status of the system memory. The first line describes the physical memory of the system: how much memory is in total, how much is currently used, and how much is free. The last line describes the same information, but for the status of the system exchange space (if allocated).
   PID USER      PR  NI    VIRT    RES    SHR S  %CPU %MEM     TIME+ COMMAND
 18381 root      20   0 3102436 207996   2528 S   1.0  1.3 842:57.20 java
 27241 root      20   0 2214808 364292   5464 S   1.0  2.2 748:42.71 java
The following lines show a detailed list of currently running processes, some of which are similar to the output of the ps command.
- PID: ID of the process.
- USER: the name of the process owner.
- PR: priority of the process.
- NI: humility value of the process.
- VIRT: the total amount of virtual memory occupied by the process.
- RES: the total amount of physical memory occupied by the process.
- SHR: the total amount of memory shared by the process and other processes.
- S: Process status (D represents interruptible sleep status, R represents running status, s represents sleep status, T represents
Tracking state or stop state, Z stands for rigid state). - %CPU: the percentage of CPU time used by the process.
- %MEM: the proportion of memory used by the process in available memory.
- TIME +: the total amount of CPU TIME since the process was started.
- COMMAND: the COMMAND line name corresponding to the process, that is, the name of the program started.
1.1 Intel hyper threading technology [Simulate MultiThreading (SMT)]
The number of chipsets that can process data on a CPU, such as the i5 760, is a dual core four thread CPU. Generally speaking, the number of physical CPUs × Each core should be equal to the number of logical CPUs. If it is not equal, it means that the server's CPU supports hyper threading technology. [a CPU can have multiple cores, plus intel's hyper threading technology (ht), it can be logically divided into twice the number of CPU cores. The number of logical CPUs = the number of physical CPUs x the specification value of CPU cores x 2 (if HT is supported and enabled)]
View CPU information:
[1] Check the CPU model: the CPU model is E7-4820
[root@node1 ~]# cat /proc/cpuinfo | grep name | cut -f2 -d: | uniq -c
    32  Intel(R) Xeon(R) CPU E7- 4820  @ 2.00GHz
[2] View the number of physical CPUs: the number of physical cores is 2
[root@node1 ~]# cat /proc/cpuinfo | grep "physical id" | sort | uniq|wc -l
2
[3] View the number of logical CPUs: the number of logical CPUs is 32
[root@node1 ~]# cat /proc/cpuinfo | grep "processor" |wc -l
32
[4] Check how many cores the cpu is: the cpu is 8 cores
[root@node1 ~]# cat /proc/cpuinfo | grep "cores"|uniq
cpu cores       : 8
Intel hyper threading technology [Simulate MultiThreading (SMT):
Hyper threading is a technology developed by Intel, which enables a single processor to run like two logical processors, so that a single processor can execute threads in parallel.
A thread will occupy CPU resources during execution. If other threads want to be executed, they must wait for the thread to give up CPU resources.
Using hyper threading technology, the simulated two logical cores share the same CPU resources, so two threads can occupy CPU resources at the same time, so both threads can be executed, which is to realize the parallel operation of two threads at the same time.
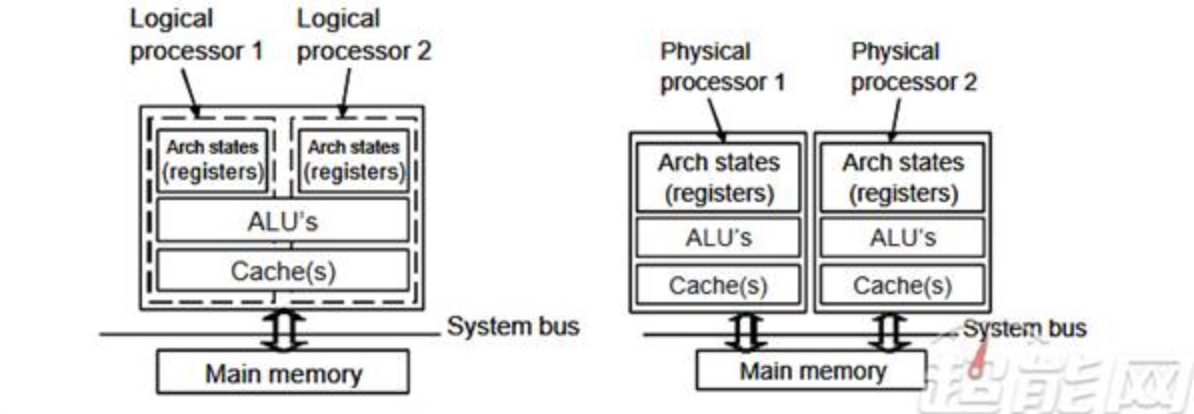
For a single processor core, although it can process thousands of instructions per second, it can only process one instruction (single thread) at a certain time. Hyper threading technology can turn a physical processor into two logical processors in the software layer, which can enable the processor to process more instructions and data (multiple threads) synchronously and in parallel at a certain time Hyper threading is a technology that can fully "mobilize" the temporarily idle processing resources inside the CPU.
2 kill/kill all
linux common signals:
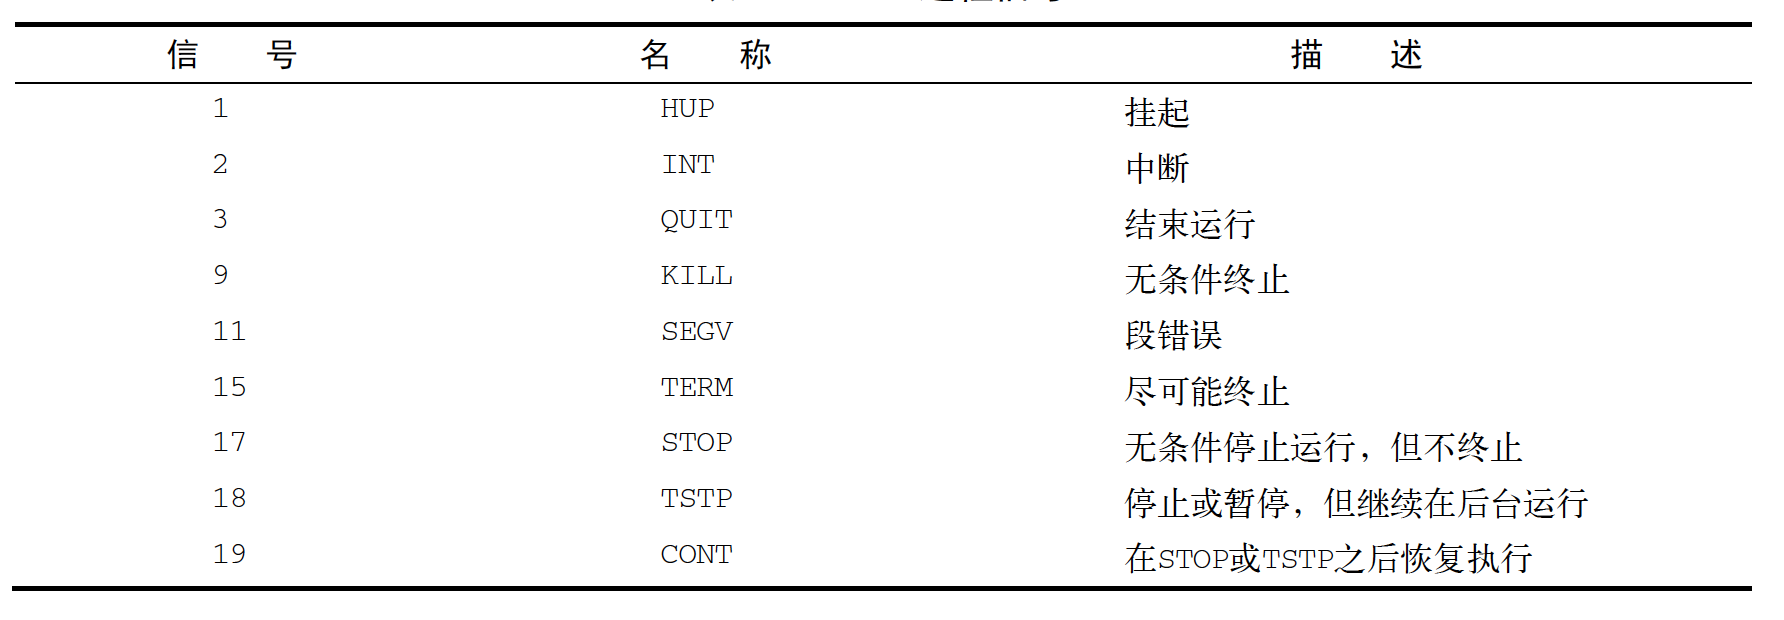
The kill command signals a process through the process ID (PID). By default, the Kill Command sends a TERM signal to all PIDs listed on the command line.
To send a process signal, you must be the owner of the process or log in as root user.
$ kill 3940
The Kill Command supports ending a process by a process name instead of a PID. The kill command also supports wildcards.
killall http*
3 monitor disk space
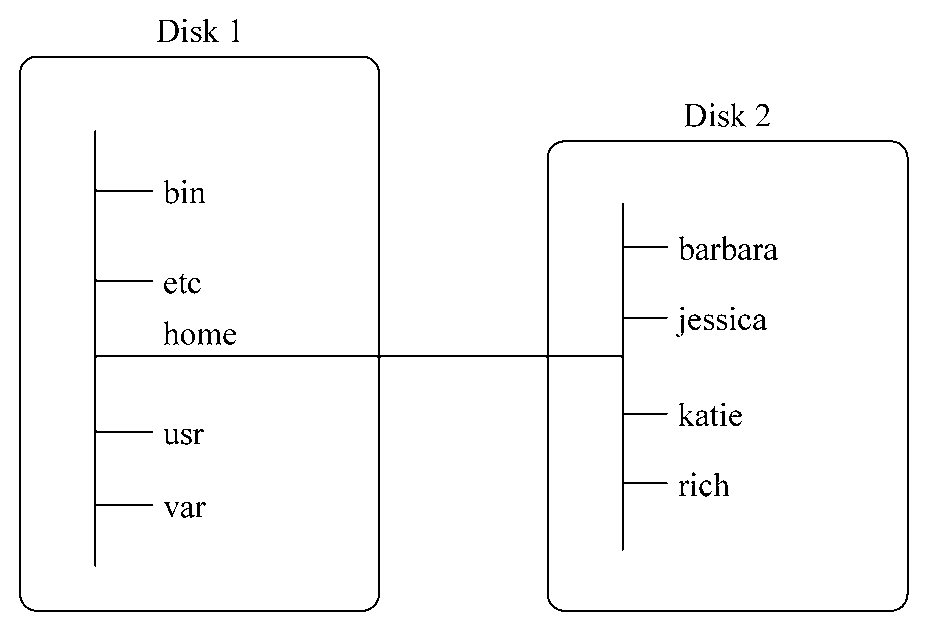
The more complex part of the Linux virtual directory is how it coordinates and manages various storage devices. The first hard disk installed on the Linux PC is called the root drive. The root drive contains the core of the virtual directory, and other directories are built from there.
Typically, system files are stored on the root drive and user files are stored on another drive.
Linux will create some special directories on the root drive, which we call mount points. A mount point is a directory in a virtual directory that is used to allocate additional storage devices. Virtual directories make files and directories appear in these mount point directories, but they are actually stored on another drive.
3.1 mount
mounting: before using the new storage media, you need to put it in the virtual directory.
Most Linux distributions automatically mount certain types of removable storage media. [removable storage media refers to media that can be easily removed from the PC, such as CD-ROM, floppy disk and U SB flash disk.] if it is not supported, it needs to be completed manually.
The mount command provides the following four parts of information:
- Device file name of the media
- Mount the media to the mount point of the virtual directory
- file system type
- Access status of mounted media
Common file system types:
- vfat: Windows long file system.
- ntfs: advanced file system widely used in Windows NT, XP, Vista and Windows 7.
- iso9660: Standard CD-ROM file system.
Note: most U SB flash drives and floppy disks will be formatted into vfat file system. The data CD must use the iso9660 file system type.
Manually mount U SB flash disk / dev/sdb1 [location of device file of storage device] to / media/disk [location of mount point in virtual directory].
# mount -t type device directory
mount -t vfat /dev/sdb1 /media/disk
After the media device is mounted to the virtual directory, the root user has all access rights to the device, while the access of other users will be restricted.
3.2 removal
When a removable device is removed from the system, it cannot be removed directly from the system, but should be uninstalled first.
The command to unload the device is umount. The format of umount command is:
umount [directory | device ]
Example:
umount /home/rich/mnt
be careful:
- If any program is using a file on the device, the system will not allow you to uninstall it.
- When uninstalling the device, the system prompts that the device is busy and cannot be uninstalled. Usually, a process is still accessing the device or using the files on the device. At this time, the lsof command can be used to obtain the process information using it, and then stop using the device or stopping the process in the application. The use of the lsof command is simple
Single: lsof /path/to/device/node
3.3 df [ view disk space ]
Check how much disk space is left on a device [. The output value of the df command displays the current value considered by the Linux system. It is possible that a running process on the system has created or deleted a file but has not released the file. This value will not be included in the idle space.]:
df
Display content:
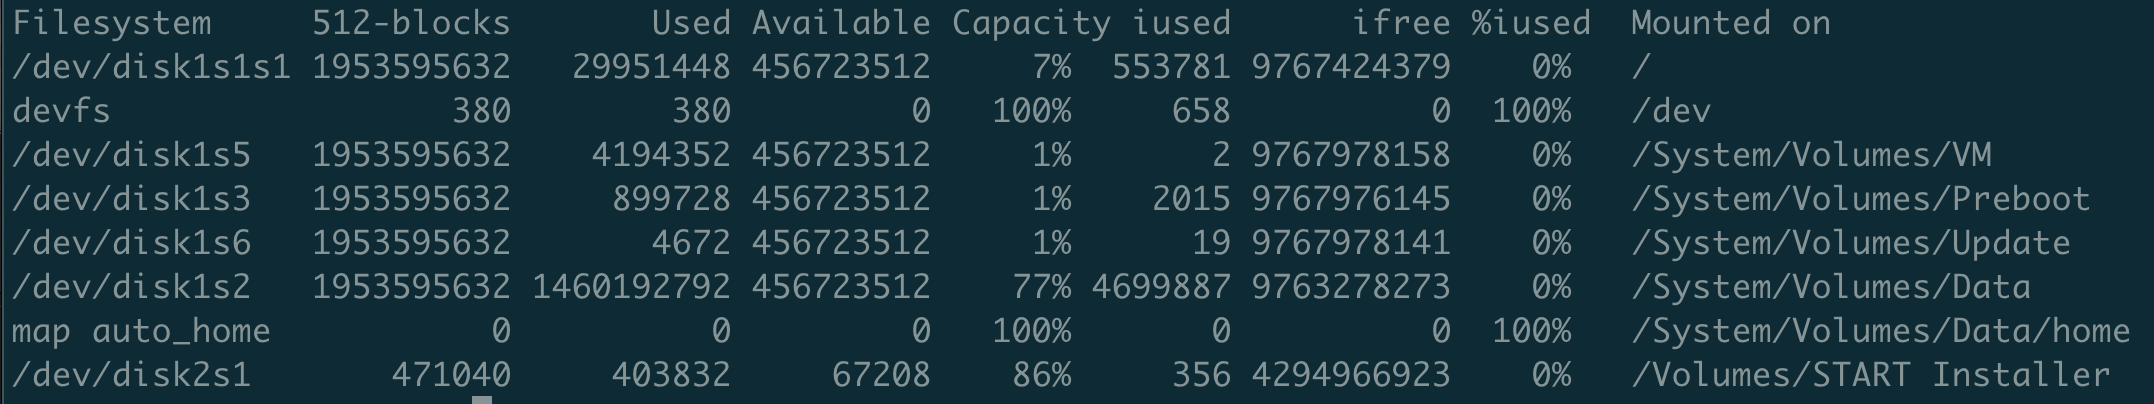
The output information is:
- Equipment file location of the equipment;
- How many 1024 byte blocks can be accommodated;
- How many 1024 byte blocks have been used;
- How many 1024 byte blocks are available;
- Proportion of used space;
- Which mount point the device is mounted on.
More concise display [display the disk space in the output in a user-friendly form, usually M instead of megabytes and G instead of gigabytes]:
df -h
Display content:
3.4 du [ to display the disk usage of a specific directory (the current directory by default ]
du -sh * | sort -nr
- Redirect the output of du command to sort command;
- sort:
- -N -- numeric sort sorts by string values (not converted to floating-point numbers)
- -r --reverse reverse sort (ascending to descending)
- du:
- -s: Displays the total for each output parameter.
- -h: Output the size in a user-friendly format, that is, K instead of kilobytes, M instead of megabytes, and G instead of gigabytes.