concept
Alert rules allow you to define alert conditions based on Prometheus expression language expressions and send notifications about triggering alerts to external services. Whenever an alarm expression produces one or more vector elements at a given point in time, the alarm counts as active for the tag set of these elements.
Similar to the recording rule, the alerting rule is also defined in a separate file, and then Prometheus sets it in the rule_ The files configuration section is loaded as follows
Alarm Rule Template address: https://awesome-prometheus-alerts.grep.to/rules.html#host-and-hardware
rule_files:
  - recording_rules/*.yaml
  - alerting_rules/*.yml          # Alarm rule file path
Trigger alarm
Alarm rules
Alarm rules are configured in Prometheus in the same way as Record rules Same.
Index meaning
| Options | meaning |
| groups | Configure the top level, which is used to define a monitoring group |
| - name | Rule name |
| rules | rule |
| - alert | Name of the alarm rule. |
| expr | The expression is based on the PromQL expression alarm trigger condition and is used to calculate whether a time series meets the condition. |
| for | Evaluate the waiting time. When waiting, the status is pending, the alarm status is firing, and the recovery status is inactive |
| labels | Custom label |
| annotations |
It is used to specify a set of additional information, such as the text used to describe the alarm details. The contents of annotations will be sent to the Alertmanager as parameters when the alarm is generated. Summary describes the summary information of the alarm, and description describes the details of the alarm. At the same time, the UI of Alertmanager will also display alarm information according to these two tag values. |
Instance rule
groups:
- name: Allinstances     # Group name
  rules:
  - alert: instanceDown  # Rule name
    expr: up == 0        # Matching rule instance downtime promQl expression
    for: 10s             # Detection duration
    annotations:         # The alarm itself is also a time series annotation
      title: "instance down" # Alarm title
      description: 'Instance has been down for more than 1 minute.' # Alarm details
    labels:              # new label
      serverity: "critical"
      group_by: "node"

  - alert: Insufficient host memory
    expr: node_memory_MemAvailable_bytes / node_memory_MemTotal_bytes * 100 < 99
    for: 10s
    labels:
      severity: "critical"
    annotations:
      summary: Insufficient host memory (Host address {{ $labels.instance }})
      description: "The host memory is full (< 10% left)\n  VALUE = {{ $value }}\n  LABELS = {{ $labels }}"
Alarm template
- Alarm template refers to the method of quoting the label and sample value of time series on the label and annotation in the alarm;
- It uses standard Go syntax and exposes some variables containing time tags and values;
-
- Label reference: {{$label. < label_name >}}
- Index sample value reference: {{$value}}
To reference the values of the instance and job tags on the time series that triggered the alarm in the description annotation, "{{$label.instance}}" and "{{$label.job}}" can be used respectively;
Example
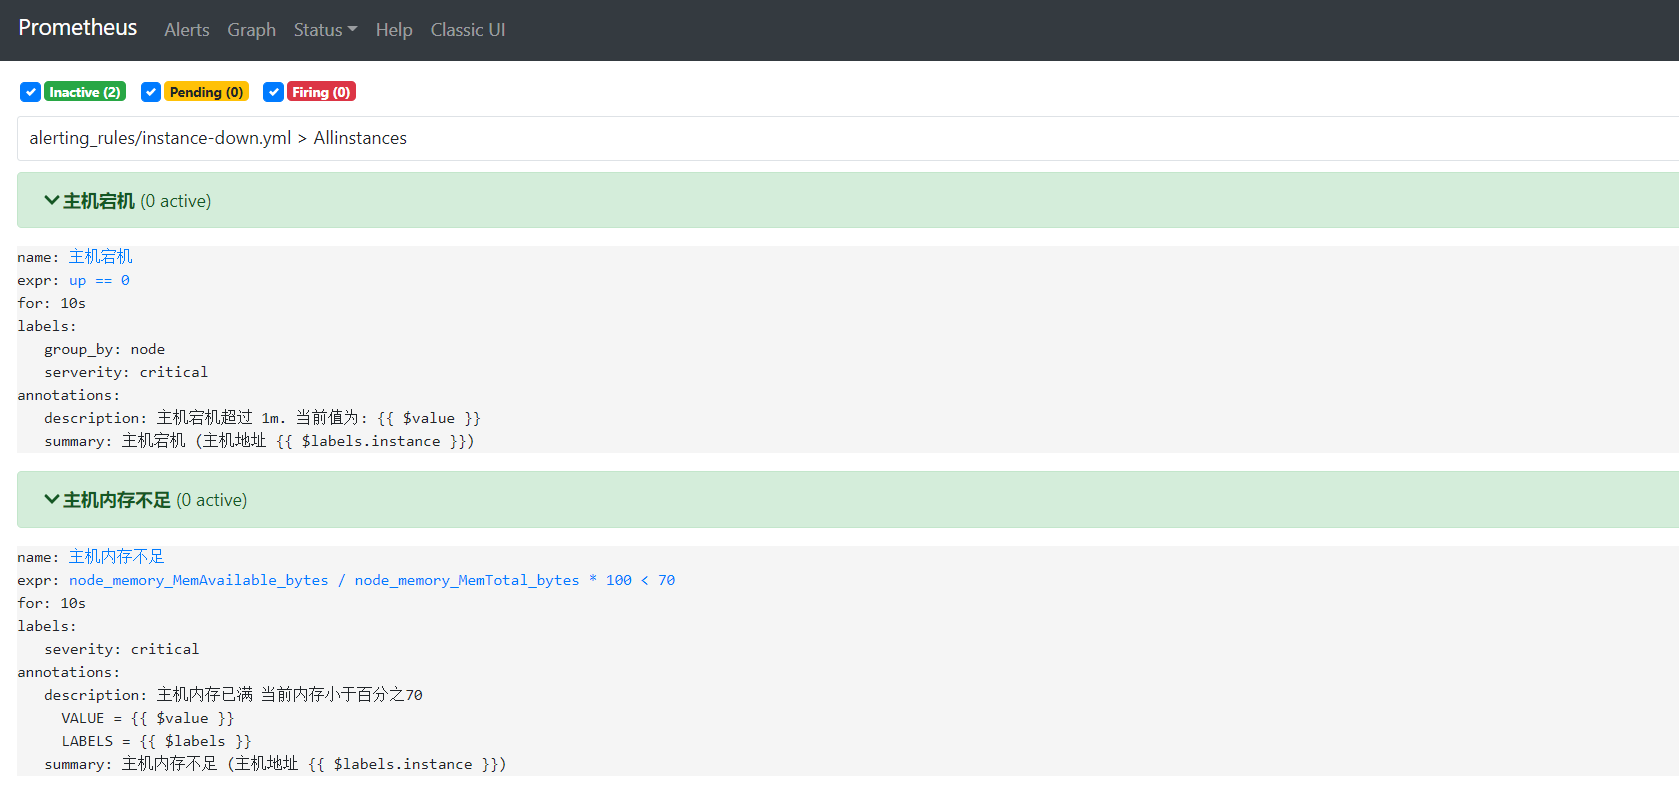
[root@ops prometheus]# cat alerting_rules/instance-down.yml
groups:
- name: Allinstances     # Group name
  rules:
  - alert: instanceDown  # Rule name
    expr: up == 0        # Matching rule instance downtime promQl expression
    for: 10s             # Detection duration
    annotations:         # The alarm itself is also a time series annotation
      summary: Host downtime (Host address {{ $labels.instance }})
      description: 'Instance downtime exceeds 1 m. Current value is: {{ $value }}' # Alarm details
    labels:              # new label
      serverity: "critical"
Prometheus page check configuration