introduction
-
Prometheus' ability to collect and store indicators belongs to two independent components, Prometheus Server and alertmanager (general component). The former is only responsible for generating alarm notifications based on "alarm rules", and the specific alarm operations are completed by the latter.
-
Alertmanager is responsible for handling the alarm notification sent by the client. The client is usually Prometheus server, but it also supports receiving alarms from other tools.
-
After grouping and de duplication of alarm notifications, Alertmanager routes them to different receiver s according to routing rules, such as Email, SMS or PagerDuty.
-
At present, Alertmanager does not support nailing, so users can integrate with nailing robot through Webhook to receive alarm information through nailing.
-
AltManager also provides silence and alarm suppression mechanisms to optimize alarm notification behavior.
PS: webhook is an APR concept. Webhook is a web callback or http push APT. Webhook is a lightweight event processing application.
1, Definition
1. Overview of alarm function
-
prometheus' ability to collect, store and alarm indicators belongs to Prometheus server and alertmanager. Pro server is only responsible for generating alarm notifications through "alarm rules". The specific alarm operations are completed by alertmanager.
-
The alarm rule is a Boolean expression written by PromQL. It uses > < = to compare with a common quantity value, such as 80%, and its return value is true or false.
-
If Prometheus server matches the captured index sequence with Prometheus used for comparison in the alarm rules, it will capture the sample value for comparison. If the return value is true, it is considered that the index is abnormal and cannot meet false, it is normal. The above expression is the expression of the alarm rules.
For example, the system is abnormal when the cpu utilization of an indicator data is less than 0%
2. Notify alarm information
once the condition expression is true, the notification information will be triggered and sent to the altermanager. The alter will send this information with the help of the API or access portal of a specific service, which is generally referred to as the alarm medium, or with the help of e-mail (SMTP).
3. Alarm logic of Prometheus monitoring system
-
Route: alarm route, which distributes alarm messages to different channels by grouping and classification.
-
prometheus generates an alarm notification to the altermanager through the alter rule. The altermanager will generate a local alarm routing table (the first route is called the root route by default, and all alarm information needs a root route. If there is no matching item, a default route needs to be set) to send specific information to specific users.
For example:
According to the message level: serious, medium, normal, red alarm, blue alarm, application sender
Grouped by: business operation and maintenance, system operation and maintenance, infrastructure operation and maintenance, k8s operation and maintenance
3.1 alarm function
In addition to the basic alarm notification capability, Altermanager also supports de duplication, grouping and suppression of alarms.
3.2 functions such as silence, suppression and grouping
Grouping: the mechanism of combining similar alarms into a single alarm notification. When the alarm tide is triggered due to a large area of system failure, the grouping mechanism can prevent users from being submerged by a large number of alarm noise, resulting in the concealment of key information.
Inhibition: after an alarm notification is triggered due to a component or service failure in the system, other components or services that depend on the component or service may also trigger an alarm. Inhibition is a feature to avoid similar cascading alarms, so that users can focus on the real fault.
Silence: refers to the behavior that the Alertmanager will not really send alarm information to the user even if the alarm notification is received within a specific time window; Generally, during routine maintenance of the system, it is necessary to activate the silence feature of the alarm system.
Route: used to configure how Alertmanager handles incoming specific types of alarm notifications. Its basic logic is to determine the path and behavior of processing current alarm notifications according to the matching results of route matching rules.
2, Deploy alarm docking mailbox
192.168.10.20
Define alarm rules on the Prometheus server side, specify the location of alertmanager, and send alarm information to alert for processing
1. Download the installation package
wget http://101.34.22.188/prometheus/alertmanager-0.21.0.linux-amd64.tar.gz
tar zxvf alertmanager-0.21.0.linux-amd64.tar.gz -C /usr/local/
ln -s /usr/local/alertmanager-0.21.0.linux-amd64/ /usr/local/alertmanager
- Profile resolution
cat /usr/local/alertmanager/alertmanager.yml
global:													#Global parameters
  resolve_timeout: 5m

route:													#Routing information
  group_by: ['alertname']								#grouping
  group_wait: 30s		 								#Packet buffer / wait time
  group_interval: 5m	 								#Regrouping time
  repeat_interval: 1h	 								#Re alarm interval
  receiver: 'web.hook'	 								#Receiver / media
receivers:
- name: 'web.hook'
  webhook_configs:
  - url: 'http://127.0. 0.1:5001/' 						# Label 5001 port
inhibit_rules:											#Strategies for suppressing rules
  - source_match:										#Matches
      severity: 'critical'								#Severity level
    target_match:
      severity: 'warning'								#target matches warning level
    equal: ['alertname', 'dev', 'instance']				#Comply with alertname, dev and instance
2. Modify the configuration file
cd /usr/local/alertmanager
cp alertmanager.yml alertmanager.yml.bak
--------------------------------------
vim alertmanager.yml

global:
  resolve_timeout: 5m
  smtp_from: 1520509800@qq.com
  smtp_auth_username: 1520509800@qq.com
  smtp_auth_password: usgqaitngslihfch
  smtp_require_tls: false
  smtp_smarthost: 'smtp.qq.com:465'

route:
  group_by: ['alertname']
  group_wait: 10s
  group_interval: 10s
  repeat_interval: 1h
  receiver: 'email-test'
receivers:
- name: 'email-test'
  email_configs:
  - to: 1520509800@qq.com
    send_resolved: true
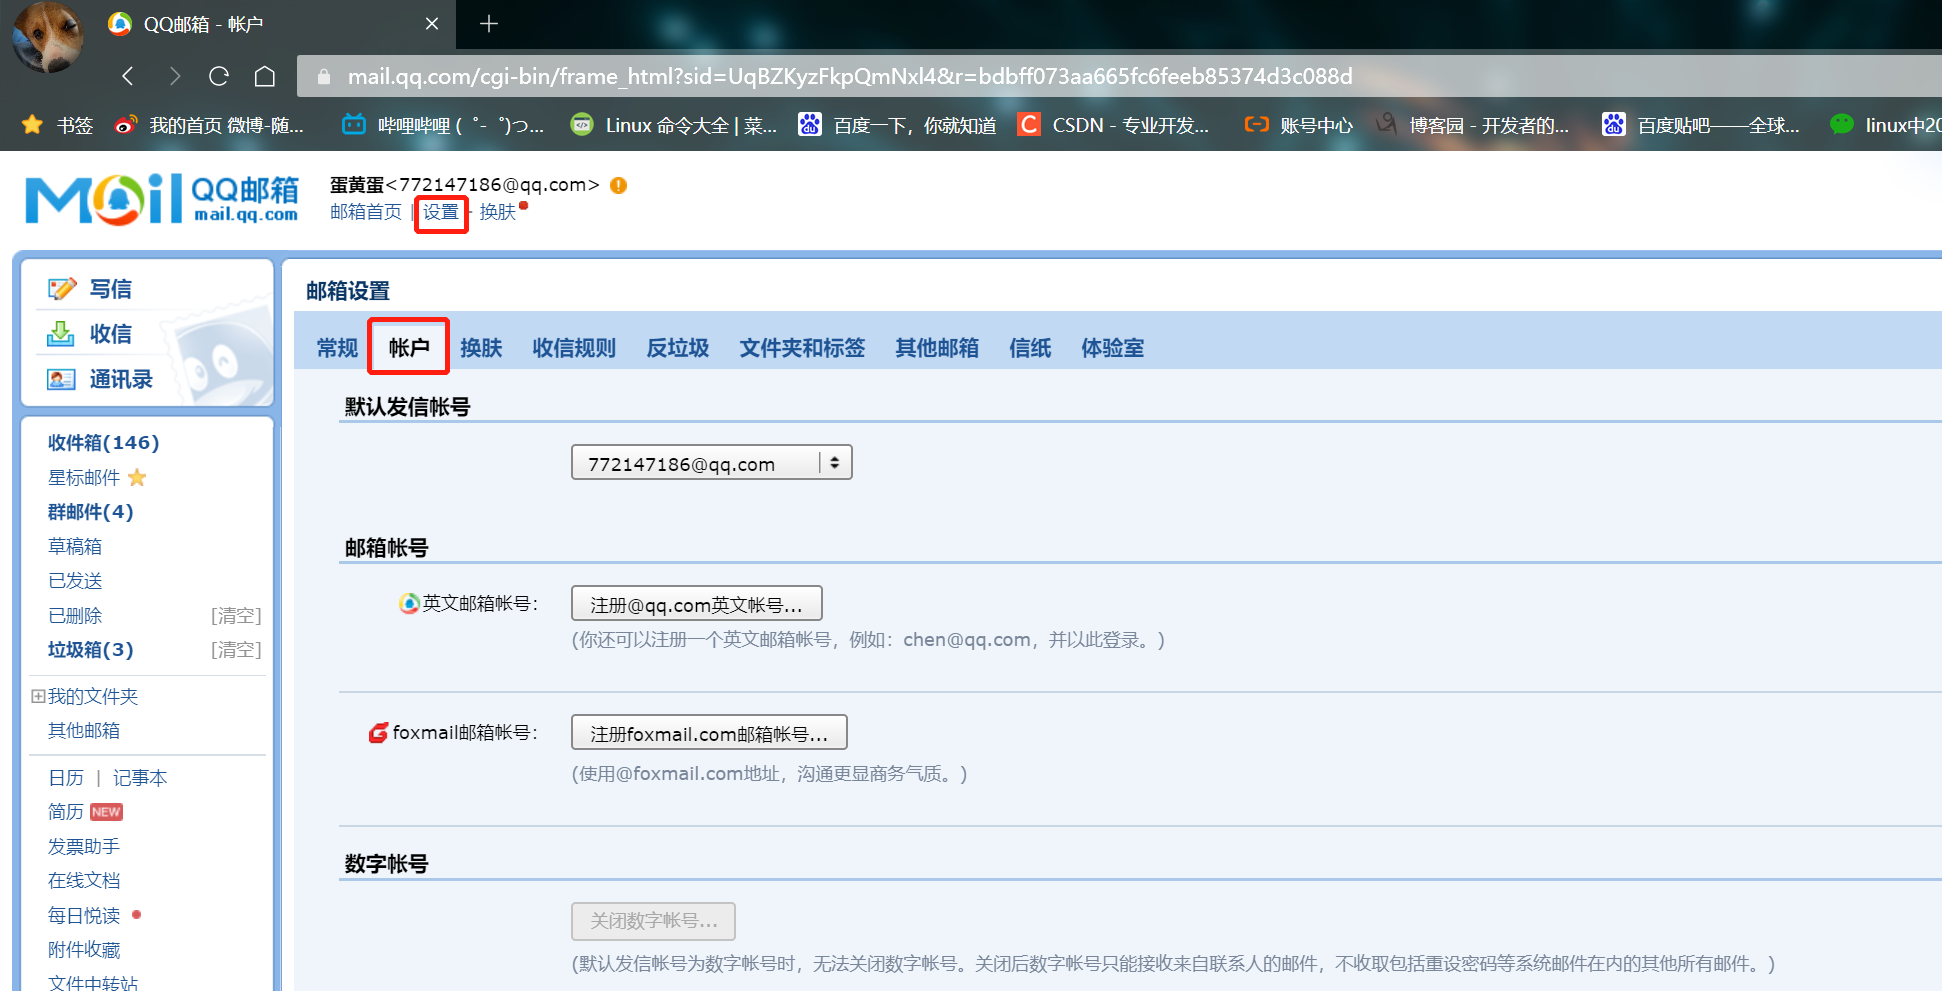
3. Configure the bound mailbox
Login mailbox - > Settings - > account - > POP3 / imao / SMTP / exchange / carddva / - > Enable

4. Start alertmanager
cd /usr/local/alertmanager/
./alertmanager
- configuration file
#Note the location of prometheus
cd /usr/local/prometheus-2.27.1.linux-amd64/
mkdir alert-config
cd alert-config/
mkdir alert_rules targets
cd alert_rules/
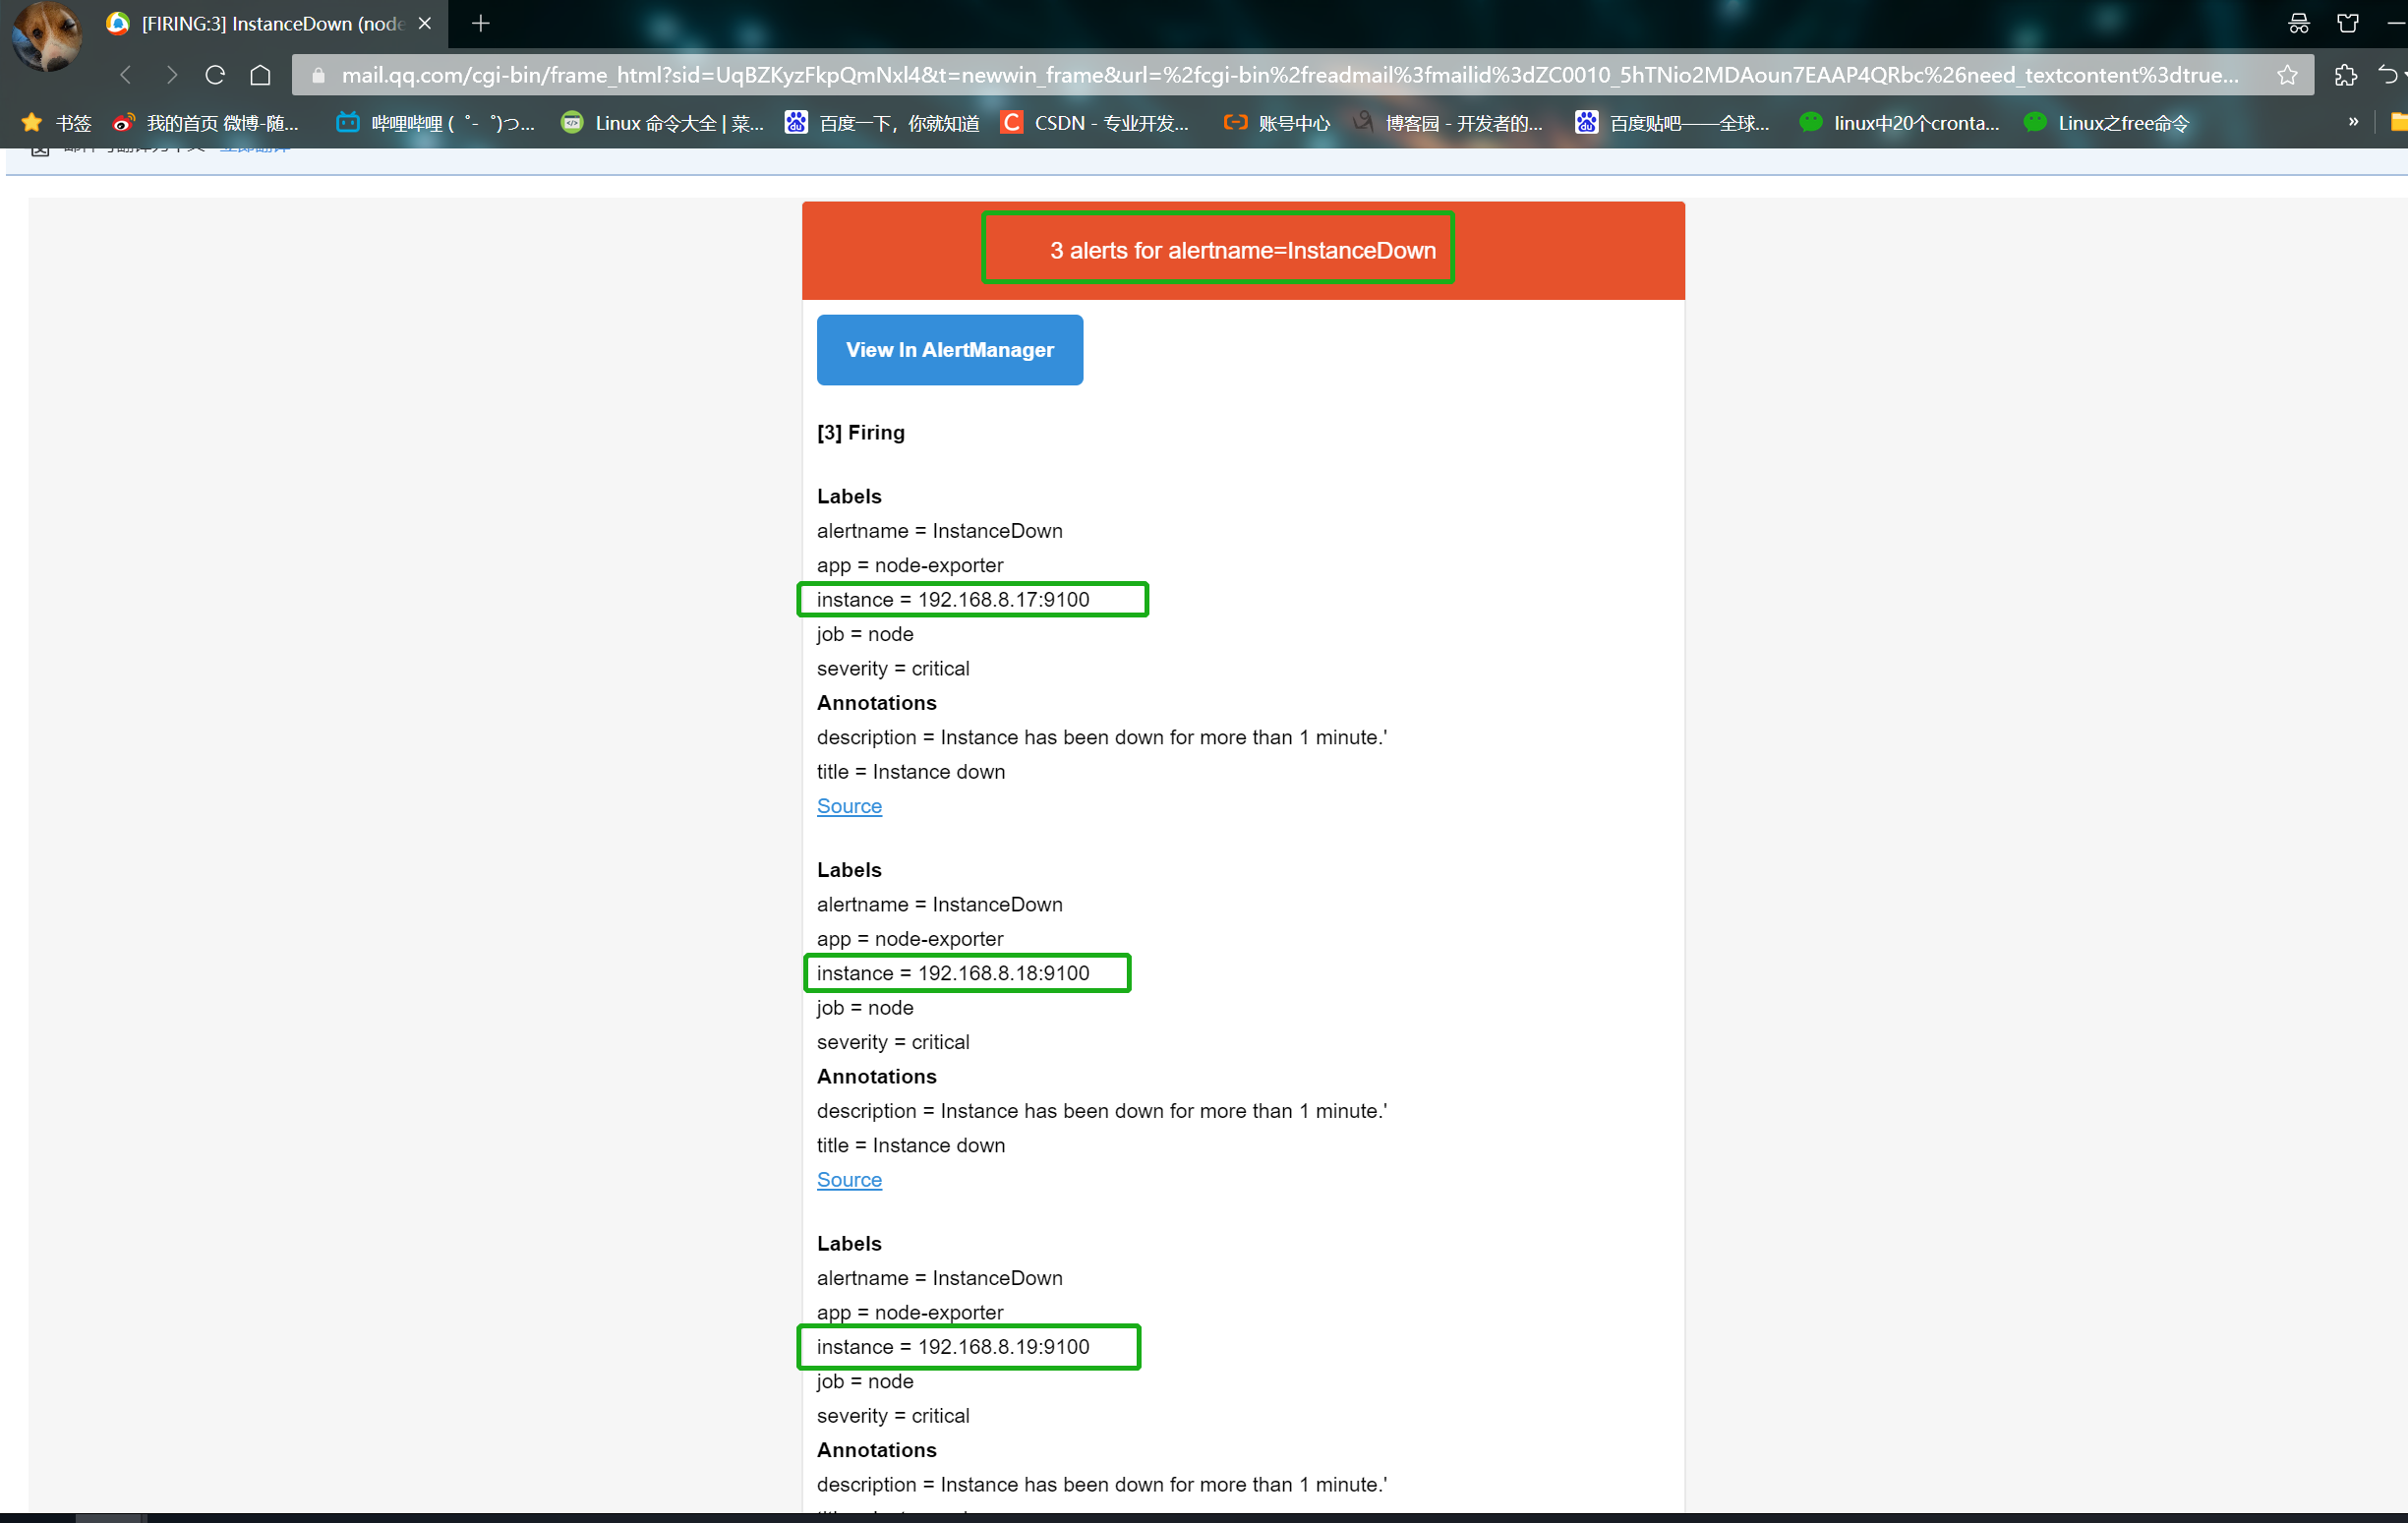
vim instance_down.yaml #The message will be received
groups:
- name: AllInstances
rules:
- alert: InstanceDown
Condition for alerting
expr: up == 0
for: 1m
Annotation - additional informational labels to store more information
annotations:
title: 'Instance down'
description: Instance has been down for more than 1 minute.'
Labels - additional labels to be attached to the alert
labels:
severity: 'critical'
cd ..
cd targets/
vim alertmanagers.yaml

- targets:
  - 192.168.10.20:9093
  labels:
    app: alertmanager
----------------------------------------------------------------------------------------------
vim nodes-linux.yaml

- targets:
  - 192.168.10.30:9100
  - 192.168.10.40:9100
  - 192.168.10.50:9100
  labels:
    app: node-exporter
    job: node
--------------------------------------------------------------------------------------------
vim prometheus-servers.yaml

- targets:
  - 192.168.10.20:9090
  labels:
    app: prometheus
    job: prometheus
- prometheus startup file
vim /usr/local/alert-config/prometheus.yml

# my global config
# Author: MageEdu <mage@magedu.com>
# Repo: http://gitlab.magedu.com/MageEdu/prometheus-configs/
global:
  scrape_interval:     15s # Set the scrape interval to every 15 seconds. Default is every 1 minute.
  evaluation_interval: 15s # Evaluate rules every 15 seconds. The default is every 1 minute.
  # scrape_timeout is set to the global default (10s).

# Alertmanager configuration
alerting:
  alertmanagers:
  - file_sd_configs:
    - files:
      - "targets/alertmanagers*.yaml"

# Load rules once and periodically evaluate them according to the global 'evaluation_interval'.
rule_files:
  - "rules/*.yaml"
  - "alert_rules/*.yaml"

# A scrape configuration containing exactly one endpoint to scrape:
# Here it's Prometheus itself.
scrape_configs:
  # The job name is added as a label `job=<job_name>` to any timeseries scraped from this config.
  - job_name: 'prometheus'
    # metrics_path defaults to '/metrics'
    # scheme defaults to 'http'.
    file_sd_configs:
    - files:
      - targets/prometheus-*.yaml
      refresh_interval: 2m

  # All nodes
  - job_name: 'nodes'
    file_sd_configs:
    - files:
      - targets/nodes-*.yaml
      refresh_interval: 2m

  - job_name: 'alertmanagers'
    file_sd_configs:
    - files:
      - targets/alertmanagers*.yaml
      refresh_interval: 2m
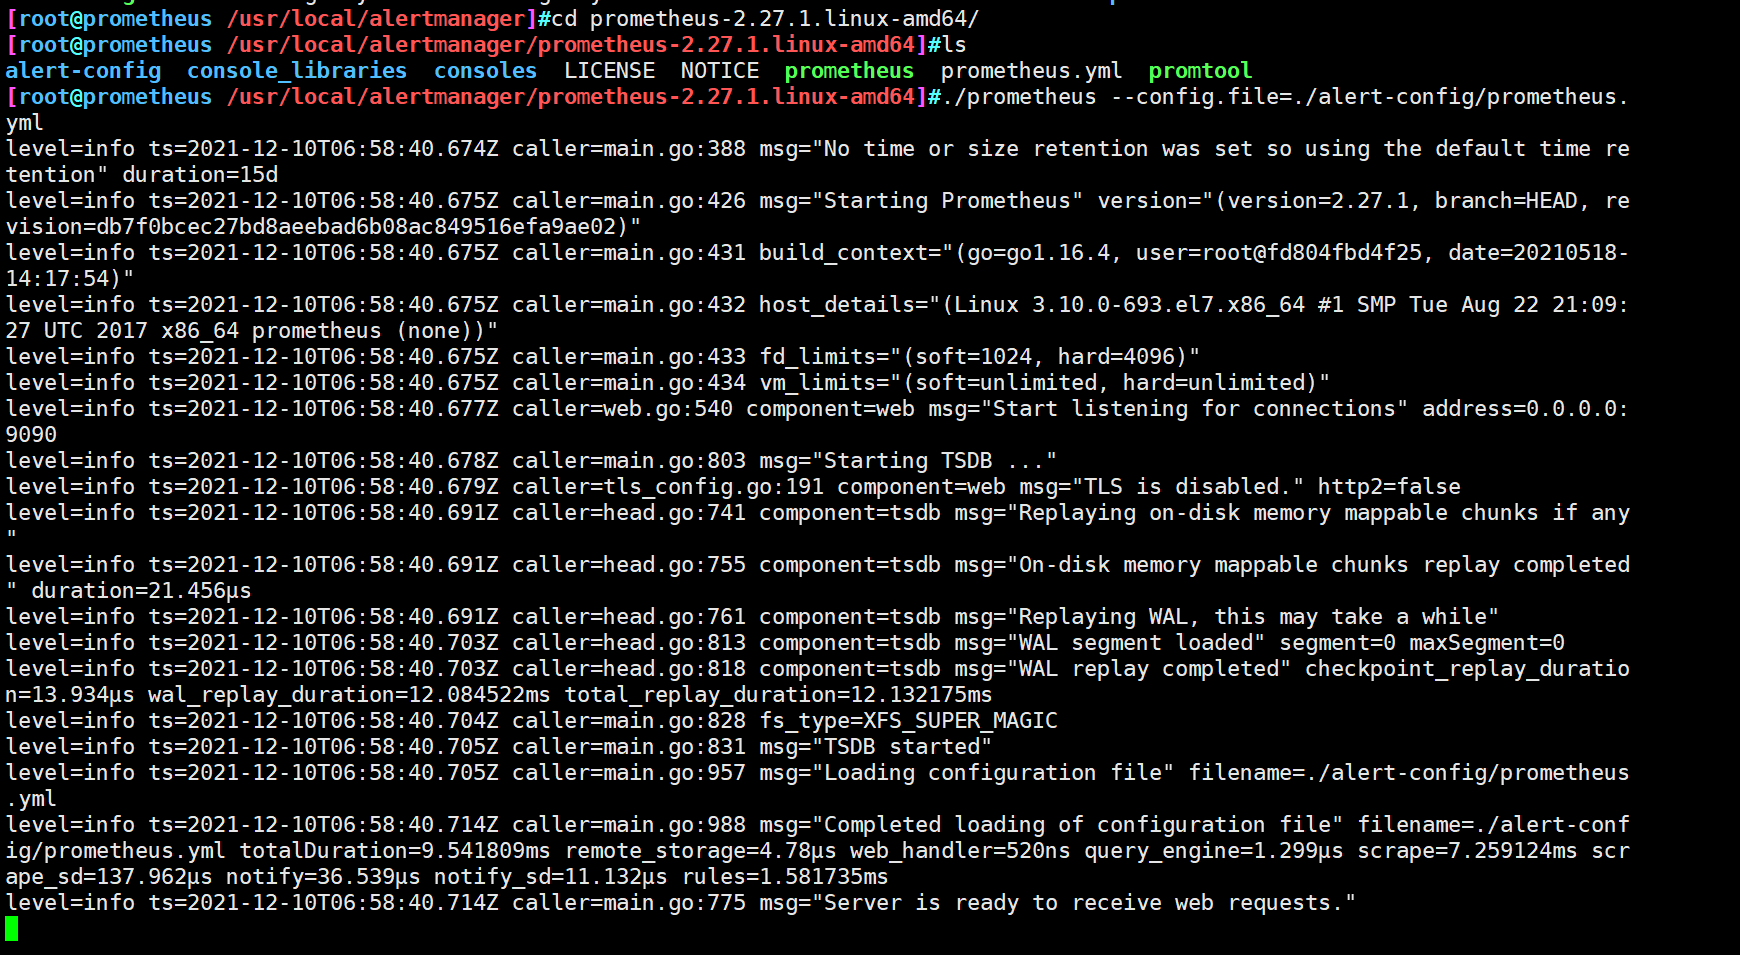
5. Start prometheus
Specify modified profile startup
cd /usr/local/prometheus-2.27.1.linux-amd64/
./prometheus --config.file=./alert-config/prometheus.yml
6. Simulated fault
- Stop node_exporter
-
View Prometheus UI

-
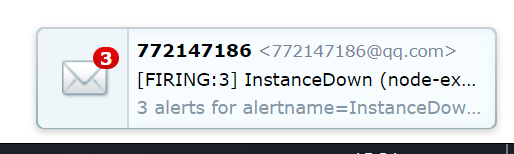
View QQ email