preface
Why did I choose Prometheus? Prometheus is built according to the concept of Google SRE operation and maintenance, which is practical and forward-looking. At the same time, it is also developed based on Go language, with good performance, simple installation and deployment, and even cross platform (including arm platform). Prometheus is a very good choice for service foundation and business monitoring.
What is Prometheus?
We quote official terms here:
Prometheus is an open source system monitoring and alarm toolkit, which can collect system information and send it to one or more monitoring centers. Prometheus collects and stores its indicators as time series data, that is, the indicator information is stored together with the timestamp recording it, and an optional key value pair called a tag.
The figure on the official website is introduced here to illustrate the architecture of Prometheus and some ecosystem components:

install
There are many installation methods, including binary package or Docker. Here we choose binary package.
Installation environment

I use Ubuntu 20.04 here. Don't ask me why, The main reason is that this machine has the largest memory (24G memory). However, it is based on arm64 architecture, so the following tutorial runs on servers based on arm64 architecture. Of course, you can also use this tutorial to install under amd64 architecture, including Tencent cloud KVM and lightweight application server. There are only some subtle differences, which we will talk about below.
Installing Prometheus
Download Prometheus
You can go to the official website or GitHub Publish page Download the installation package. Here I download the package of GitHub warehouse.
- If you are an AMD 64 server
wget https://github.com/prometheus/prometheus/releases/download/v2.31.0/prometheus-2.31.0.linux-amd64.tar.gz
tar xfz prometheus-2.31.0.linux-amd64.tar.gz
sudo cp prometheus-2.31.0.linux-amd64/prometheus /usr/local/bin/
sudo cp prometheus-2.31.0.linux-amd64/promtool /usr/local/bin/
- If you are an arm64 server
wget https://github.com/prometheus/prometheus/releases/download/v2.31.0/prometheus-2.31.0.linux-arm64.tar.gz
tar xfz prometheus-2.31.0.linux-arm64.tar.gz
sudo cp prometheus-2.31.0.linux-arm64/prometheus /usr/local/bin/
sudo cp prometheus-2.31.0.linux-arm64/promtool /usr/local/bin/
The main difference is that you need to download different packages, and the subsequent configurations are almost the same
Configure Prometheus
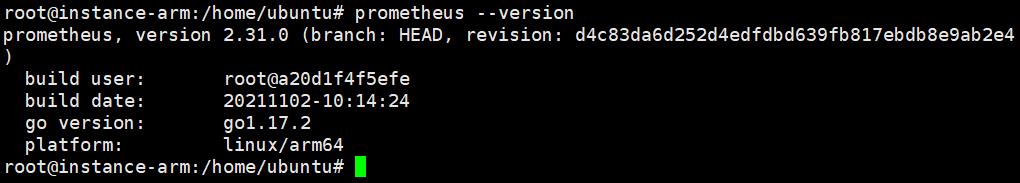
- inspect
prometheus --version
Execute the command, as shown in the figure below, and it is successful!
Under the unzipped folder, we can find a subdirectory prometheus, and then we can find a configuration file prometheus yml . Now we need to put prometheus Copy the initial configuration file of YML to the / etc/prometheus directory, and then start with a simple configuration. Of course, you can also configure it according to your own needs. For details, please refer to the official Configuration document.
sudo mkdir -p /etc/prometheus
sudo cp prometheus.yml /etc/prometheus/
- The default partial configuration is as follows:
scrape_configs:
  - job_name: "prometheus"
    static_configs:
      - targets: ["localhost:9090"]
We can see that the port is 9090. You can change it to other ports as required.
Start Prometheus
Now let's start
prometheus --config.file "/etc/prometheus/prometheus.yml"
- If an exception occurs, you can use the prometool tool to check your configuration file.
promtool check config "/etc/prometheus/prometheus.yml"
If the following prompt is output, there is no problem!
Checking /etc/prometheus/prometheus.yml
  SUCCESS: 0 rule files found
Configure service mode to run Prometheus
- Create a new service file
sudo vim /etc/systemd/system/prometheus.service
- Edit the following content and save it!
[Unit]
Description=prometheus

[Service]
User=root
ExecStart=prometheus --config.file "/etc/prometheus/prometheus.yml"
Restart=on-abort

[Install]
WantedBy=multi-user.target
- Set startup
sudo systemctl enable prometheus
- Start Prometheus
sudo systemctl start prometheus
That's it!
Configure HTTPS and reverse proxy
If your server is HTTPS, you need to configure the HTTPS certificate and private key. Here I use the Let's Encrypt certificate, which can be downloaded from the official website. Don't say how to operate. If you can't, you should learn how to use Nginx and learn to configure HTTPS certificates.
- Configure Nginx reverse proxy
Here I'll release my configuration. You can refer to it according to your needs:
location /
{
    proxy_pass http://127.0.0.1:9090;
    proxy_set_header Host $host;
    proxy_set_header X-Real-IP $remote_addr;
    proxy_set_header X-Forwarded-For $proxy_add_x_forwarded_for;
    proxy_set_header REMOTE-HOST $remote_addr;

    add_header X-Cache $upstream_cache_status;

    #Set Nginx Cache
    add_header Cache-Control no-cache;
}
Prometheus starts listening at the local loopback address localhost:9090, so the public network cannot be accessed directly. I don't recommend that you open the firewall, which can bring some security protection.
preview
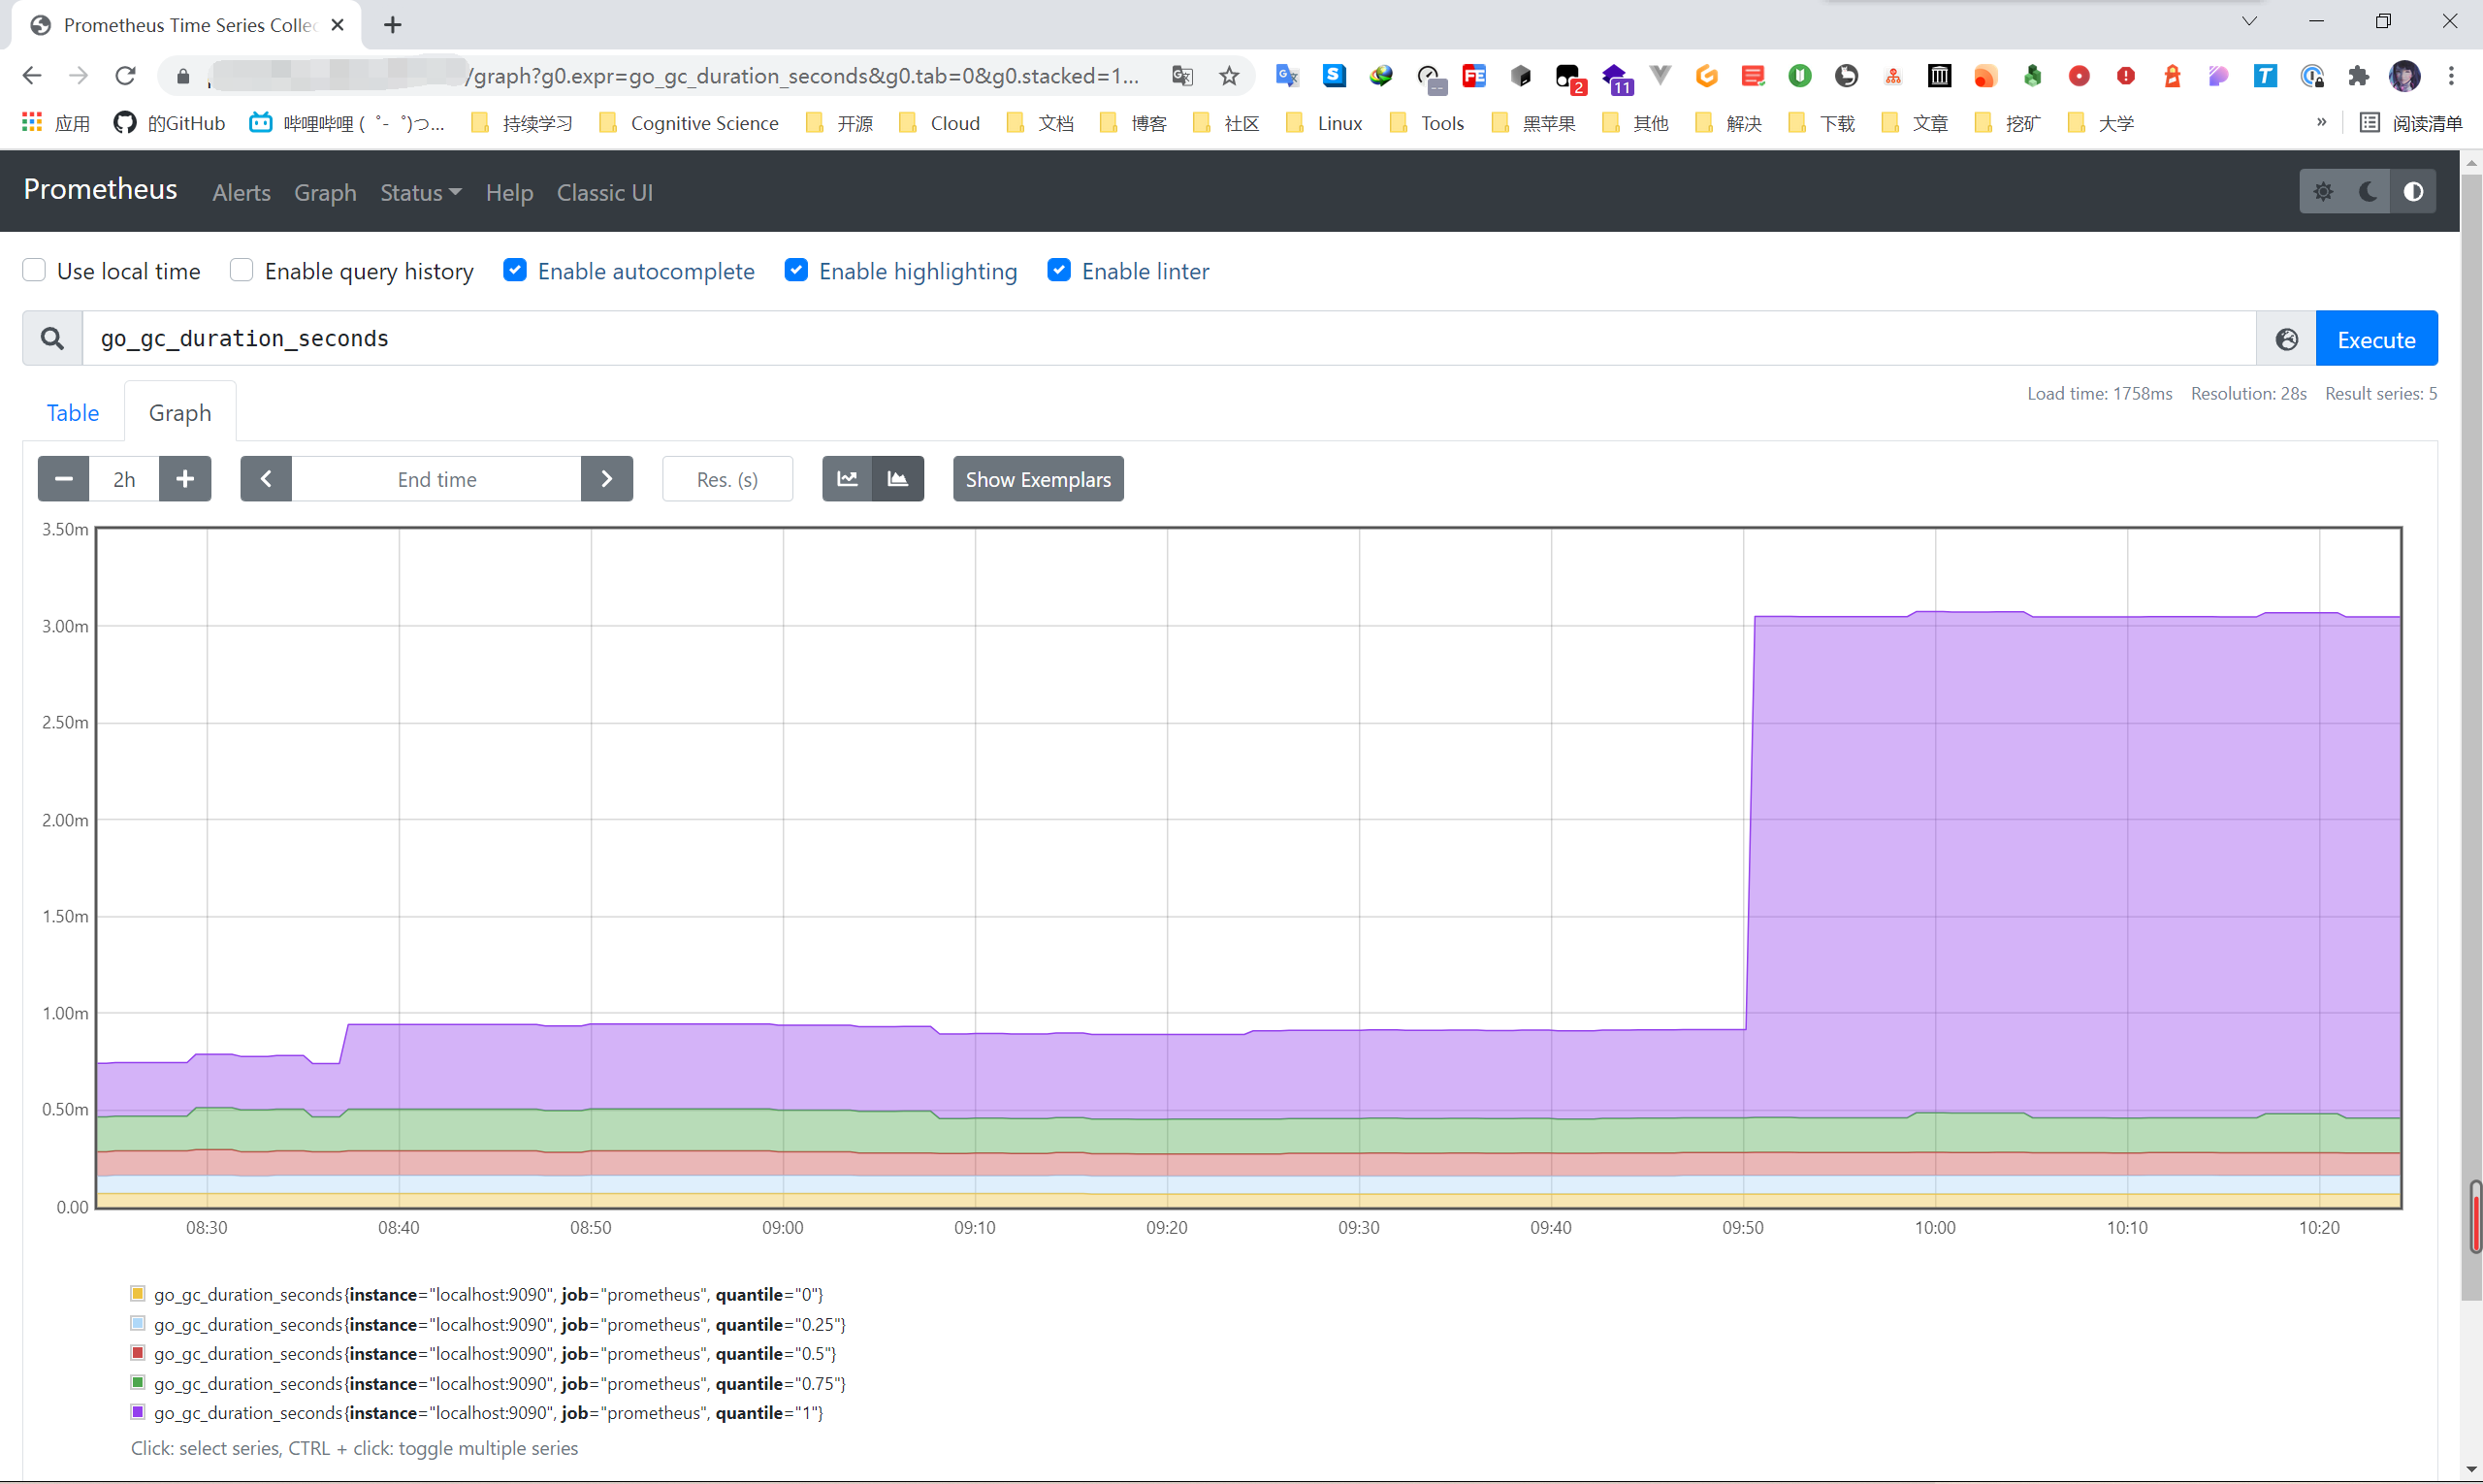
When we visit the domain name, we can see the page!
Here's a hint. I'm not in a production environment. I just use it to practice and learn, so it doesn't matter. It's not recommended in the production environment! Remote access can be realized through ssh port forwarding.