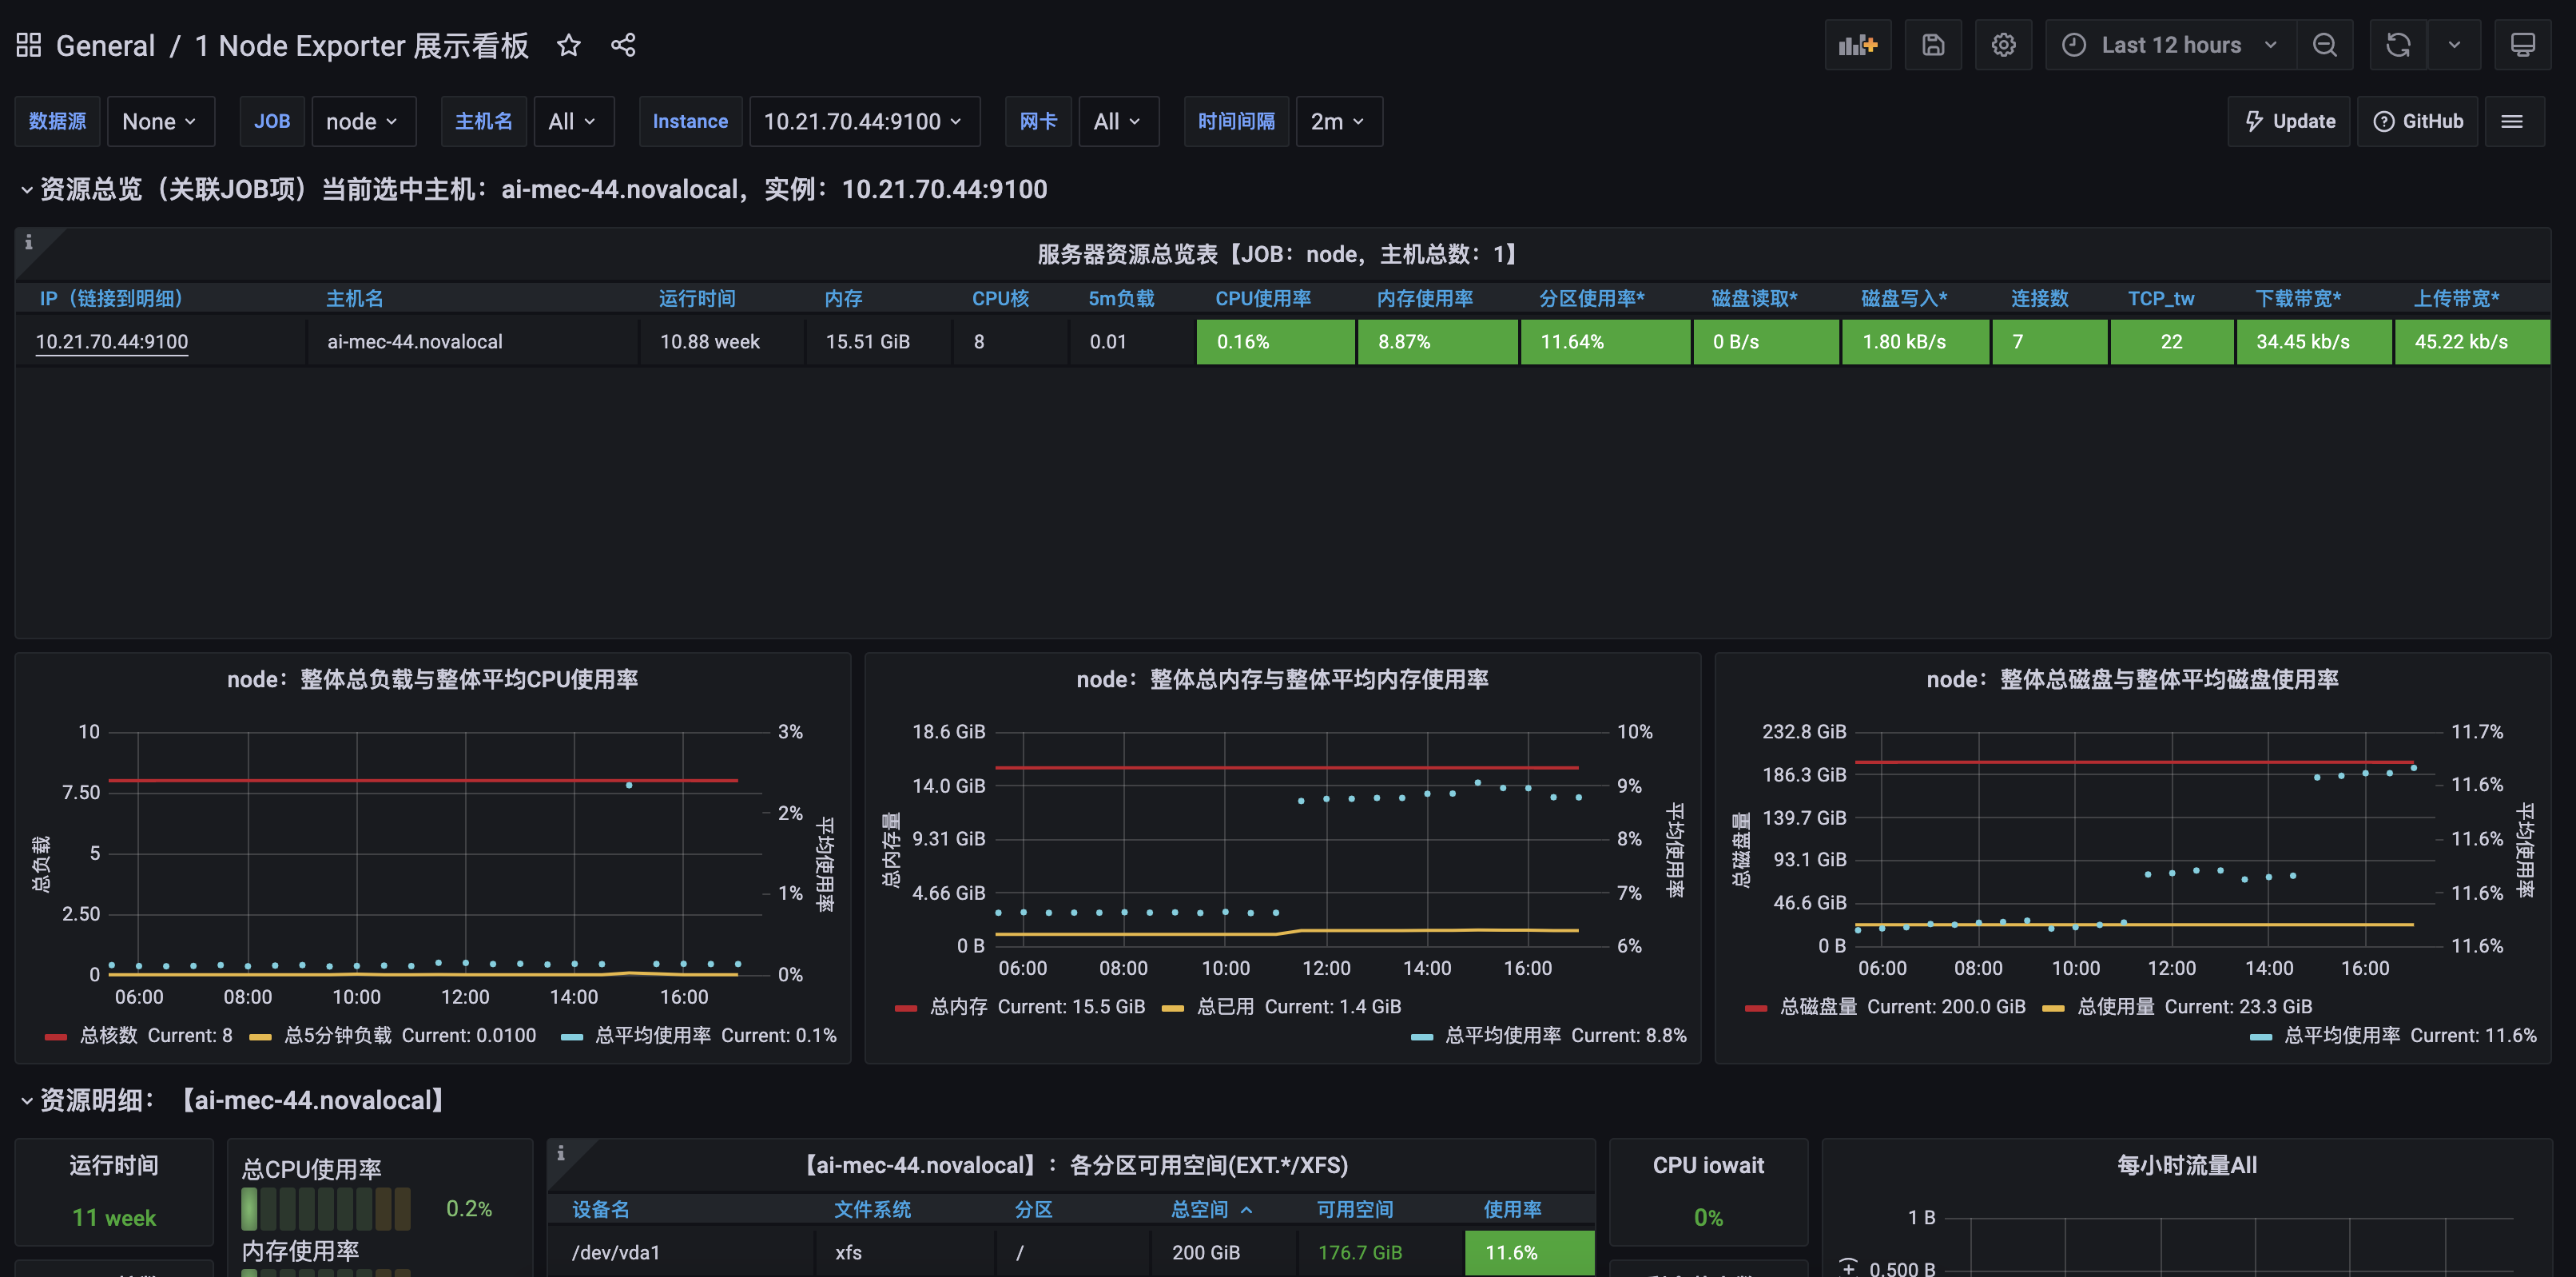
Prometheus, an open source tool, is selected to extract and save system monitoring, docker service monitoring and API gateway status monitoring data, display the monitoring data with Grafana, an open source visual graphic, and send an alarm email through the mailbox according to the monitoring data.
The following will take collecting the operation data of a server as an example to illustrate the operation principle and construction process of the monitoring system.
1, Prometheus
Prometheus is an open source monitoring system, which can regularly obtain and save monitoring data through the open API interface of job/exporter. Therefore, before explaining Prometheus, you must introduce exporter.
1.1 node_exporter
It is necessary to collect the operating parameters of a server, such as server CUP load, system load, memory consumption, hard disk usage, etc_ The exporter tool can collect data and open the API query interface to the public.
1.1.1 node_exporter installation and use
Visit https://github.com/prometheus/node_exporter/releases , you can view the node_ For each version of the exporter, download the version of the object as needed. node_exporter is implemented in go language, and the source code can https://github.com/prometheus/node_exporter obtain.
Download version 0.17.0 and run it. The server ip is 10.21.70.44.
cd /opt/
wget https://github.com/prometheus/node_exporter/releases/download/v0.17.0/node_exporter-0.17.0.linux-amd64.tar.gz
tar -zxvf node_exporter-0.17.0.linux-amd64.tar.gz
cd node_exporter-0.17.0.linux-amd64/
./node_exporter
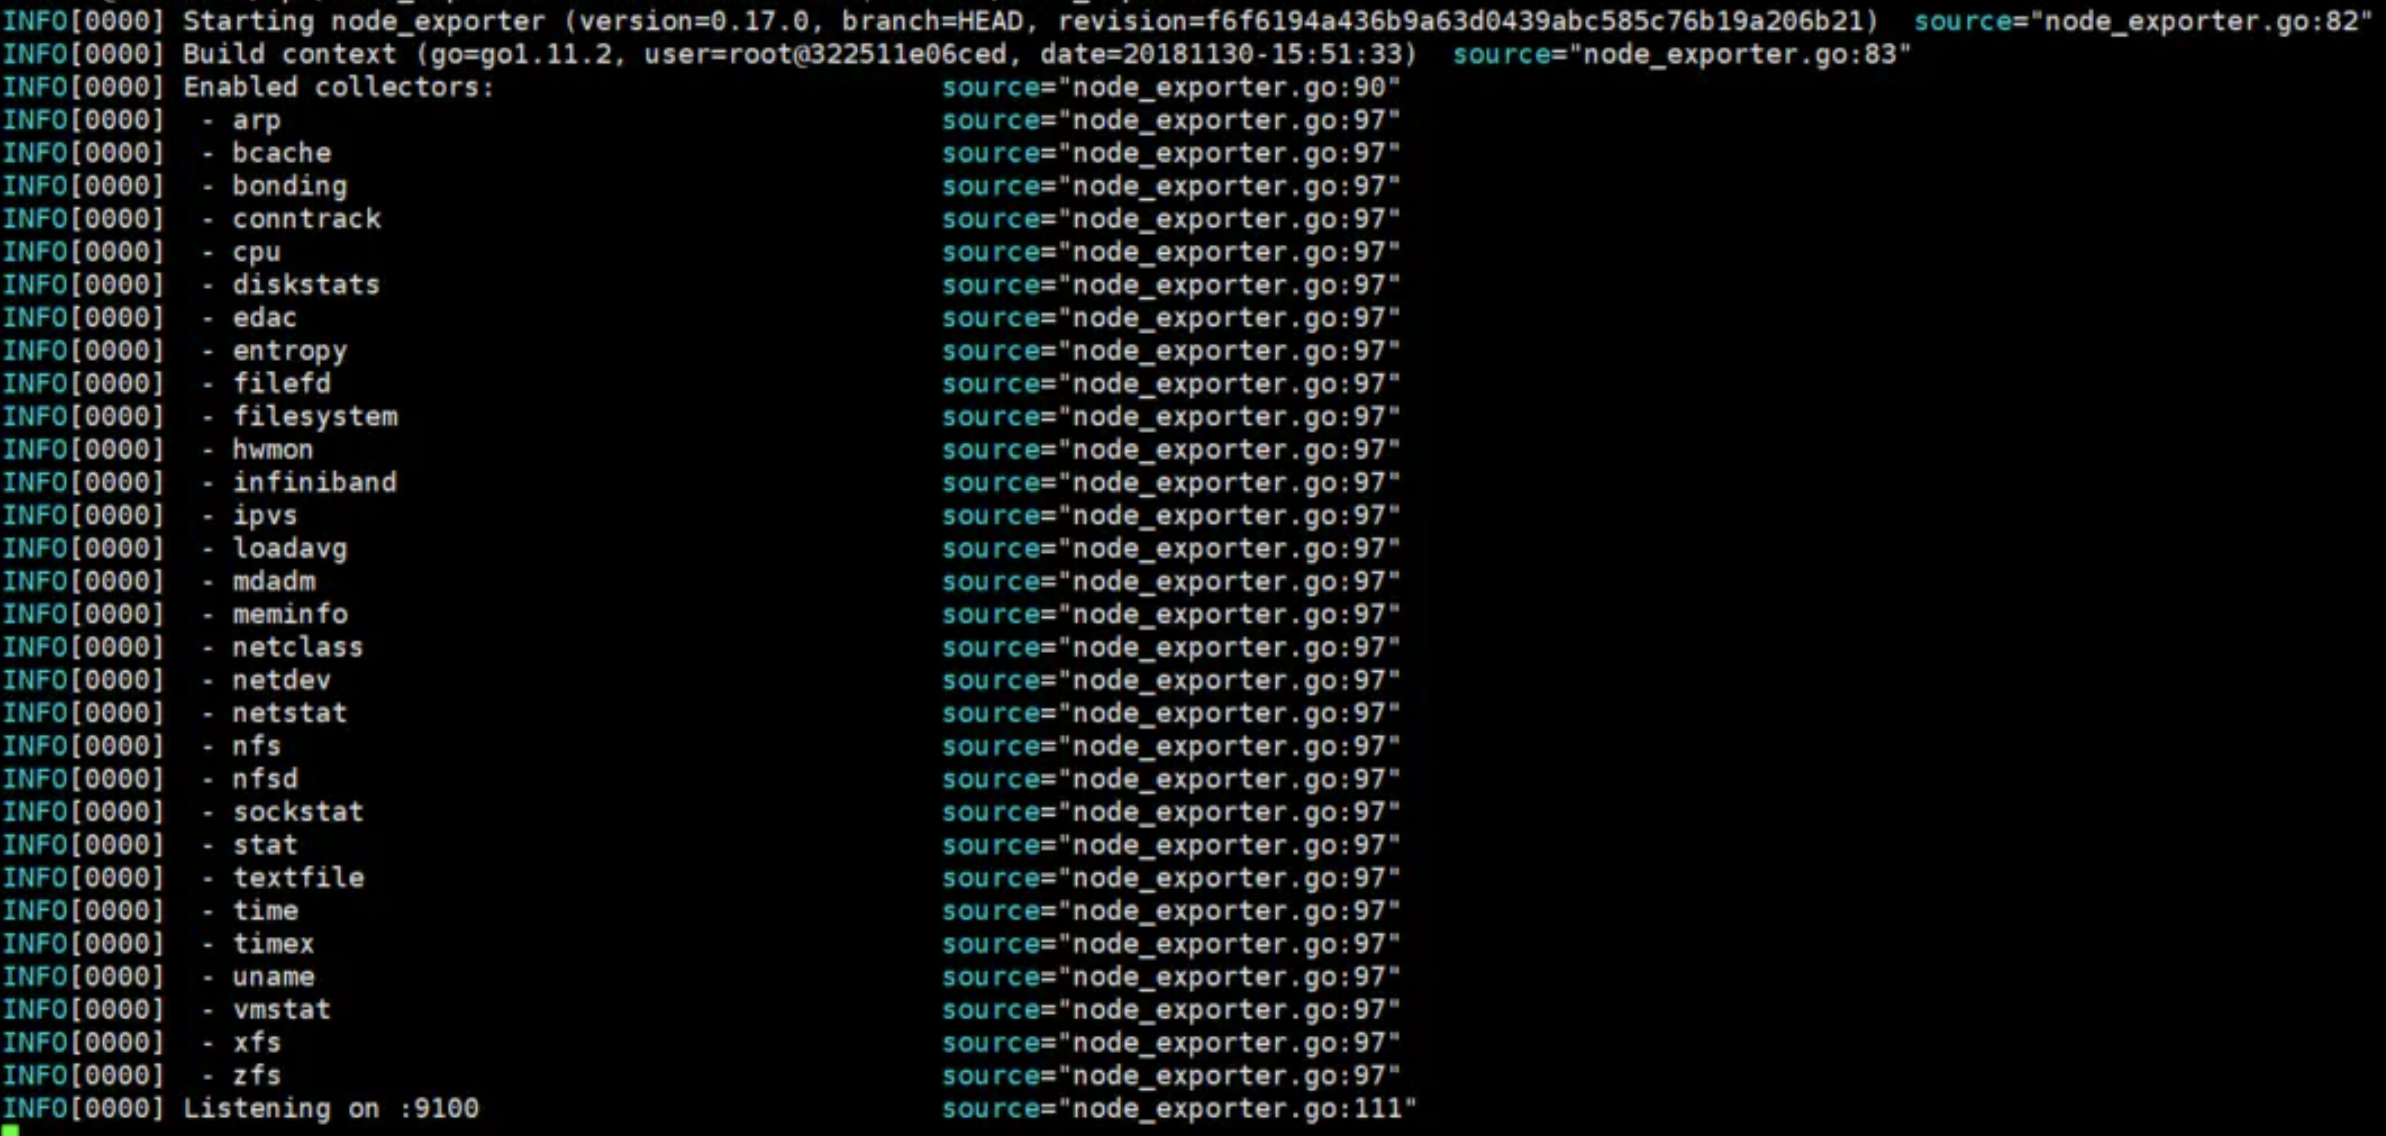
You can see the following startup log. The external port is 9100
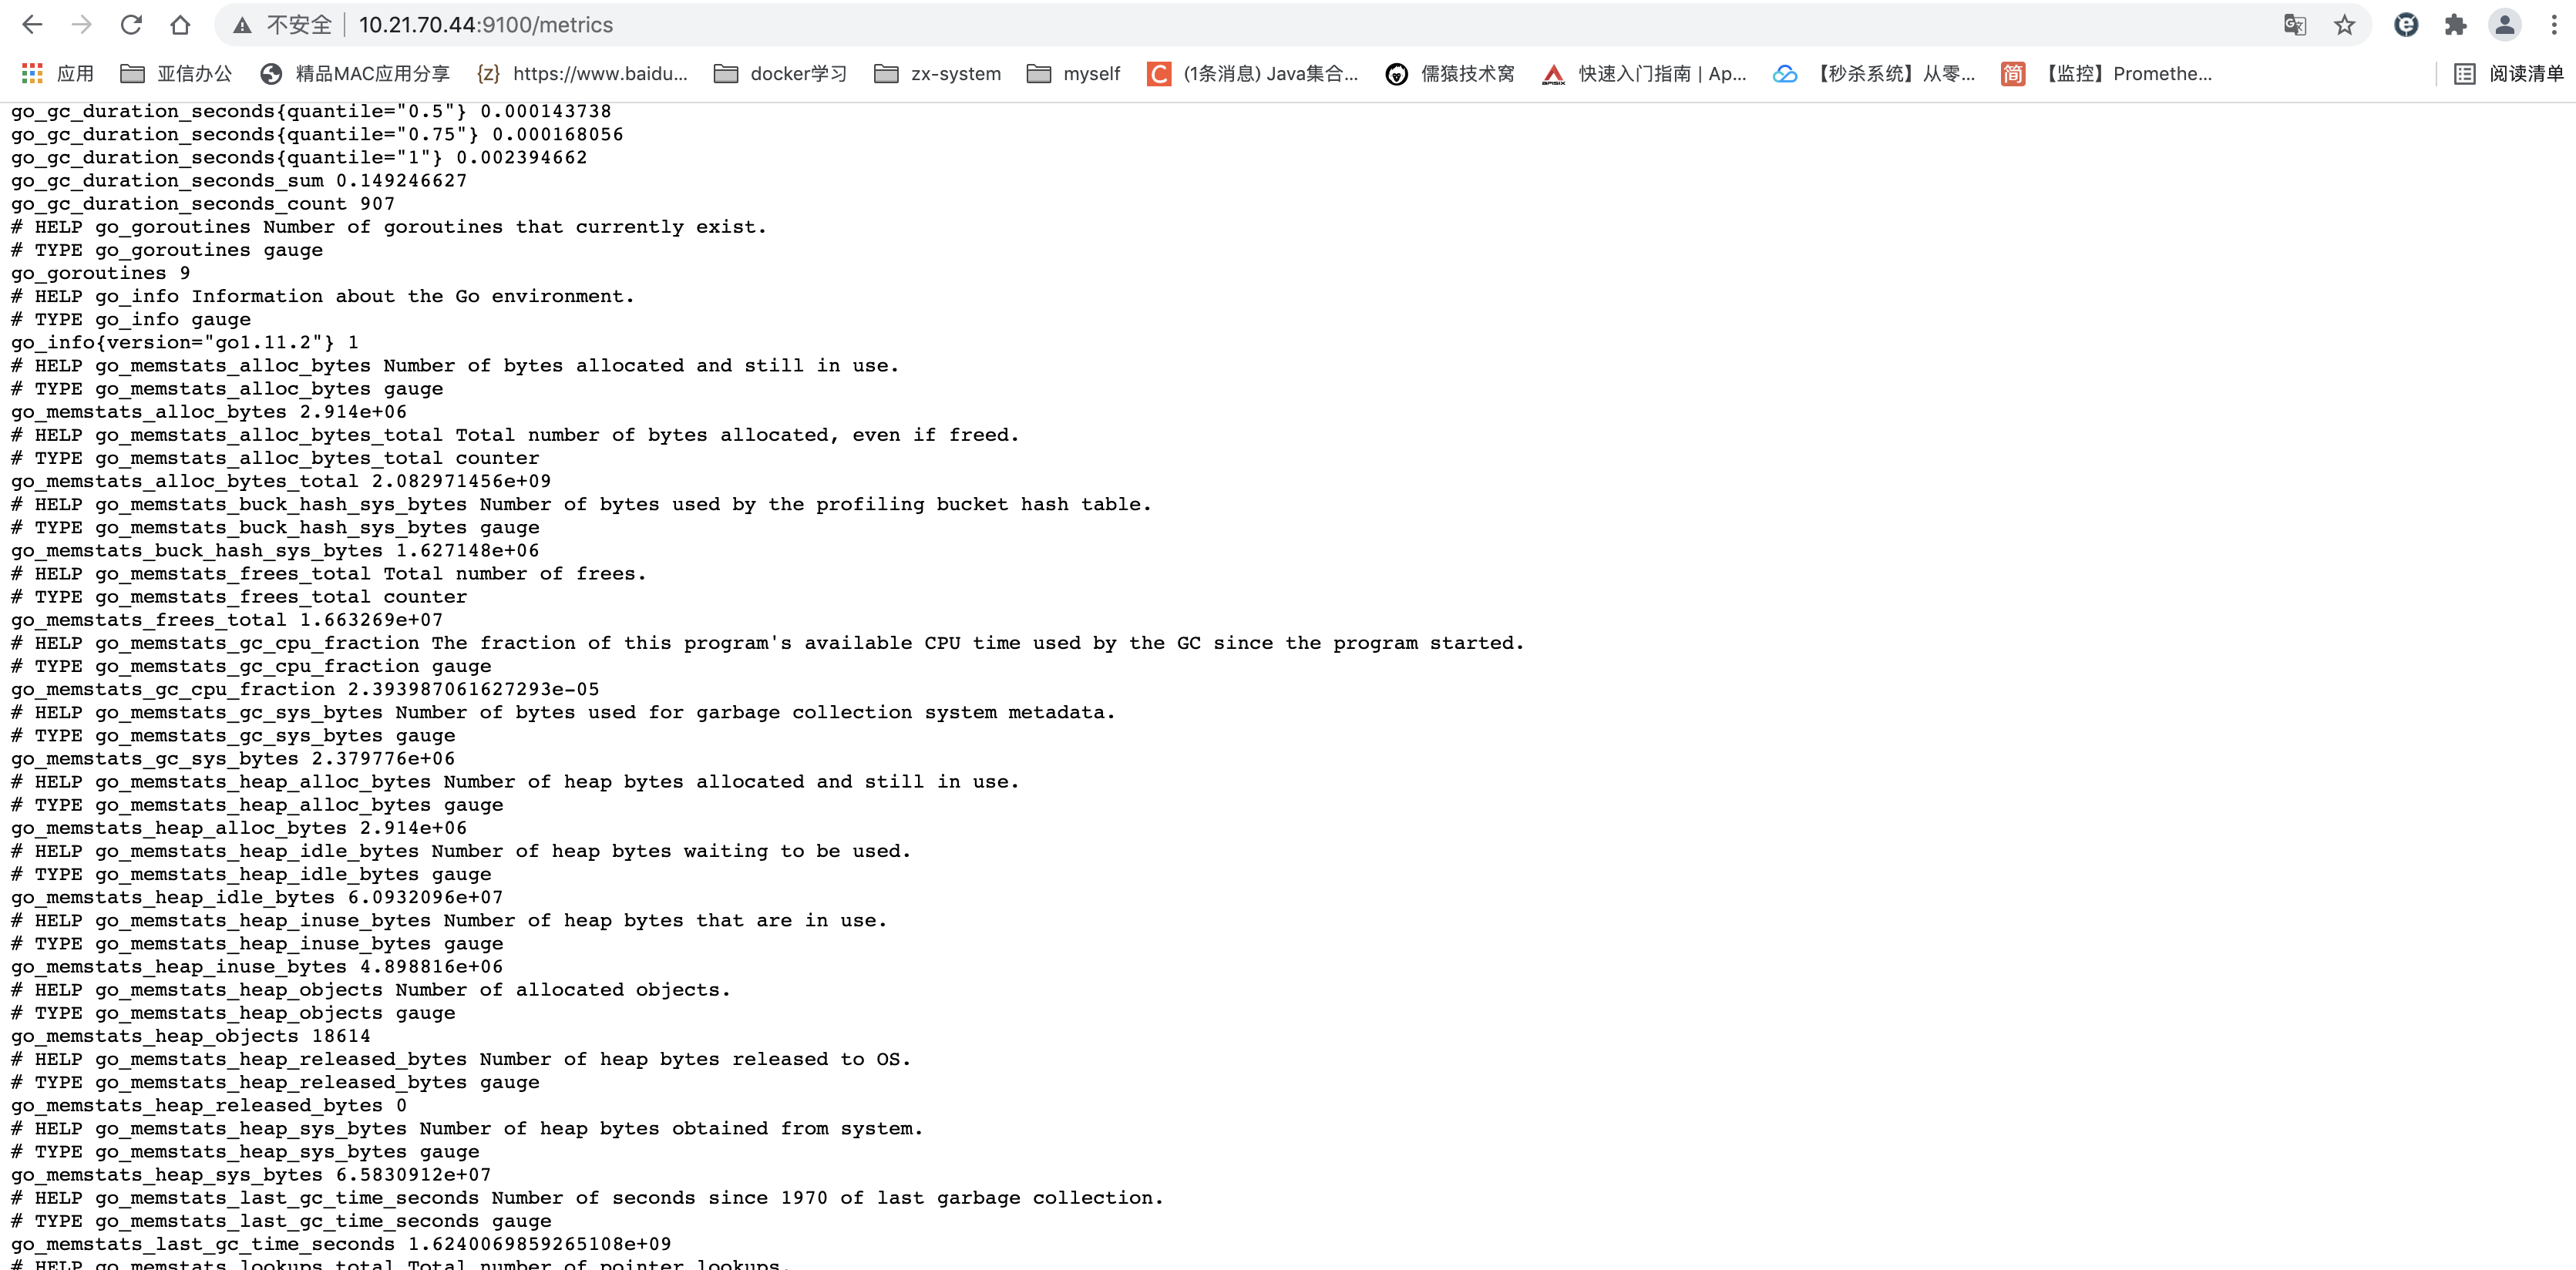
You can view the collected indicator data by accessing ip+port, directly enter 10.21.70.44:9100 in the browser, and click Metrics to view the monitoring indicator data queried this time.
1.1.2 introduction to Prometheus
Via node_ According to the introduction of exporter, we can guess that one of the functions of Prometheus is to regularly access nodes_ Exporter is an open API interface to obtain the operation data of the current system.
Architecture diagram of Prometheus official website
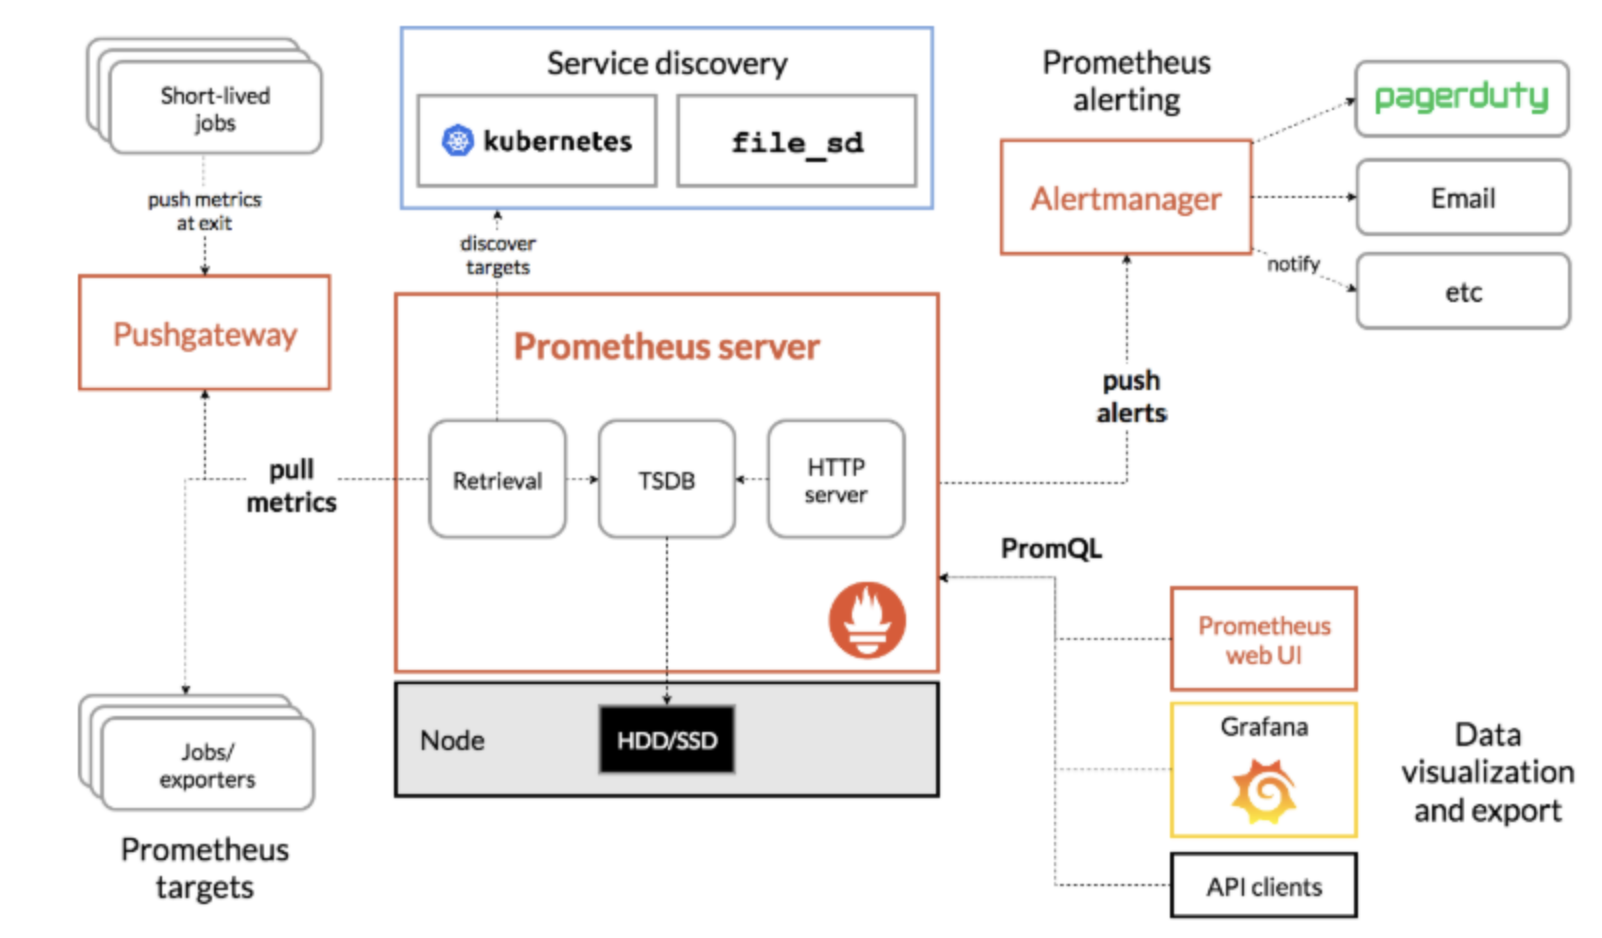
Analyze the architecture diagram
Prometheus server: it is the core component of Prometheus tool. It uses the time series database TSDB to store the monitoring data on the hard disk.
Service discovery: service discovery capability, file_sd - this function allows Prometheus to monitor the changes of configuration files by itself; kubernetes -- enables Prometheus to dynamically update the configuration to accommodate frequent node changes.
Push gateway: it is equivalent to the capacity of the transfer station. Prometheus only uses the pull method to pull the listening data from the open API interface of the node, but there are special nodes that can only push the data, so you can push the data to the push gateway first, and Prometheus pulls the data from the push gateway.
Jobs/exporters: exporter, the main data source of Prometheus. Node described in the previous section_ Exporter is a kind of exporter.
1.1.3 installation and use of Prometheus
Pass https://prometheus.io/download/ Select the appropriate version of Prometheus. This article selects the 2.6.0-linux version.
cd /opt
sudo wget https://github.com/prometheus/prometheus/releases/download/v2.6.0/prometheus-2.6.0.linux-amd64.tar.gz
sudo tar -zxvf prometheus-2.6.0.linux-amd64.tar.gz
cd prometheus-2.6.0.linux-amd64/
First configure Prometheus YML, in the scene_ Add node under configs node_exporter's open API.
 - job_name: "node"
    static_configs:
    - targets: ["10.21.70.44:9100"]
Start Prometheus with the command ". / Prometheus". The startup log is shown in the screenshot below. You can see "Server is ready to receive web requests.", Indicates that Prometheus started successfully.
level=info ts=2018-12-29T08:51:26.126230419Z caller=main.go:243 msg="Starting Prometheus" version="(version=2.6.0, branch=HEAD, revision=dbd1d58c894775c0788470944b818cc724f550fb)"
level=info ts=2018-12-29T08:51:26.126302838Z caller=main.go:244 build_context="(go=go1.11.3, user=root@bf5760470f13, date=20181217-15:14:46)"
level=info ts=2018-12-29T08:51:26.126419034Z caller=main.go:245 host_details="(Linux 4.4.0-132-generic #158-Ubuntu SMP Thu Aug 2 09:08:04 UTC 2018 x86_64 master1 (none))"
level=info ts=2018-12-29T08:51:26.126497022Z caller=main.go:246 fd_limits="(soft=1000000, hard=1000000)"
level=info ts=2018-12-29T08:51:26.126567171Z caller=main.go:247 vm_limits="(soft=unlimited, hard=unlimited)"
level=info ts=2018-12-29T08:51:26.127332045Z caller=main.go:561 msg="Starting TSDB ..."
level=info ts=2018-12-29T08:51:26.127414745Z caller=web.go:429 component=web msg="Start listening for connections" address=0.0.0.0:9090
level=info ts=2018-12-29T08:51:26.135164421Z caller=main.go:571 msg="TSDB started"
level=info ts=2018-12-29T08:51:26.135204665Z caller=main.go:631 msg="Loading configuration file" filename=prometheus.yml
level=info ts=2018-12-29T08:51:26.136207062Z caller=main.go:657 msg="Completed loading of configuration file" filename=prometheus.yml
level=info ts=2018-12-29T08:51:26.136232588Z caller=main.go:530 msg="Server is ready to receive web requests."
Browser via url: http://10.21.70.44:9090 , access the UI interface provided by Prometheus.
Prometheus supports PromQL language memory query and simple graphic display. Click the Graph button to view the Graph.
------Additional screenshots are required, as well as input
2, Grafana+Prometheus
Because Prometheus' graphic display tool is too simple and can not store data for a long time, Grafana is an open-source data visualization tool developed in Go language, which can do data monitoring and data statistics and support alarm function. Prometheus can be directly supported as a data source. Therefore, Grafana was selected to cooperate with Prometheus for data display and monitoring.
2.1 installation and deployment of Grafana+Prometheus
This paper chooses the docker container to deploy Grafana and Prometheus, and the docker compose orchestration file docker compose YML contents are as follows:
version: '2'

networks:
  monitor:
    driver: bridge

services:
  prometheus:
    image: prom/prometheus:latest
    container_name: prometheus
    hostname: prometheus
    restart: always
    volumes:
      - /opt/prometheus/config:/etc/prometheus
      - /data/prometheus:/prometheus
    ports:
      - "9090:9090"
    expose:
      - "8086"
    command:
      - '--config.file=/etc/prometheus/prometheus.yml'
      - '--log.level=info'
      - '--web.listen-address=0.0.0.0:9090'
      - '--storage.tsdb.path=/prometheus'
      - '--storage.tsdb.retention=15d'
      - '--query.max-concurrency=50'
    networks:
      - monitor

  grafana:
    image: grafana/grafana:latest
    container_name: grafana
    hostname: grafana
    restart: always
    volumes:
      - /opt/grafana/data:/var/lib/grafana
    ports:
      - "3000:3000"
    networks:
      - monitor
    depends_on:
      - prometheus
According to docker compose YML file content, create a new mapping directory of docker container, and map the Prometheus configuration file, grafana data file and Prometheus data file to the disk. In this way, it is convenient to operate without entering the container.
sudo su
cd /opt
mkdir -p prometheus/config/
mkdir -p grafana/data
chmod 777 grafana/data
mkdir -p /data/prometheus
chmod 777 /data/prometheus
Execute docker compose - f docker compose YML up - D, start prometheus and grafana tool containers. After startup, view the prometheus page respectively: http://10.21.70.44:9090/targets , check whether the exporter is running normally.

Log in to the Grafana page, http://10.21.70.44:3000/ , user name: admin, password: admin

After logging in, add a data source data source, that is, add a Prometheus type data source.
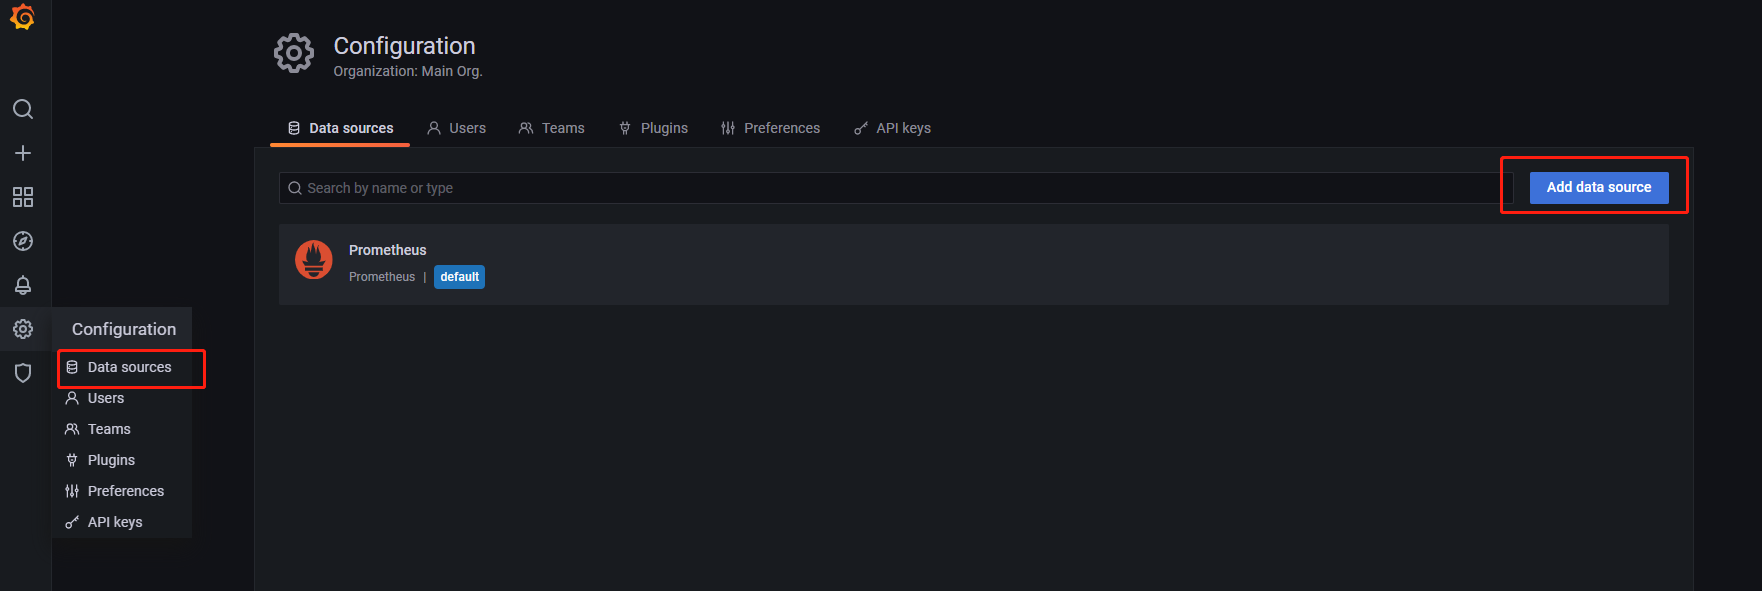
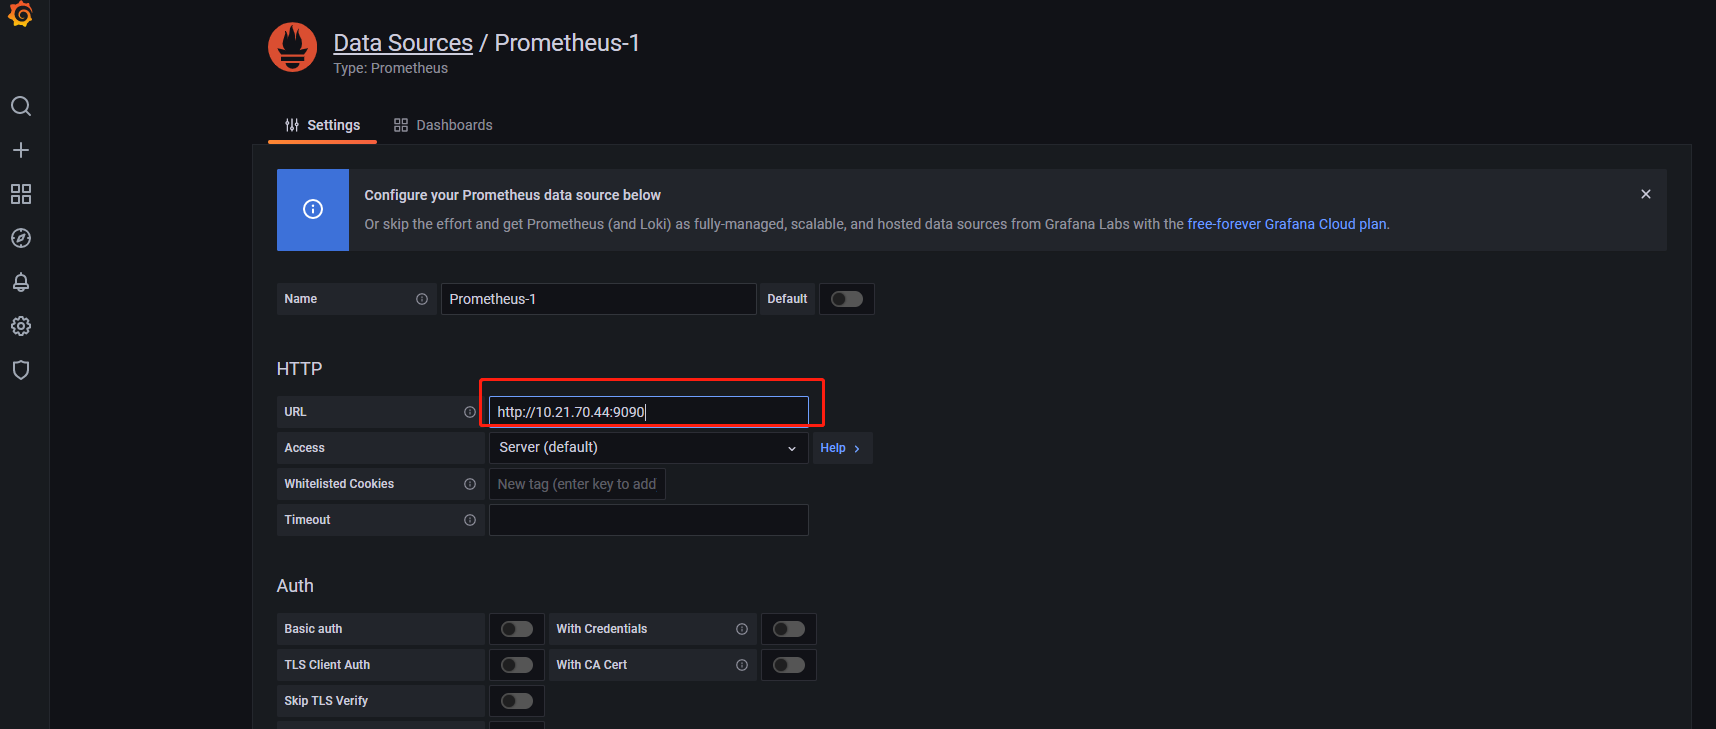
Select Prometheus, enter Prometheus open API for obtaining monitoring data, and click [save and test] to test whether the data source runs correctly.
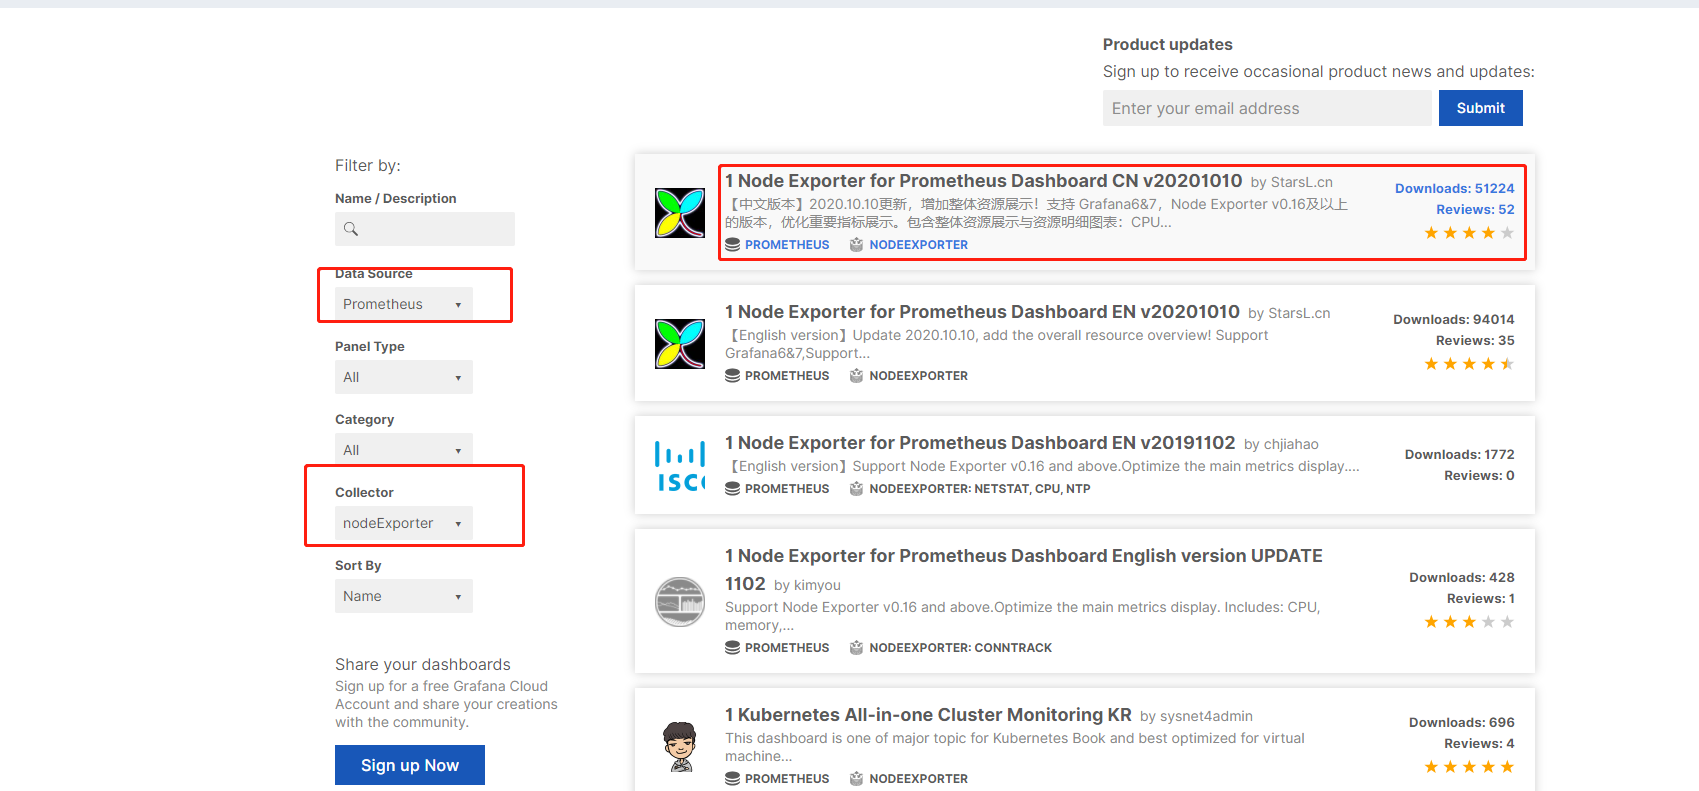
node_exporter is an open source project with object dashboard charts, so you can directly download it from Grafana's official website and visit it https://grafana.com/ , select [Grafana] - [Dashboards].

Filtering conditions: select Prometheus for Data Source and nodeExporter for collector, as shown in the screenshot below. Finally, we select the first Chinese version of dashboard.
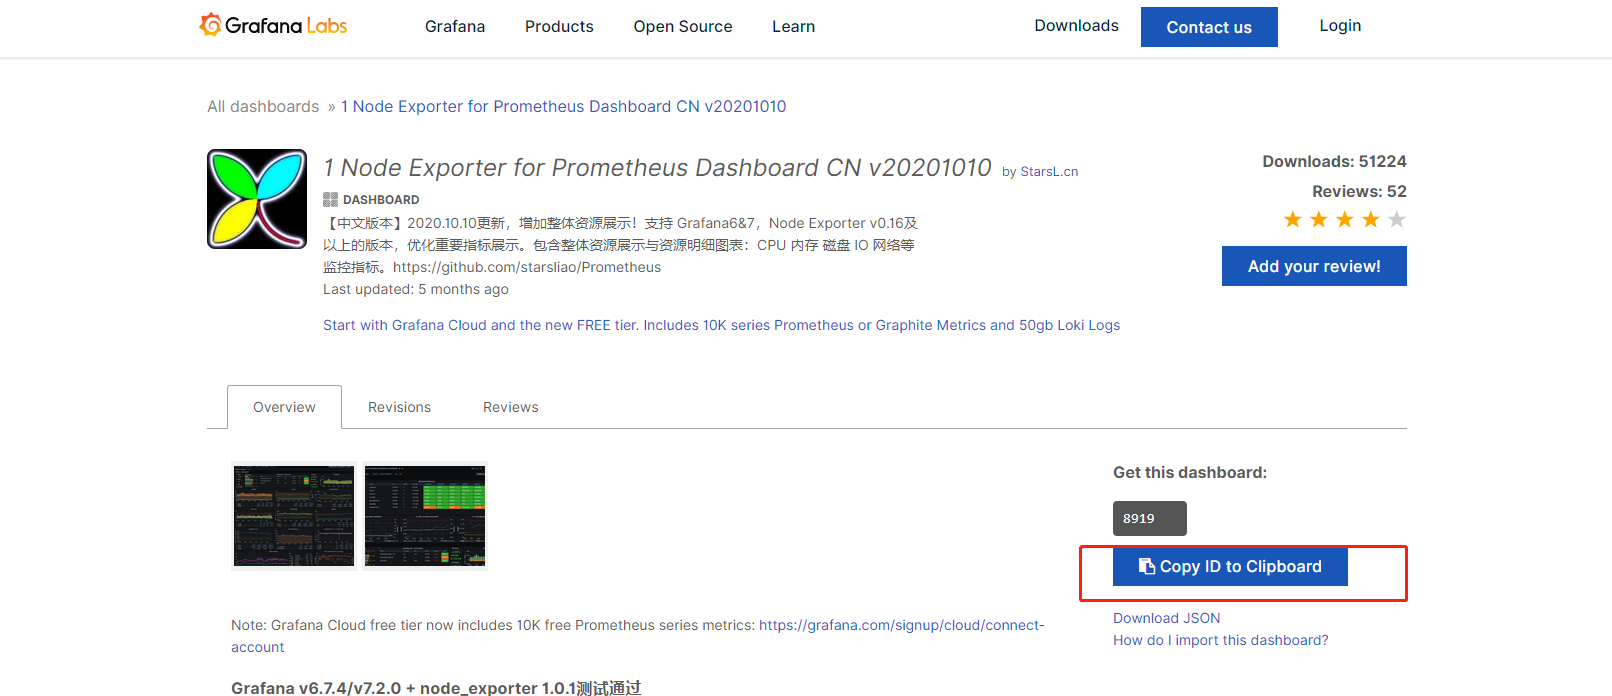
Responsible for the ID of the dashboard template, as shown in the figure below
On the Grafana page, select import to import the dashboard template
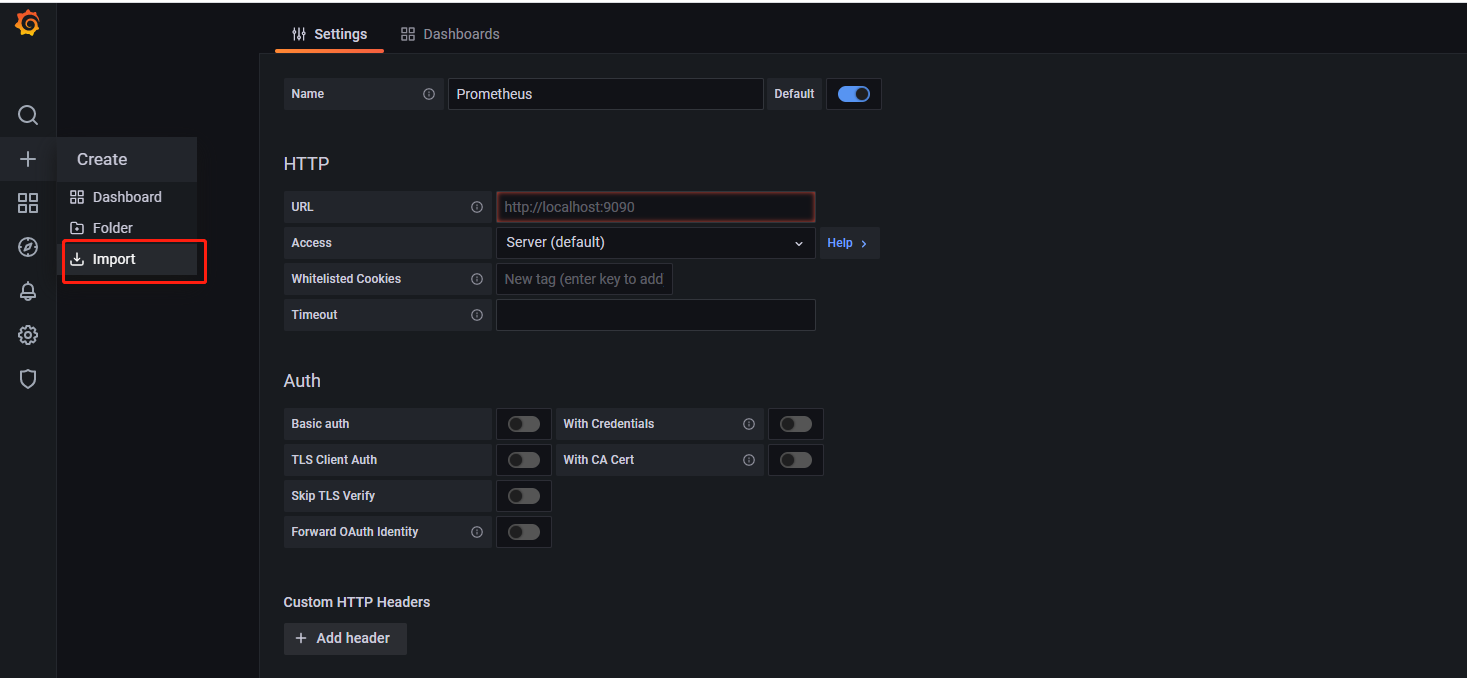
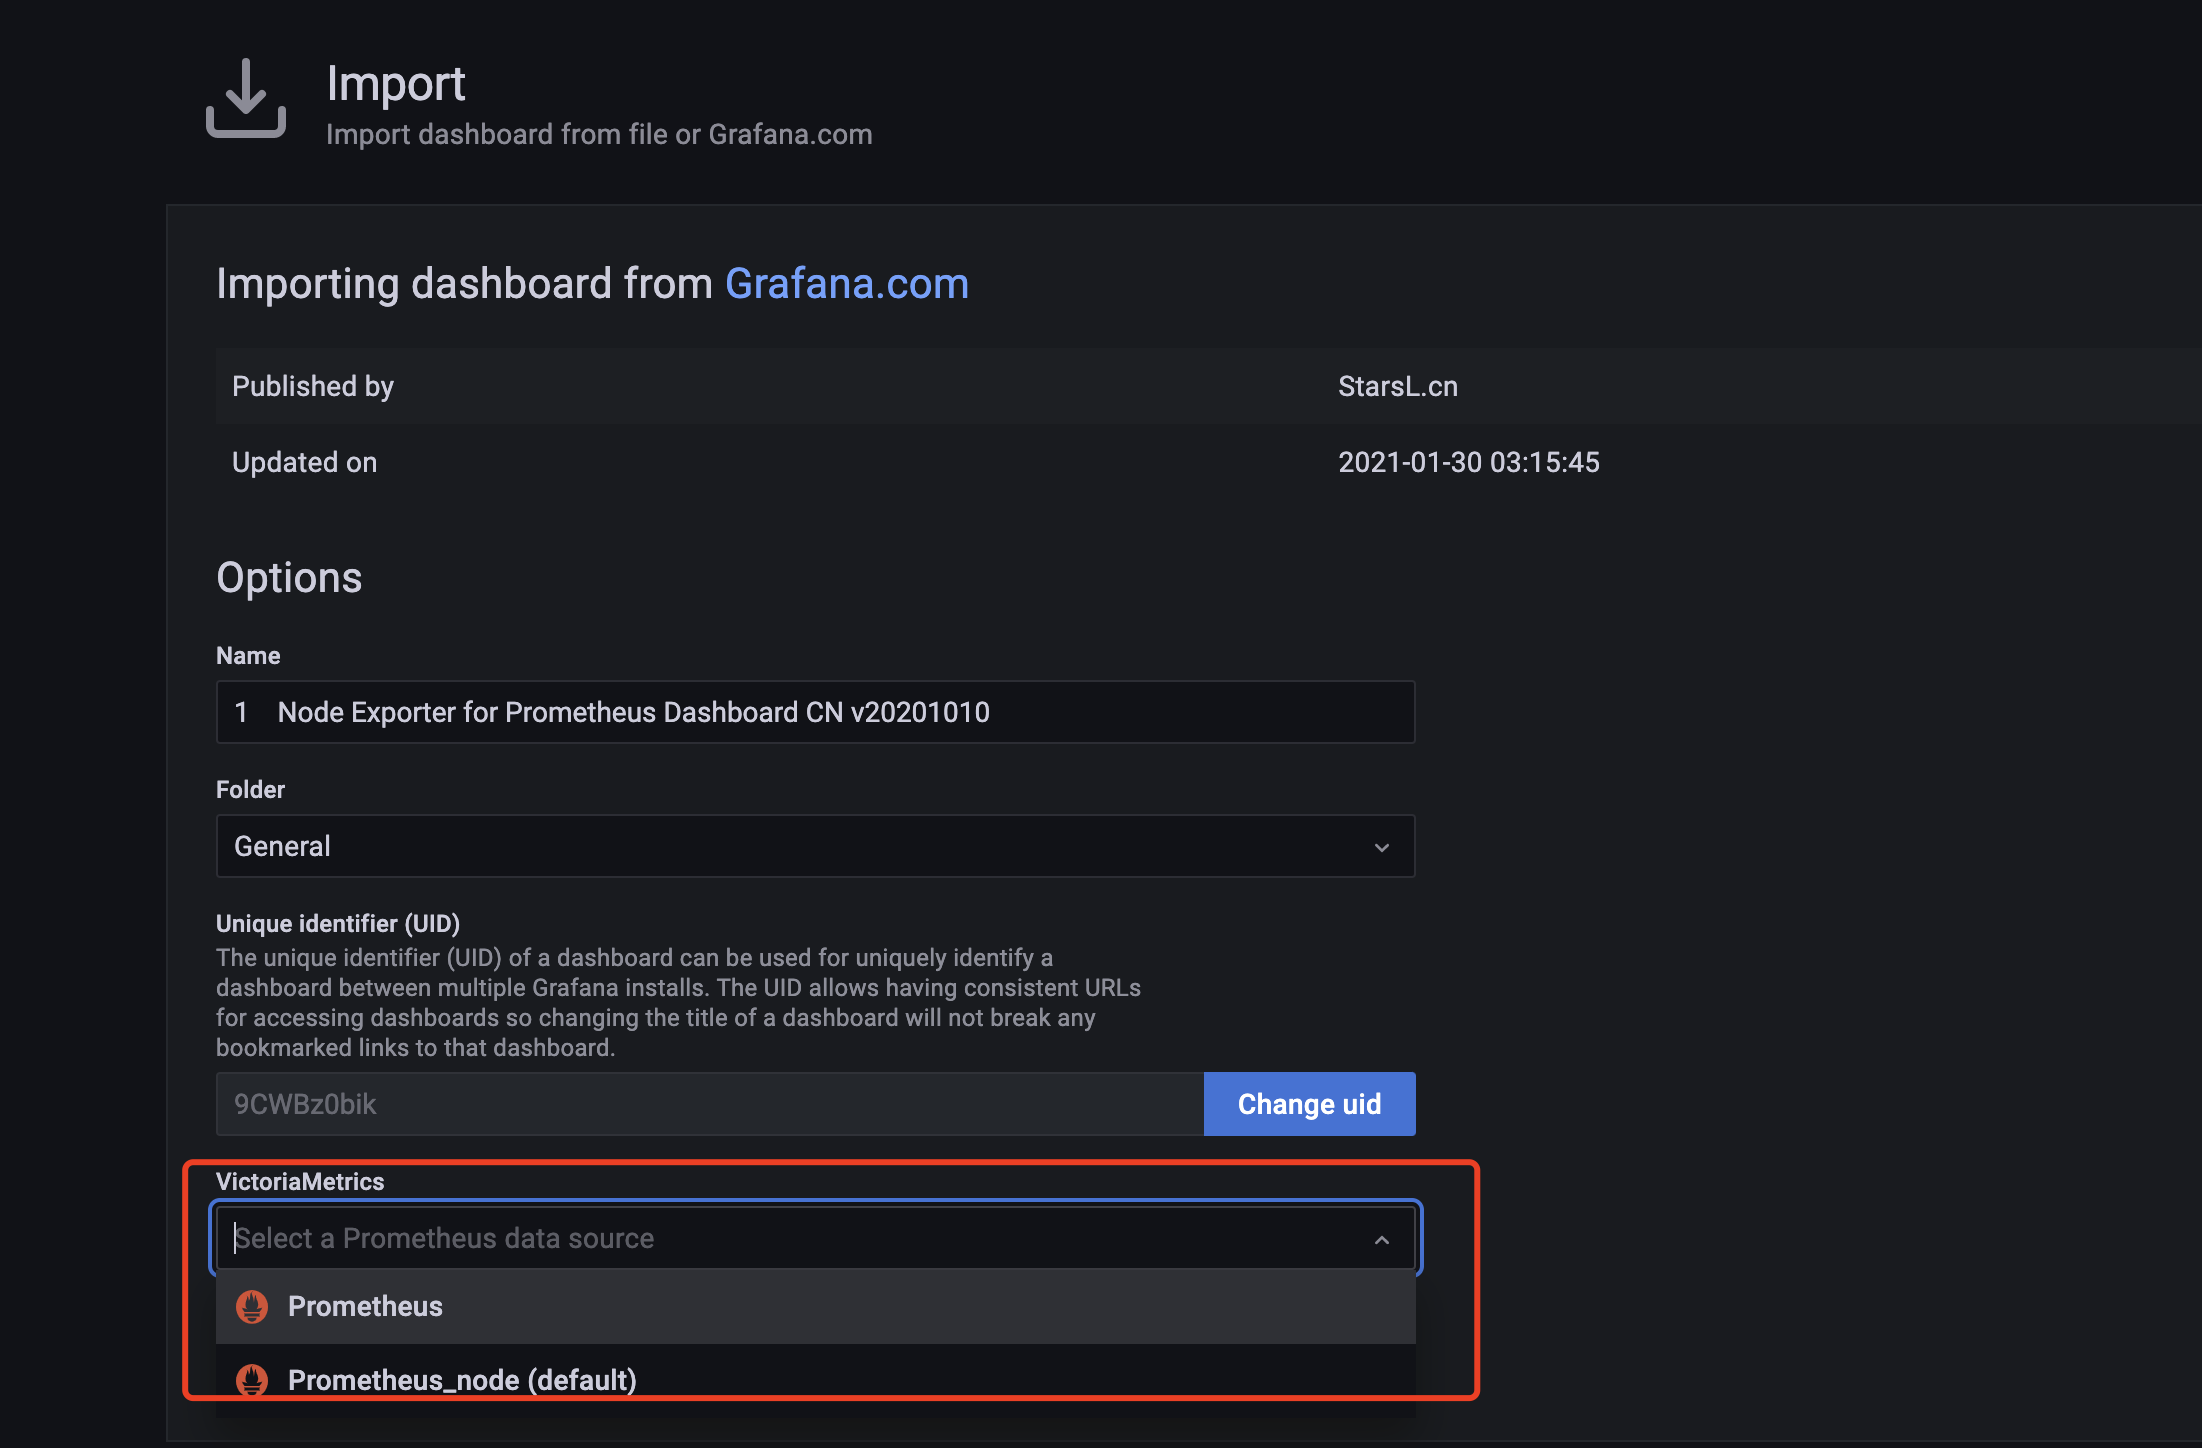
Paste the ID of the copied dashboard template: 8919, click load, and Grafana will automatically download the template
After loading the template, select the corresponding data source.
The monitoring data displayed are as follows:
