Prometheus and Grafan container deployment
Environmental description
| host name | IP |
| master | 192.168.58.110 |
| client | 192.168.58.20 |
Install docker on the master host
docker installation
Configure network source (rhel red hat system)
[root@master ~]# curl -o /etc/yum.repos.d/CentOS-Base.repo https://mirrors.aliyun.com/repo/Centos-8.repo
Configure docker CE source
[root@master ~]# cd /etc/yum.repos.d/
[root@master yum.repos.d]# curl -o docker-ce.repo https://mirrors.tuna.tsinghua.edu.cn/docker-ce/linux/centos/docker-ce.repo
Install docker CE and dependent packages and tools
[root@master ~]# dnf -y install yum-utils device-mapper-persistent-data lvm2
[root@master ~]# yum -y install docker-ce --allowerasing
After installation, use the docker version command to view the docker version information
[root@master ~]# docker version
Client: Docker Engine - Community
 Version:           20.10.11
 API version:       1.41
 Go version:        go1.16.9
 Git commit:        dea9396
 Built:             Thu Nov 18 00:36:58 2021
 OS/Arch:           linux/amd64
 Context:           default
 Experimental:      true
Configure docker image acceleration
For personal accelerator links, please visit docker basic usage
[root@master ~]# mkdir -p /etc/docker
[root@master ~]# vim /etc/docker/daemon.json
{
          "registry-mirrors": ["https://a74l47xi.mirror.aliyuncs.com "] / / the web address here is assigned by personal account
}
[root@master ~]# systemctl daemon-reload
[root@master ~]# systemctl restart docker
After configuration, pull the prom/Prometheus official image
[root@master ~]# docker pull prom/prometheus
Using default tag: latest
latest: Pulling from prom/prometheus
97518928ae5f: Pull complete
5b58818b7f48: Pull complete
d9a64d9fd162: Pull complete
4e368e1b924c: Pull complete
867f7fdd92d9: Pull complete
387c55415012: Pull complete
07f94c8f51cd: Pull complete
ce8cf00ff6aa: Pull complete
e44858b5f948: Pull complete
4000fdbdd2a3: Pull complete
Digest: sha256:18d94ae734accd66bccf22daed7bdb20c6b99aa0f2c687eea3ce4275fe275062
Status: Downloaded newer image for grafana/grafana:latest
docker.io/prom/prometheus:latest

[root@master ~]# docker images
REPOSITORY                                                        TAG             IMAGE ID       CREATED        SIZE
prom/prometheus                                                   latest          a3d385fc29f9   11 days ago    201MB
Get Prometheus. On the client YML profile
prometheus official
# Upload the installation package of prometheus to the host, unzip it, and download prometheus The yaml configuration file is transferred to the / opt directory of the master host
[root@client ~]# ls
anaconda-ks.cfg   prometheus-2.31.1.linux-amd64.tar.gz
[root@client ~]# tar xf prometheus-2.31.1.linux-amd64.tar.gz
[root@client ~]# cd prometheus-2.31.1
[root@client prometheus-2.31.1]# scp /root/prometheus-2.31.1/prometheus.yml 192.168.58.110:/opt/prometheus.yml
root@192.168.58.110's password:
prometheus.yml                                                                                                          100%  934    29.3KB/s   00:00
Run the prometheus container using the official image and map the port and directory files
# View profile

[root@master ~]# cat /opt/prometheus.yml
# my global config
global:
  scrape_interval: 15s # Set the scrape interval to every 15 seconds. Default is every 1 minute.
  evaluation_interval: 15s # Evaluate rules every 15 seconds. The default is every 1 minute.
  # scrape_timeout is set to the global default (10s).

# Alertmanager configuration
alerting:
  alertmanagers:
    - static_configs:
        - targets:
          # - alertmanager:9093

# Load rules once and periodically evaluate them according to the global 'evaluation_interval'.
rule_files:
  # - "first_rules.yml"
  # - "second_rules.yml"

# A scrape configuration containing exactly one endpoint to scrape:
# Here it's Prometheus itself.
scrape_configs:
  # The job name is added as a label `job=<job_name>` to any timeseries scraped from this config.
  - job_name: "prometheus"

    # metrics_path defaults to '/metrics'
    # scheme defaults to 'http'.

    static_configs:
      - targets: ["localhost:9090"]

# View mirror
[root@master ~]# docker images
REPOSITORY                                                        TAG             IMAGE ID       CREATED        SIZE
prom/prometheus                                                   latest          a3d385fc29f9   11 days ago    201MB

# Map ports and profiles to the host and set the container to start with docker startup
[root@master opt]# docker run -d --name prometheus --restart always -p 9090:9090 -v /opt/prometheus.yml:/etc/prometheus/prometheus.yml prom/prometheus
cb748d375af075241ea835c14a00896a8d94a3e05f911f8b88c155be9ae35980

[root@master opt]# docker ps | grep prometheus
cb748d375af0   prom/prometheus                                     "/bin/prometheus --c..."   7 seconds ago    Up 7 seconds    0.0.0.0:9090->9090/tcp, :::9090->9090/tcp   prometheus


# View container running status
[root@master ~]# docker ps | grep prometheus
933b88601ed6   prom/prometheus                                     "/bin/prometheus --c..."   10 minutes ago   Up 10 minutes   0.0.0.0:9090->9090/tcp, :::9090->9090/tcp   prometheus
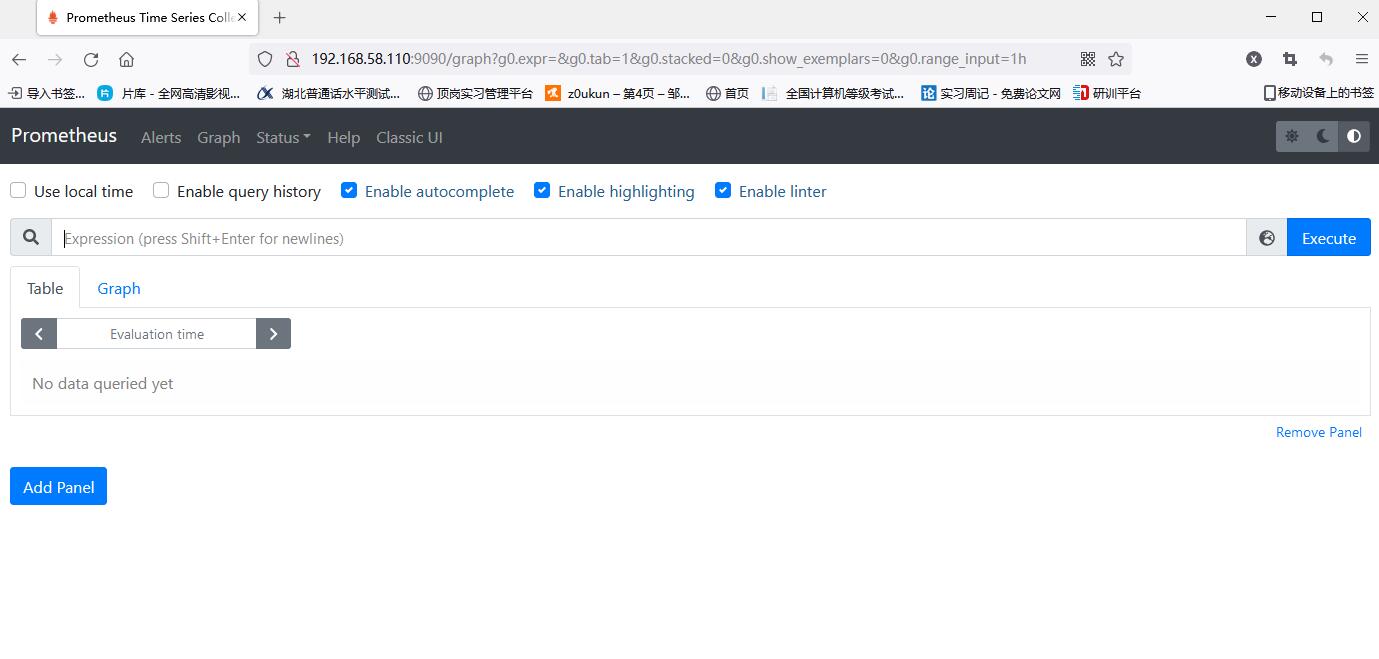
Web access (ip+prot)
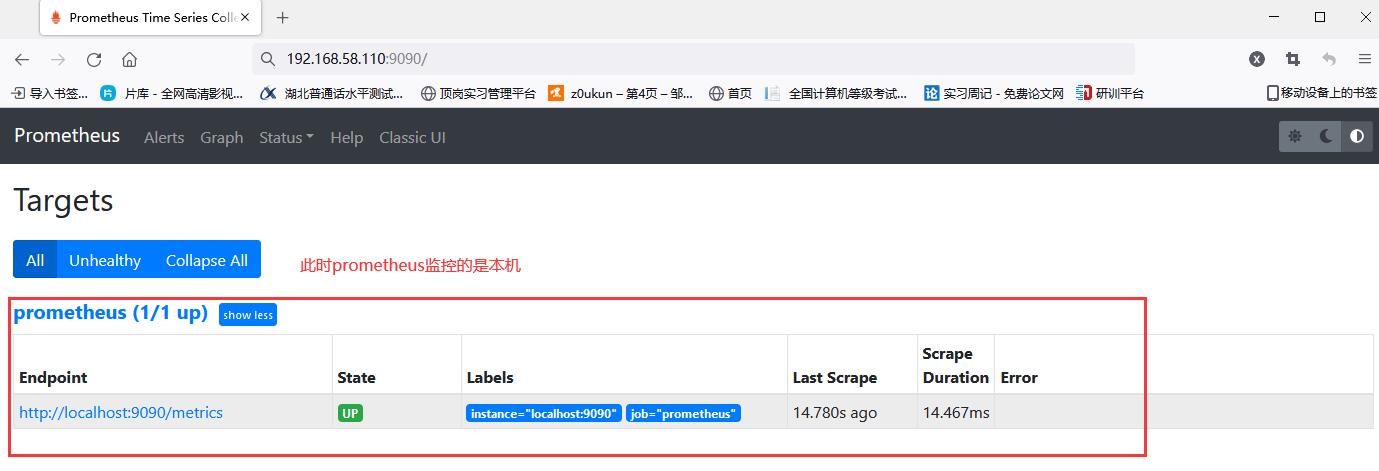
View the objects monitored by prometheus at this time
How to monitor other hosts (nodes)?
Prometheus can collect data from various components of Kubernetes cluster, such as cadvisor and API server in kubelet, and node export is one of the sources
Exporter is the general name of Prometheus data collection components. It is responsible for collecting data from the target and converting it into a format supported by Prometheus. Different from the traditional data acquisition component, it does not send data to the central server, but waits for the central server to crawl actively. The default crawl address is http://CURRENT_IP:9100/metrics
Node exporter is used to collect operation indicators at the server level, including basic monitoring such as loadavg, filesystem and meminfo of the machine, which is similar to ZABBIX agent in the traditional host monitoring dimension
Use the node exporter to collect information, and finally transmit the information to Prometheus, so as to realize the monitoring of different nodes.
Deploy node exporter on client host
Transfer the installation package to the client host, unzip it and rename it
[root@client ~]# ls
anaconda-ks.cfg  node_exporter-1.3.0.linux-amd64.tar.gz
[root@client ~]# tar xf node_exporter-1.3.0.linux-amd64.tar.gz -C /usr/local/
[root@client ~]# cd /usr/local/

[root@client local]# ls
bin  etc  games  include  lib  lib64  libexec  node_exporter-1.3.0.linux-amd64  prometheus  sbin  share  src
[root@client local]# mv node_exporter-1.3.0.linux-amd64/ node_exporter
[root@client local]# ls
bin  etc  games  include  lib  lib64  libexec  node_exporter  prometheus  sbin  share  src
Configure service file
[root@client ~]# vim /usr/lib/systemd/system/node_exporter.service
[unit]
Description=The node_exporter Server
After=network.target

[Service]
ExecStart=/usr/local/node_exporter/node_exporter
Restart=on-failure
RestartSec=15s
SyslogIdentifier=node_exporter

[Install]
WantedBy=multi-user.target

# Set self starting node_exporter
[root@client local]# systemctl daemon-reload && systemctl enable node_exporter && systemctl restart node_exporter
Created symlink /etc/systemd/system/multi-user.target.wants/node_exporter.service → /usr/lib/systemd/system/node_exporter.service.
View port (default 9100 port)
[root@client ~]# ss -anlt
State               Recv-Q               Send-Q                             Local Address:Port                             Peer Address:Port
LISTEN              0                    128                                      0.0.0.0:22                                    0.0.0.0:*
LISTEN              0                    128                                         [::]:22                                       [::]:*
LISTEN              0                    128                                            *:9100                                        *:*
Modify Prometheus. On the master host Yaml configuration file, adding nodes
[root@master ~]#  vi /opt/prometheus.yml
# my global config
global:
  scrape_interval: 15s # Set the scrape interval to every 15 seconds. Default is every 1 minute.
  evaluation_interval: 15s # Evaluate rules every 15 seconds. The default is every 1 minute.
  # scrape_timeout is set to the global default (10s).

# Alertmanager configuration
alerting:
  alertmanagers:
    - static_configs:
        - targets:
          # - alertmanager:9093

# Load rules once and periodically evaluate them according to the global 'evaluation_interval'.
rule_files:
  # - "first_rules.yml"
  # - "second_rules.yml"

# A scrape configuration containing exactly one endpoint to scrape:
# Here it's Prometheus itself.
scrape_configs:
  # The job name is added as a label `job=<job_name>` to any timeseries scraped from this config.
  - job_name: "prometheus"

    # metrics_path defaults to '/metrics'
    # scheme defaults to 'http'.

    static_configs:
      - targets: ["localhost:9090"]
  - job_name: "Linux Server"  //Add here
    static_configs:                    //Add here
      - targets: ["192.168.58.20:9100"]   //Add here to add node_ Host IP of exporter + 9100
Restart container
[root@master ~]# systemctl restart docker
[root@master ~]# docker ps | grep prometheus
cb748d375af0   prom/prometheus                                     "/bin/prometheus --c..."   3 minutes ago   Up 3 seconds   0.0.0.0:9090->9090/tcp, :::9090->9090/tcp   prometheus
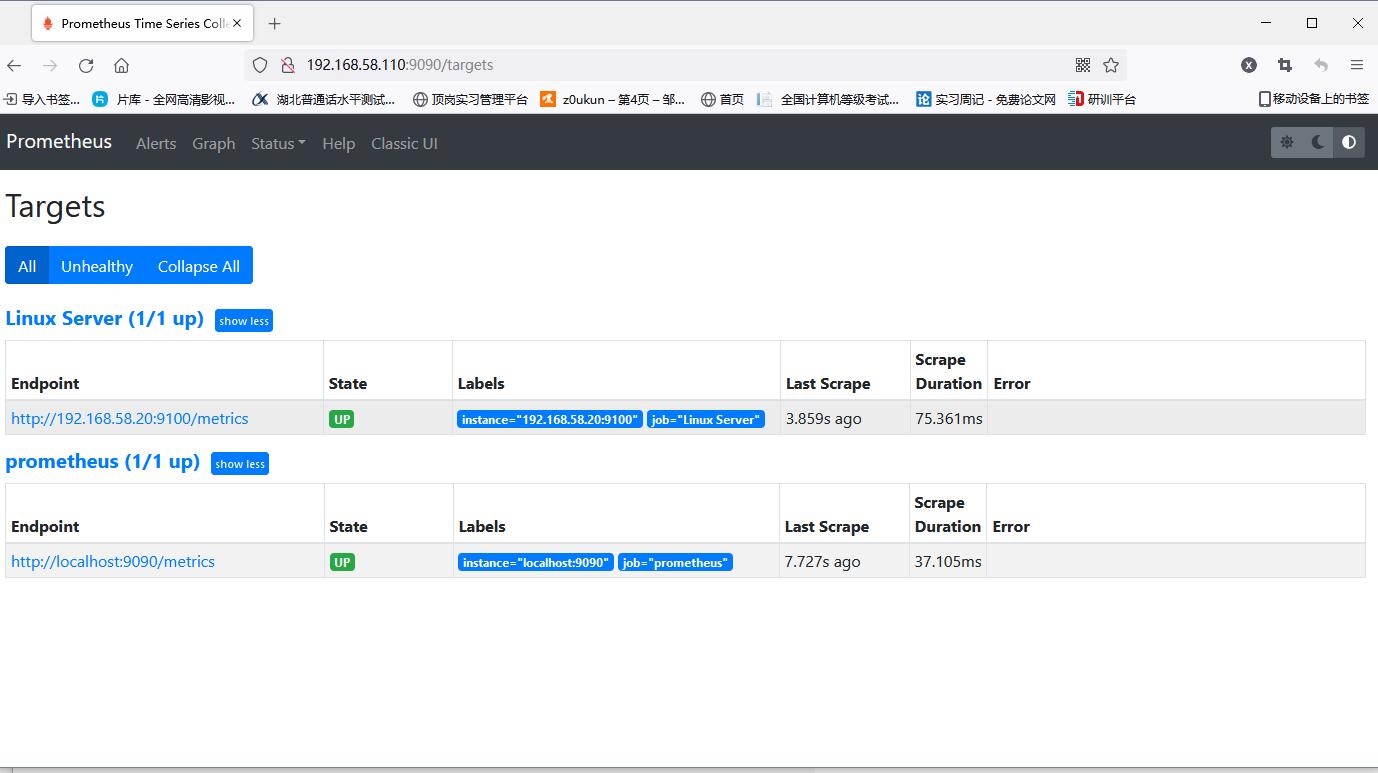
Visit again to find new node information
Use Grafan to visualize the monitored node information
Grafan container deployment
Pull the official image of grafan/grafan
[root@master ~]# docker pull grafana/grafana
Using default tag: latest
latest: Pulling from grafana/grafana
97518928ae5f: Pull complete
5b58818b7f48: Pull complete
d9a64d9fd162: Pull complete
4e368e1b924c: Pull complete
867f7fdd92d9: Pull complete
387c55415012: Pull complete
07f94c8f51cd: Pull complete
ce8cf00ff6aa: Pull complete
e44858b5f948: Pull complete
4000fdbdd2a3: Pull complete
Digest: sha256:18d94ae734accd66bccf22daed7bdb20c6b99aa0f2c687eea3ce4275fe275062
Status: Downloaded newer image for grafana/grafana:latest
docker.io/grafana/grafana:latest
Run the grafan container using an image and map ports to provide services
[root@master ~]# docker images
REPOSITORY                                                        TAG             IMAGE ID       CREATED        SIZE
prom/prometheus                                                   latest          a3d385fc29f9   11 days ago    201MB
grafana/grafana                                                   latest          9b957e098315   2 weeks ago    275MB

[root@master ~]# docker run -dit --name grafan -p 3000:3000 grafana/grafana
2a068867c04d57aa67ece4d35f28e2a77f188c248de6a43bc071a9bb21aae417
[root@master ~]# docker ps | grep grafan
2a068867c04d   grafana/grafana                                     "/run.sh"                11 seconds ago   Up 8 seconds   0.0.0.0:3000->3000/tcp, :::3000->3000/tcp   grafan
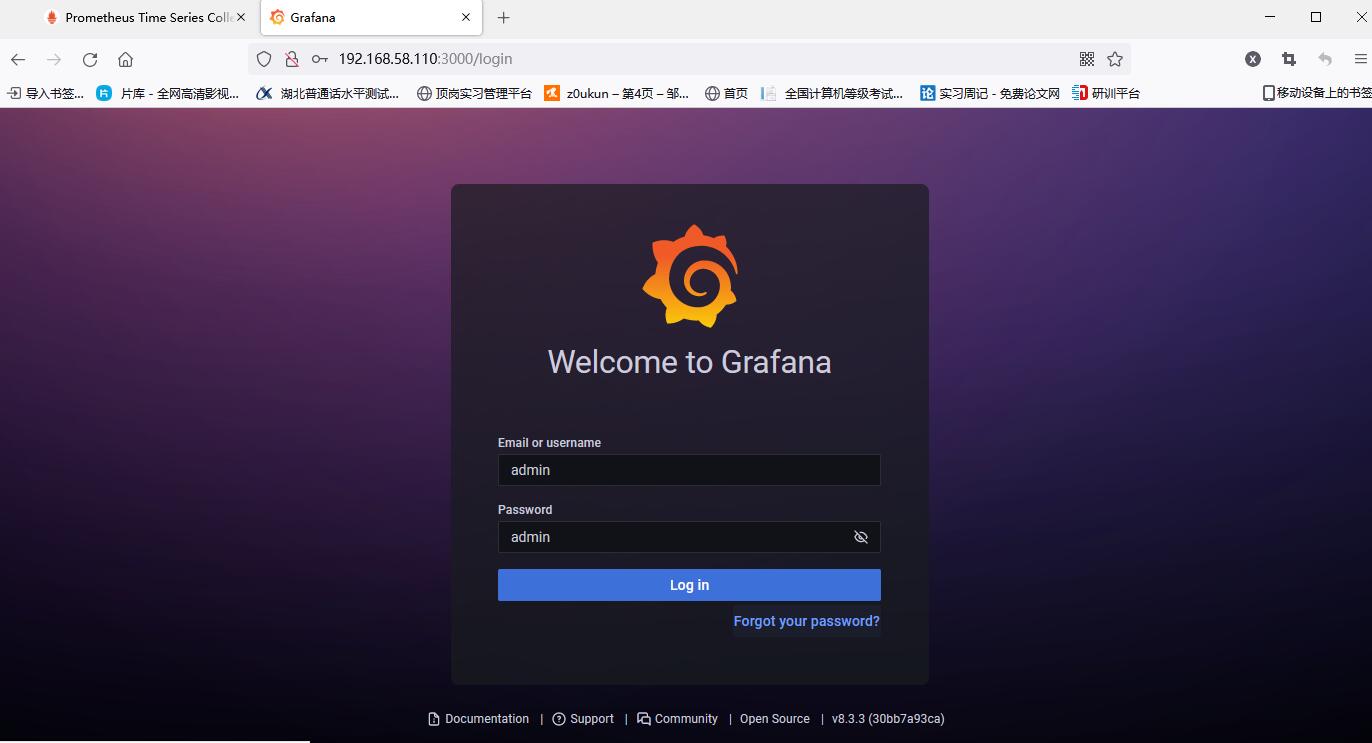
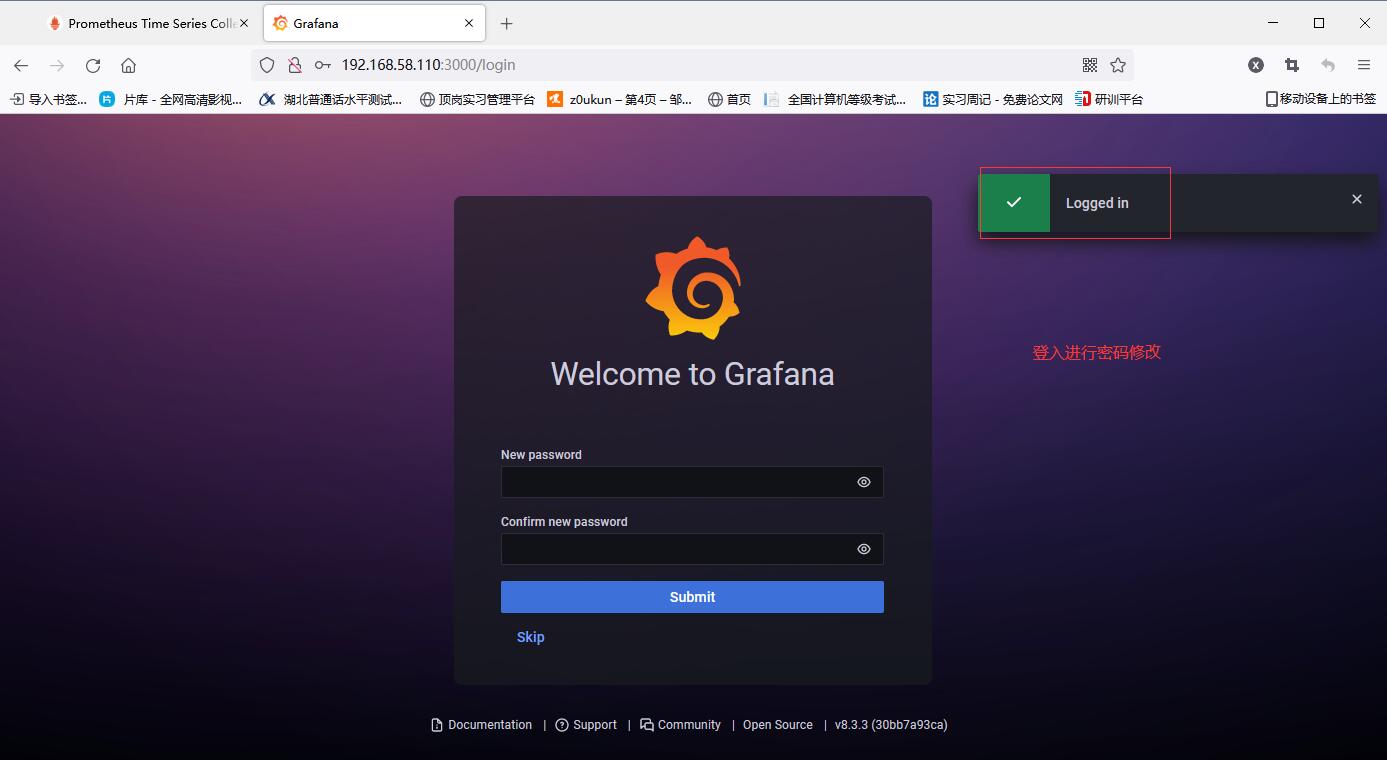
Access home (ip+3000 port number)
The first time you log in, you need to change your password
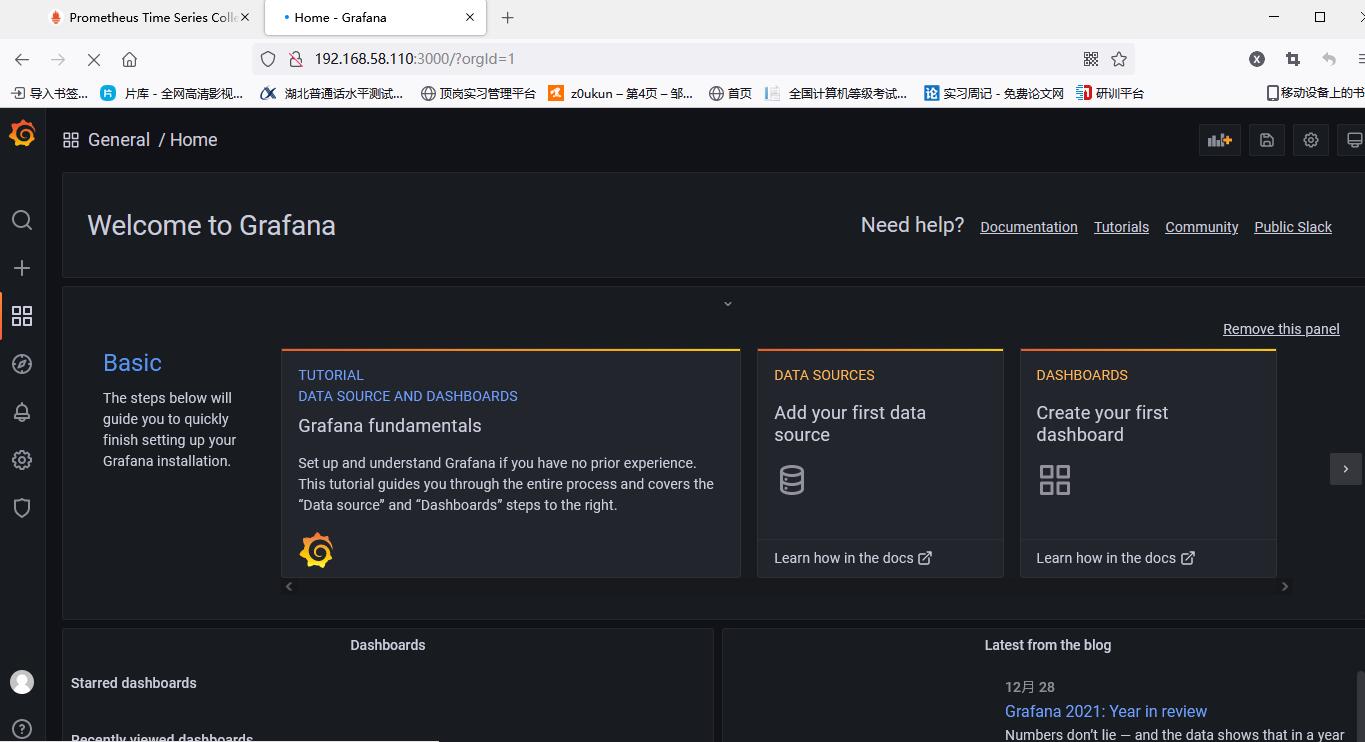
After changing the password, enter the home page
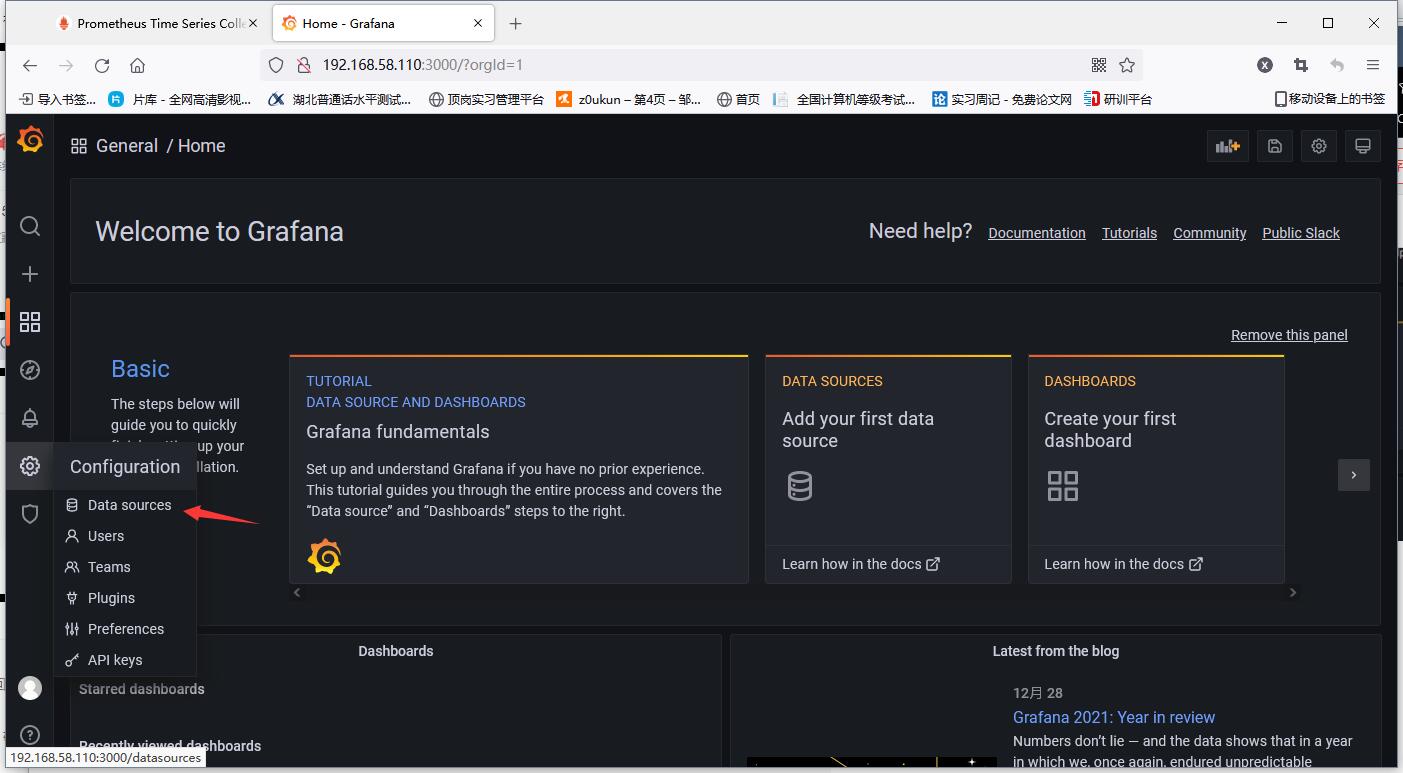
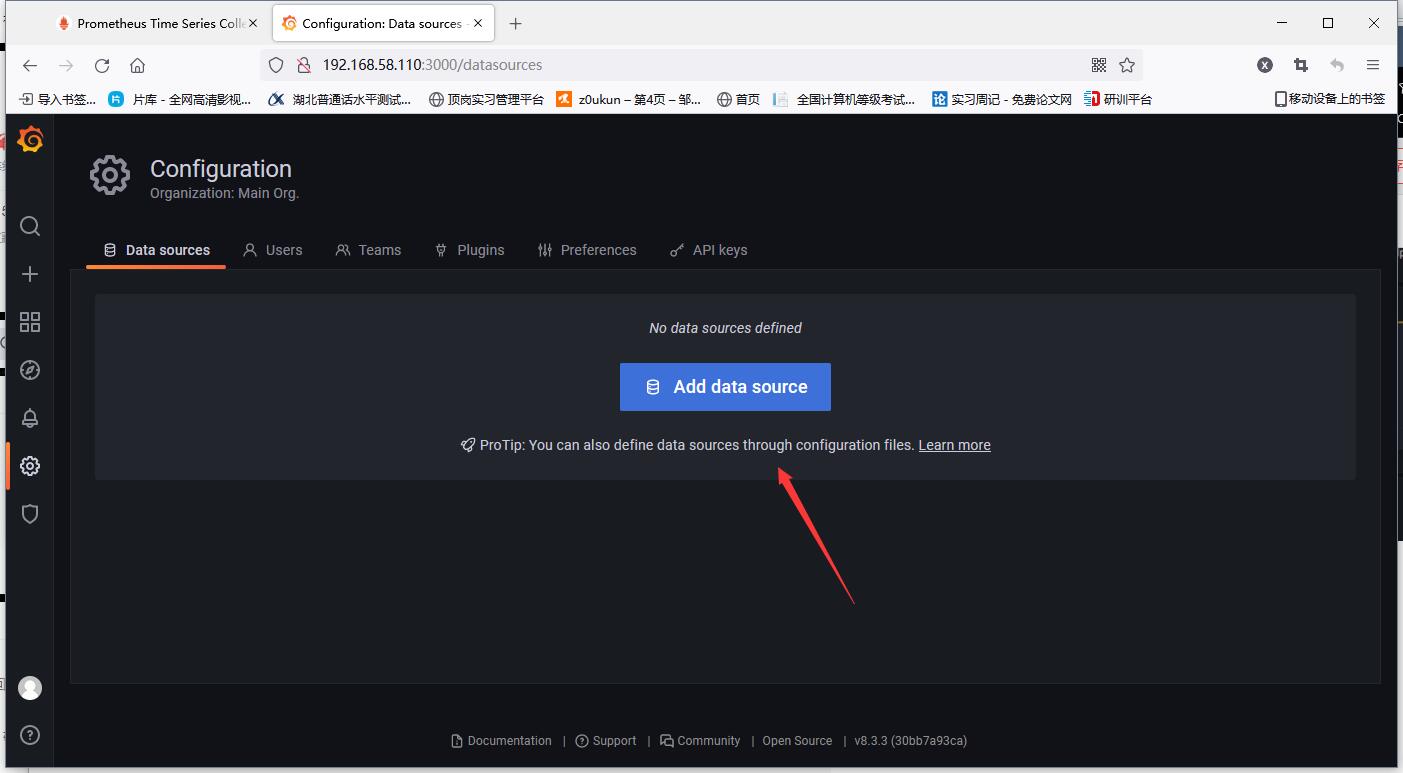
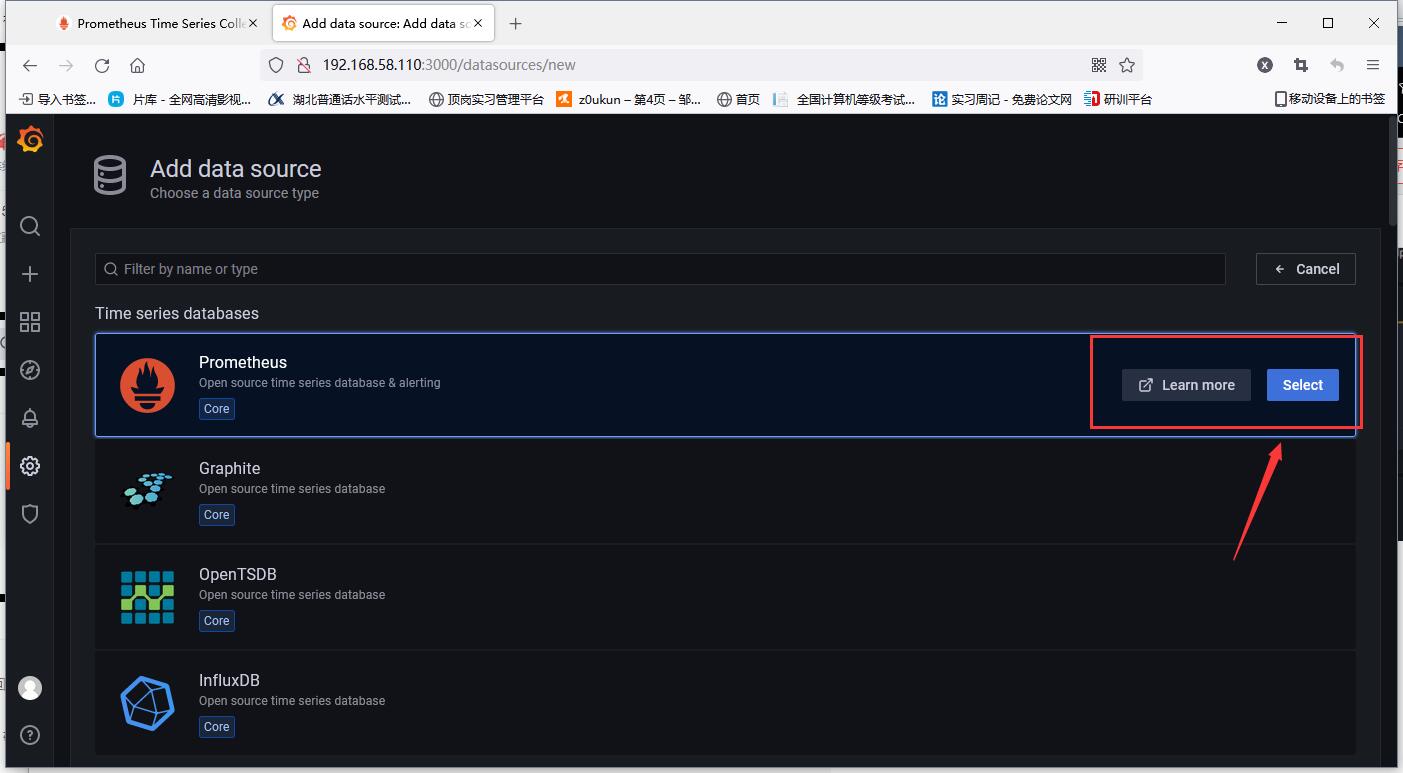
Add prometheus data source (that is, the access address of prometheus)
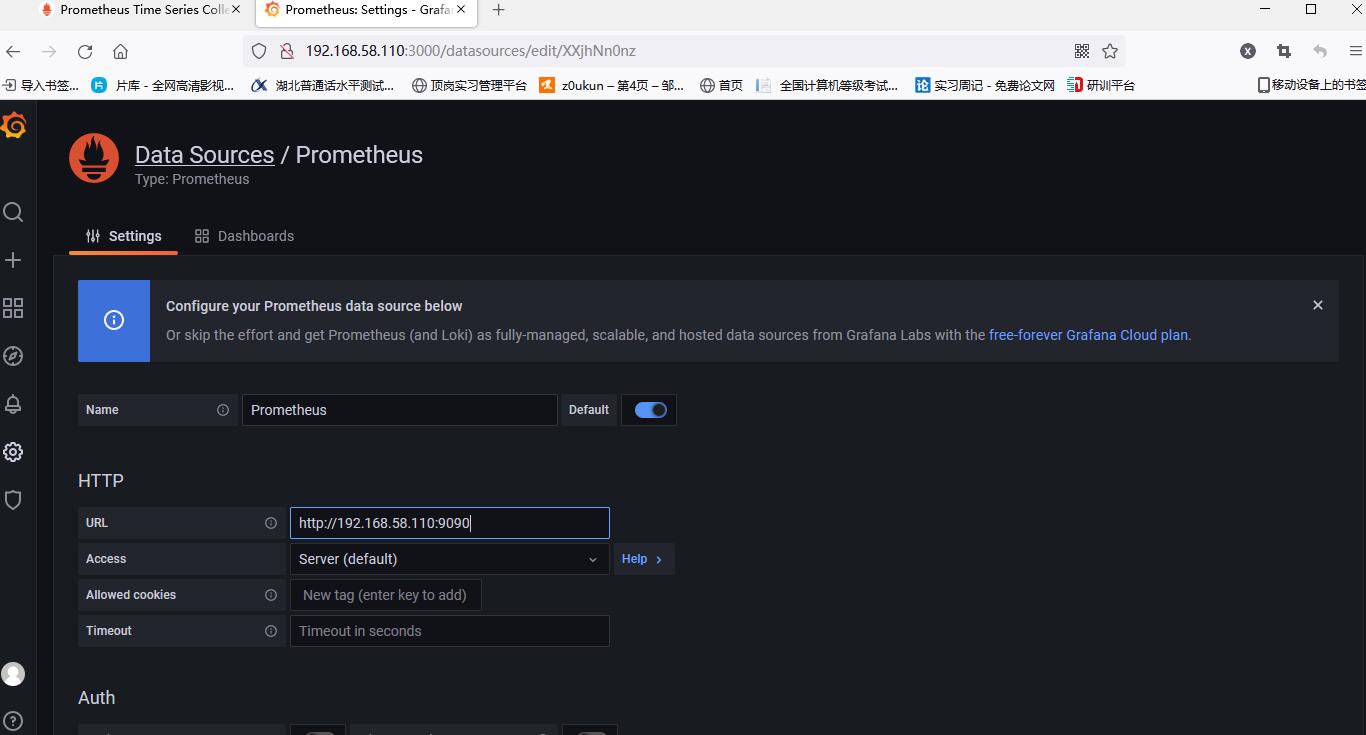
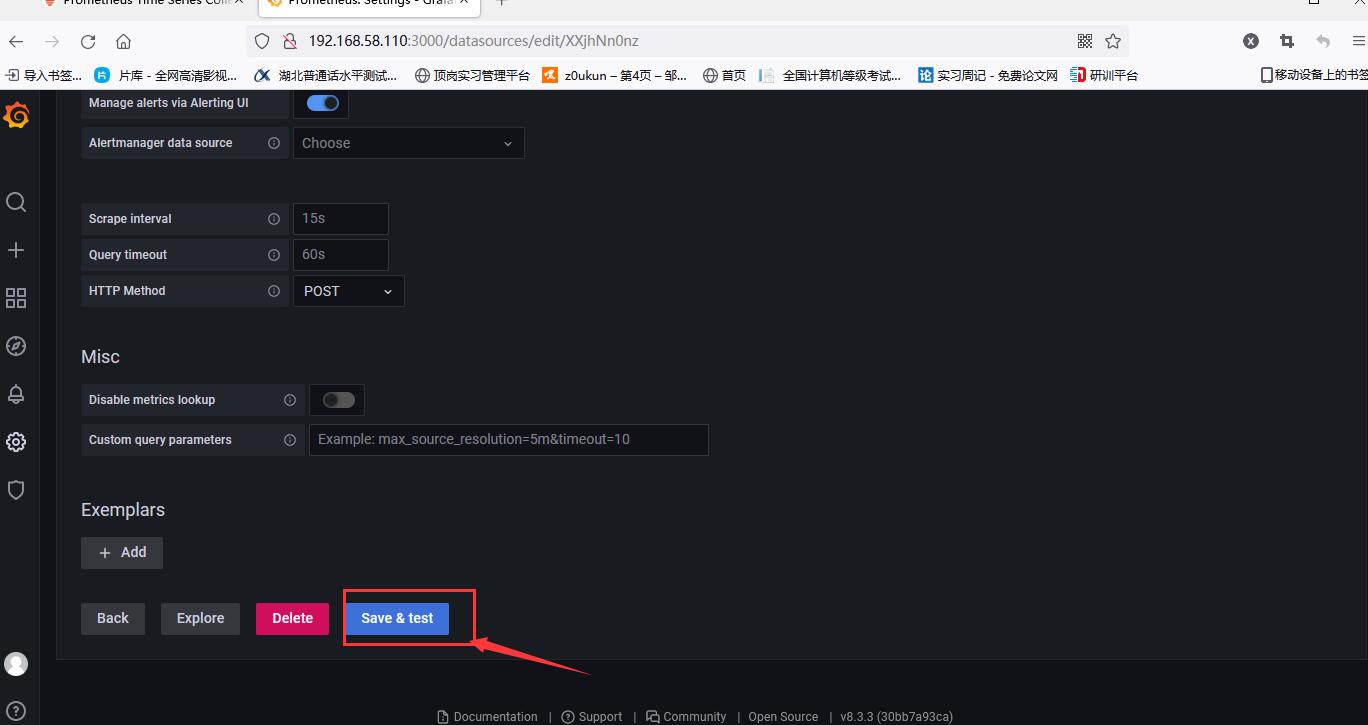
After filling in, tick down, click save and test
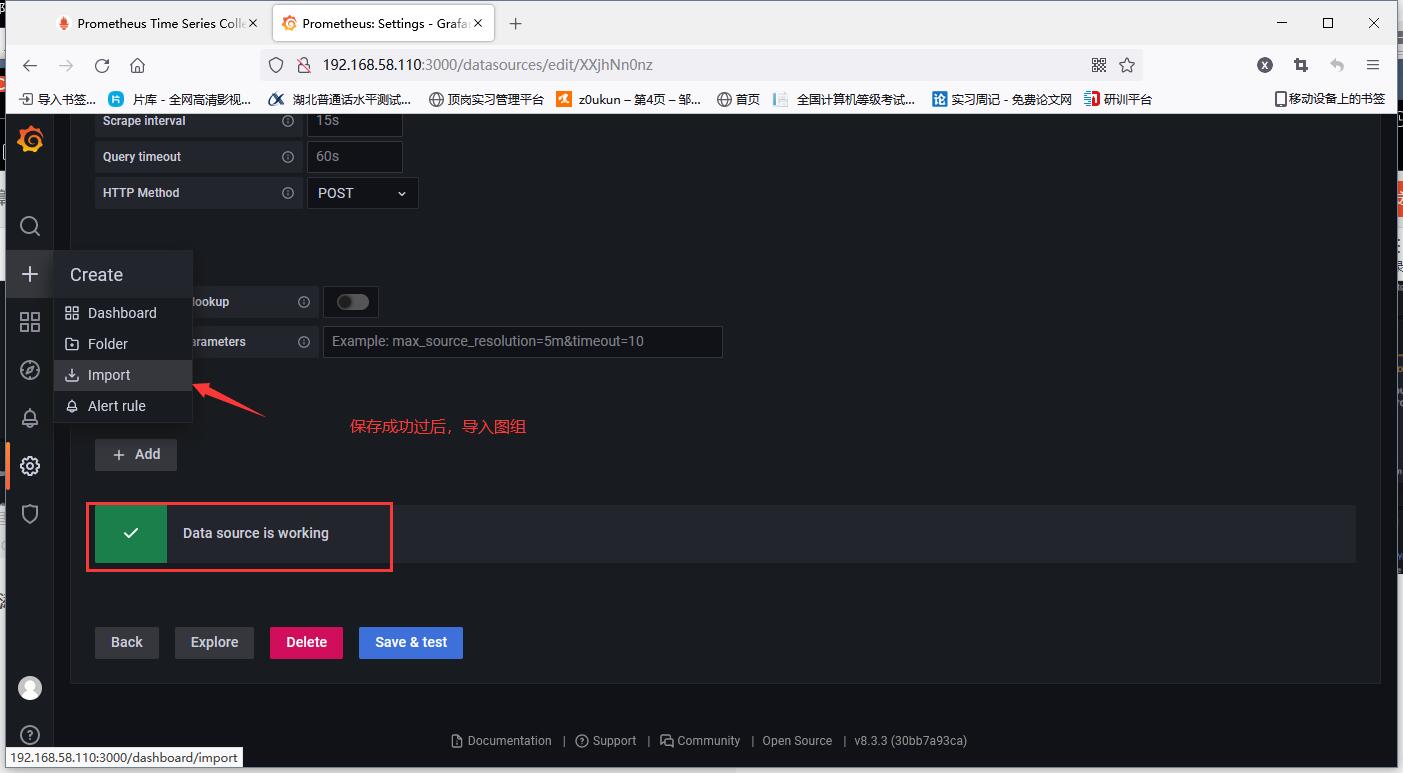
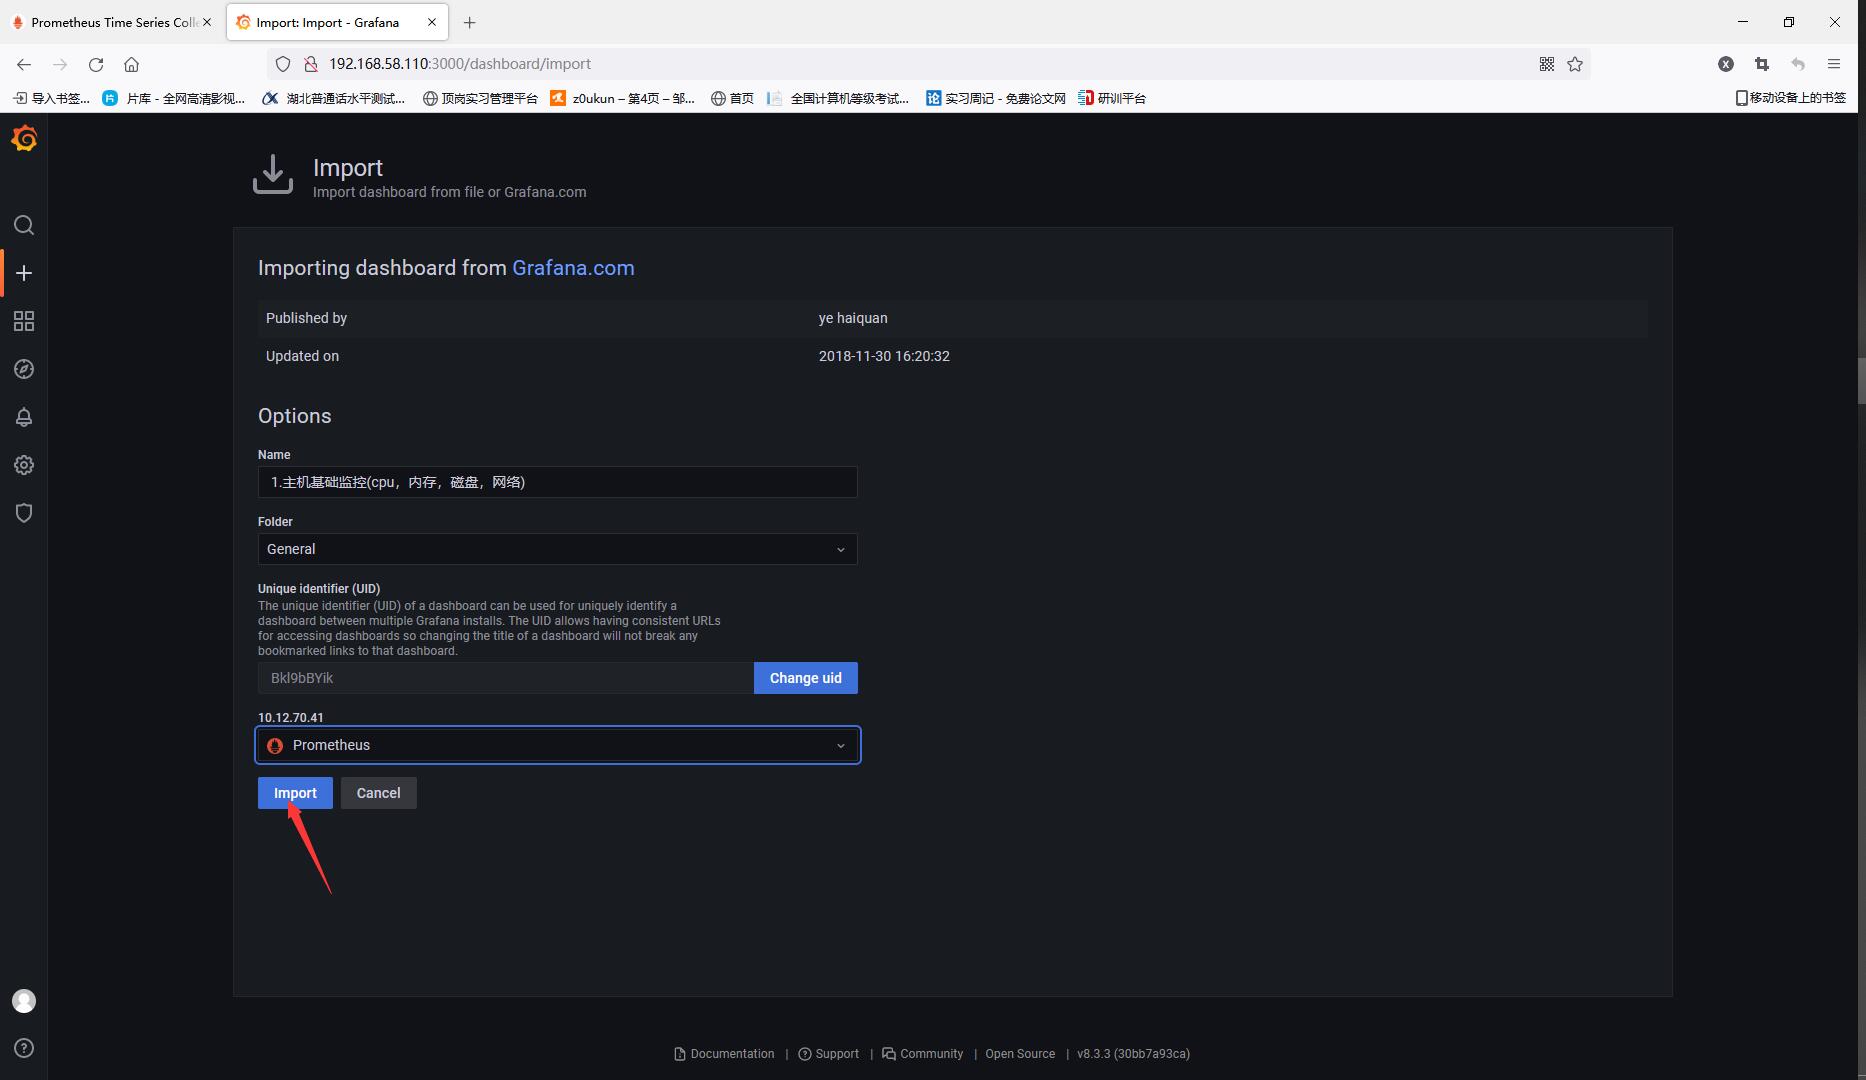
Import the chart after saving successfully
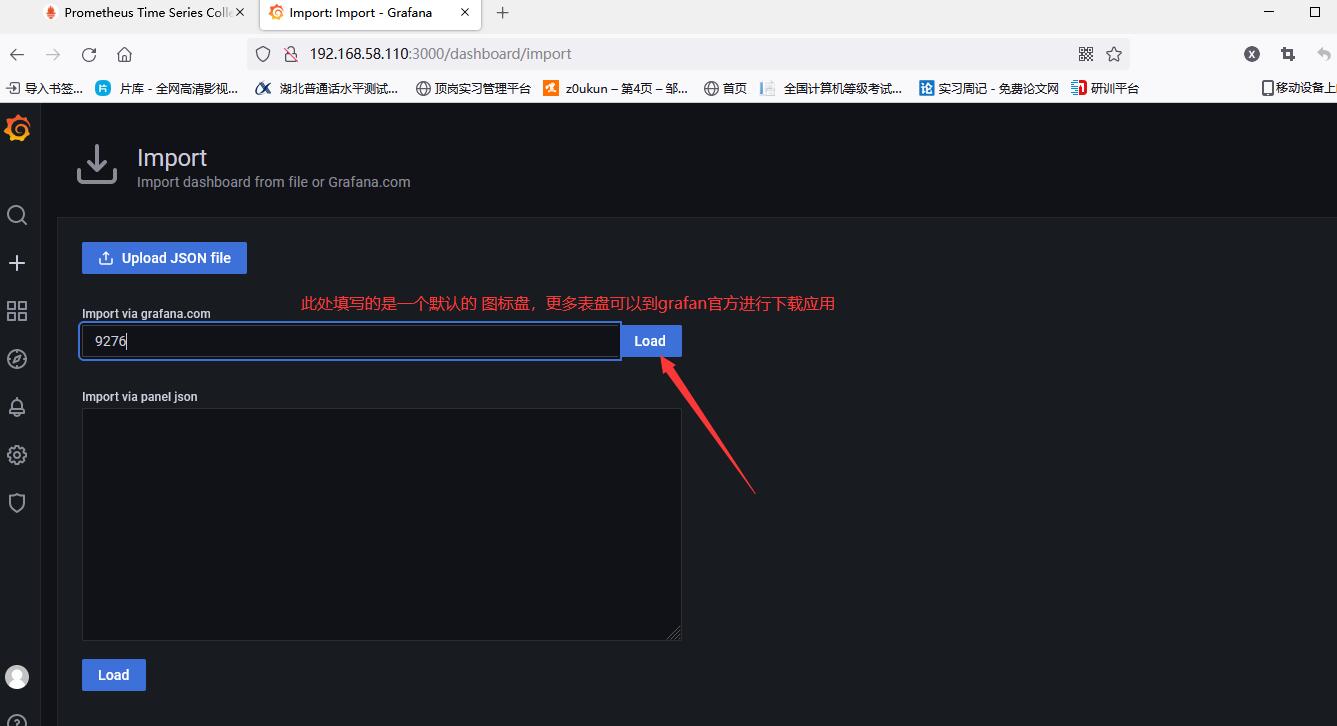
Select data source
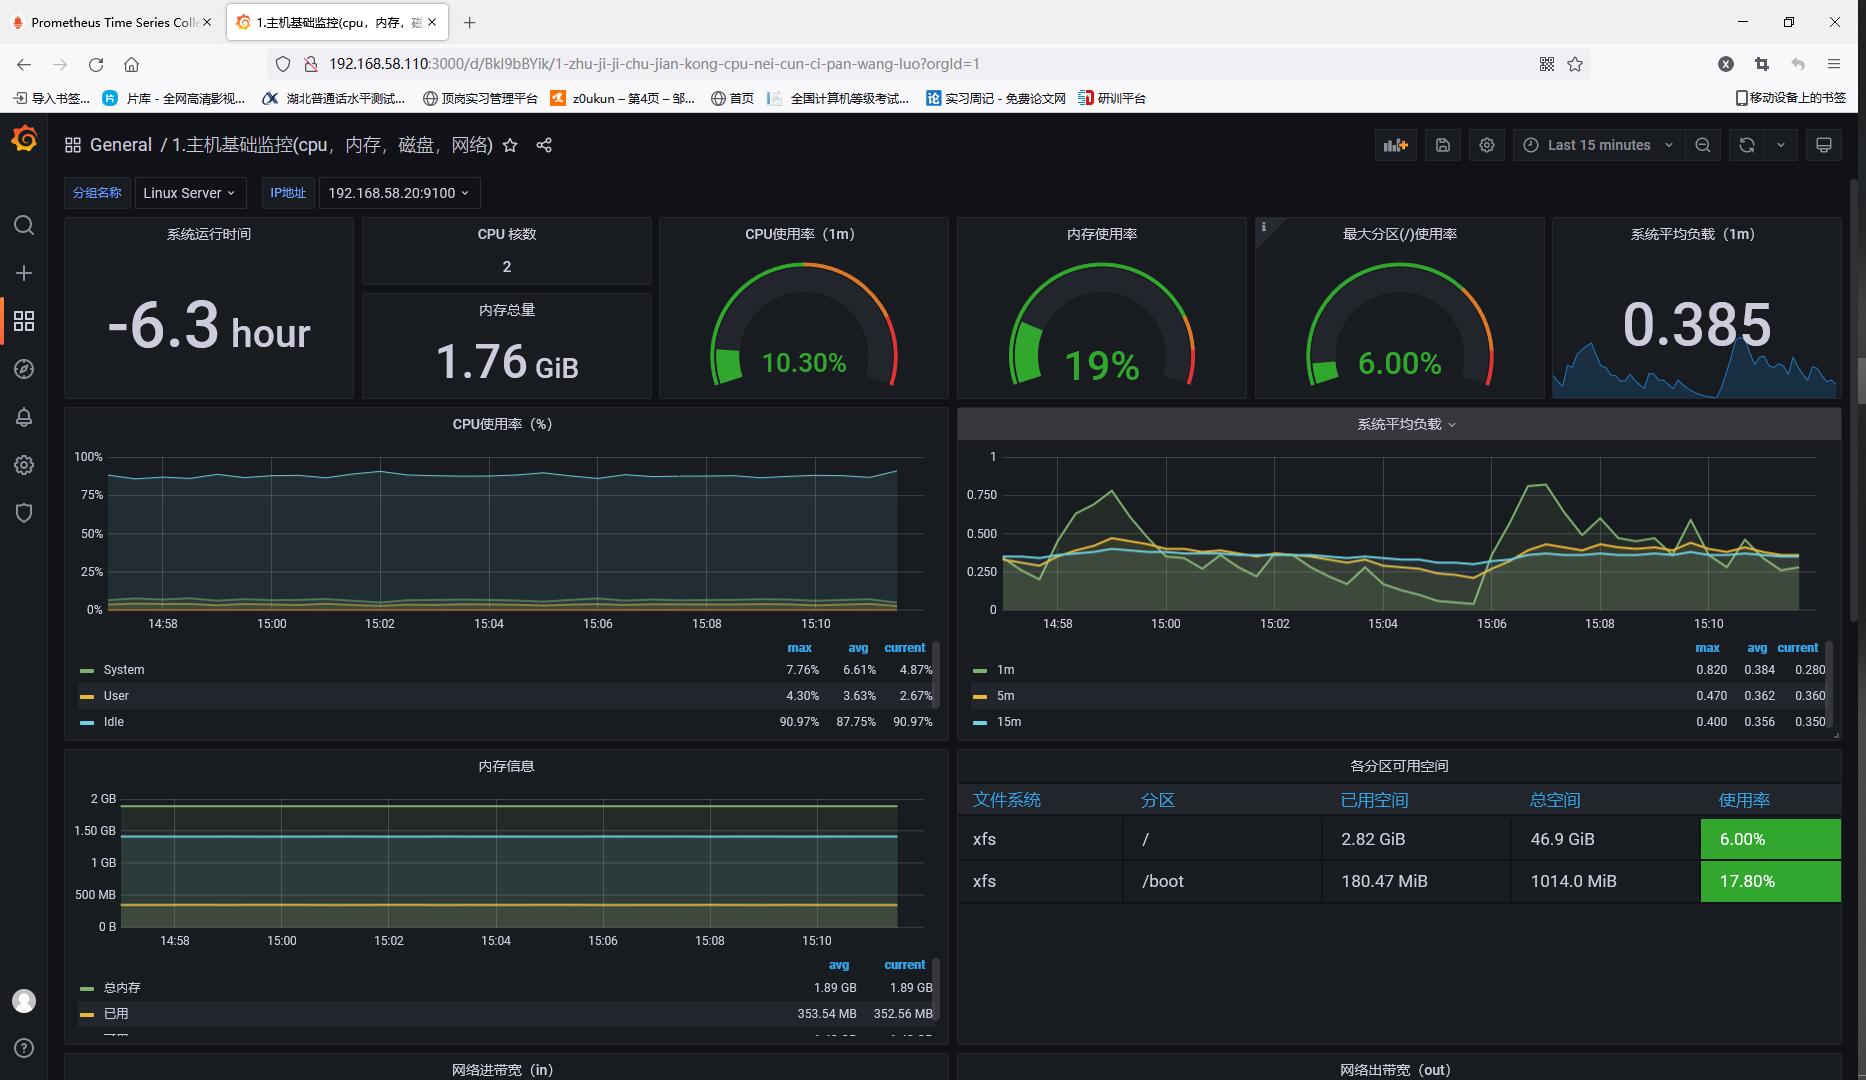
To customize grafan operations, please read Custom chart