Earlier, we introduced the basic concepts of Prometheus, including data format and PromQL syntax. In this section, we will explain how to realize host monitoring through Prometheus.
Prometheus uses various exporters to monitor resources. The Exporter can be regarded as the agent side of monitoring. It is responsible for collecting the indicators of corresponding resources and providing an interface to Prometheus for reading. The monitoring of different resources corresponds to different exporters, such as node Exporter, MySQL Exporter, Kafka Exporter, etc. the most commonly used one is node_exporter.
Node exporter is written in Go language. It is mainly used to monitor various performance parameters of the host system, collect libraries of various host indicators, and provide textfile function to customize indicators.
1, Install node exporter
Binary installation
Download the installation package and unzip it
$ wget https://github.com/prometheus/node_exporter/releases/download/v1.1.2/node_exporter-1.1.2.linux-amd64.tar.gz
$ tar -xvf tar -xvf node_exporter-1.1.2.linux-amd64.tar.gz
$ cd node_exporter-1.1.2.linux-amd64
Start Node Exporter
$ ./node_exporter &
Viewing the server, you can see that the port is started (default port 9100)
$ netstat -lnpt  |grep ":9100"
tcp6       0      0 :::9100                 :::*                    LISTEN      2345/./node_exporte
docker installation
The official does not recommend deploying node exporter through Docekr because it needs to access the host system. Through docker deployment, you need to bind any non root installation point to the container and specify it through the -- path.rootfs parameter.
Pull image
$ docker pull prom/node-exporter
Start container
$ docker run -d --net="host" --pid="host" -v "/:/host:ro,rslave" prom/node-exporter --path.rootfs=/host
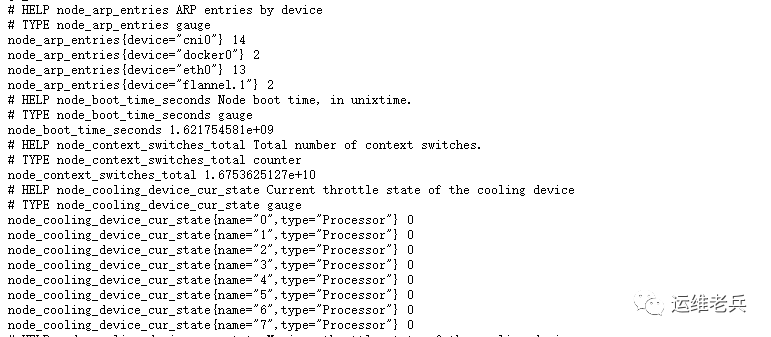
After deployment, access the node address: http://ip:9100/metrics , you can see the indicators obtained by the node exporter.
II Configure node exporter
Node exporter provides many configuration parameters, which can be viewed with -- help.
$ ./node_exporter --help
For example, change the listening port through -- web.listen-address
$ ./node_exporter --web.listen-address=":8080" &
If you need to collect the status of services running on the host, you can enable the SYSTEMd collector. Because there are many SYSTEMd indicators, you can use the -- collector.systemd.unit-include parameter to configure to collect only the specified services to reduce useless data. This parameter supports regular expression matching. Such as docker and ssh service status,
Example:
./node_exporter --collector.systemd --collector.systemd.unit-include="(docker|sshd).service" &
If you only want to enable the required collectors and disable all others, you can configure them in the following format
--collector.disable-defaults --collector.<name>
III textfile collector
textfile is a specific collector. Its function is very useful. textfile allows us to expose custom indicators. These indicators either have no relevant exporter to use, or are application indicators developed by yourself.
textfile scans the files in the specified directory, extracts all strings conforming to Prometheus data format, and then exposes them to Prometheus for grabbing.
Example:
Create index file save directory
$ mkdir /opt/prom
Write the index file. Here we write it manually
$ cat <<EOF | tee /opt/prom/metadata.prom
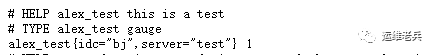
# HELP alex_test this is a test
# TYPE alex_test gauge
alex_test{server="test",idc="bj"} 1
EOFEnable textfile
./node_exporter --collector.textfile.directory="/opt/prom" &
Visit the node exporter address to see that the indicator has taken effect
4, Prometheus grab index
Configure the target of node exporter node in Prometheus to capture the index data of relevant nodes.
 - job_name: 'node-exporter'
    static_configs:
    - targets:
      -  'locahost:9100'
Instance grabbing is normal
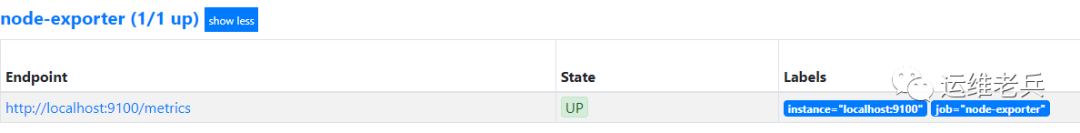
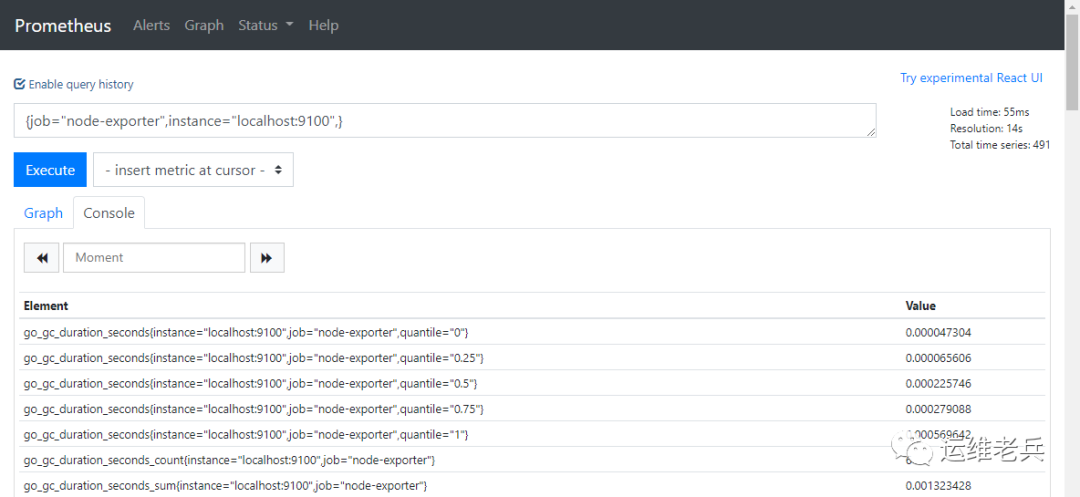
Search {job = "node exporter", instance = "localhost: 9100"} in the expression browser to see that relevant indicators have been collected in Prometheus.
Focus on Devops technology sharing, welcome to pay attention to the official account of "personal operation and maintenance veterans".