catalogue
1, Introduction to Prometheus monitoring
2, Introduction to Grafana visual monitoring
3, Prometheus monitoring server (default port: 9090)
4, Prometheus monitored node_exporter (default port 9100)
5, Prometheus monitoring Alertmanager (default port 9093)
Vi MySQL monitored by Prometheus (default port 9104)
VII Redis monitored by Prometheus (default port 9121)
8, Grafana monitored by Prometheus (default port 3000)
9, Mail alarm monitored by Grafana
1, Introduction to Prometheus monitoring
1. The mainstream market monitoring system is basically open source:
l) data acquisition: collect monitoring data
l) data storage: persistent storage of monitoring data for duration query
l) data analysis: data is processed on demand, such as threshold comparison and aggregation
l) data display: Web page display
l) monitoring alarm: telephone, email, wechat, short message
The Prometheus of the monitoring system is similar to a registry. We only need to configure one Prometheus, while on other servers, we only need to install node_exporter, their data flow is to collect data information through the exporter, and then tell Prometheus its location. The monitoring information can be seen at the promethues control end.
2. Common node nodes:
node_ Default port of exporter: 9100 / / system level monitoring (such as server information, cup, memory, hard disk, network, etc.)
mysql default port: 9104 //mysql monitoring node
Redis default port: 9121 //redis monitoring node
alertmanager default port: 9093 / / warning monitoring node
3. Reference documents: Construction of Prometheus+Grafana monitoring system of grafana monitoring system_ Dark Yu's blog - CSDN blog_ Grafana monitoring
Refer to: prometheus - Introduction and installation - cloud + community - Tencent cloud
2, Introduction to Grafana visual monitoring
Grafana is a cross platform open source measurement analysis and visualization tool, which can query the collected data, then visually display it, and notify it in time. It mainly has the following six characteristics:
Display mode: fast and flexible client-side charts, panel plug-ins have many different visual indicators and logs, and there are rich dashboard plug-ins in the official library, such as heat map, line chart, chart and other display modes;
Data sources: Graphite, InfluxDB, OpenTSDB, Prometheus, Elasticsearch, CloudWatch, KairosDB, etc;
Notification reminder: define the alarm rules of the most important indicators in a visual way. Grafana will continuously calculate and send notifications, and get notifications through Slack, PagerDuty, etc. when the data reaches the threshold;
Mixed display: mix different data sources in the same chart. You can specify data sources based on each query or even customize data sources;
Note: using rich event annotation charts from different data sources, hovering the mouse over the event will display complete event metadata and tags;
Filters: ad hoc filters allow dynamic creation of new key / value filters, which are automatically applied to all queries using the data source.
Prometheus stores the information of the exporter for grafana to inquire; Grafana is responsible for the display of information; Therefore, only one Prometheus can be configured, and the exporters of other servers or local servers only need to give their jobs in this Prometheus_ Name, targets, address and other information;
In short, it is a multi-purpose monitoring tool. At the same time, it carries out effective early warning notification through e-mail, rich and intuitive visual interface, and multiple data source configurations are its advantages; Prometheus is used as an intermediate point, Grafana is used as a visual display, and the latter exporter is used as a monitor. The exporter obtains and connects the data to be obtained to Prometheus, while Prometheus is connected to Grafana to visually display the status of the monitored person;
3, Prometheus monitoring server (default port: 9090)
1. prometheus server installation
Download address of official website: Download | Prometheus
Demo link Download: https://github.com/prometheus/prometheus/releases/download/v2.33.3/prometheus-2.33.3.linux-amd64.tar.gz
2. Download the version and extract it to the specified directory
[root@CentOS7-0001 install]# wget -r -p -np -k -nc -c https://github.com/prometheus/prometheus/releases/download/v2.33.3/prometheus-2.33.3.linux-amd64.tar.gz
[root@CentOS7-0001 install]# tar -zxvf prometheus-2.33.3.linux-amd64.tar.gz -C /srv/thinkive/software
3. Profile modification
prometheus. In the prometheus installation directory YML is a configuration file in yaml format, which is divided into global, alerting and rule_files and clips_ Configs consists of four parts:
Global: global parameter configuration;
alerting: alarm service address;
rule_files: alarm and recording rules;
scrape_configs: data collection address
Where rule_files and clips_ Configs is the focus. The latter supports a variety of dynamic discovery methods, which are more complex.
4. Refer to the default configuration.
#Global configuration
global:
  scrape_interval:     15s # Set the capture interval, which is 1 minute by default
  evaluation_interval: 15s #The default period of the estimation rule is calculated every 15 seconds. Default 1 minute
  # scrape_timeout  #The default capture timeout is 10s

#Alertmanager alarm related configuration
alerting:
  alertmanagers:
  - static_configs:
    - targets:
      # - alertmanager:9093

#List of rule files, using 'evaluation'_ 'interval' parameter to grab
rule_files:
    #- "first_rules.yml"
    #- "second_rules.yml"

#  Grab configuration list
scrape_configs:
  - job_name: 'prometheus'
    static_configs:
    - targets: ['192.168.65.56:9090']
5. Enter the prometheus directory to start
[root@CentOS7-0001 /]# cd /srv/thinkive/software/prometheus-2.33.3/
[root@CentOS7-0001 prometheus-2.33.3]# ./prometheus --config.file=prometheus.yml
6. Common command extensions:
[root@CentOS7-0001 prometheus-2.33.3]# ../prometheus --config.file=prometheus.yml / / the foreground starts
[root@CentOS7-0001 prometheus-2.33.3]# nohup ./ prometheus --config. file=prometheus. yml --web. enable-lifecycle > prometheus. Out 2 > & 1 & / / start in the background
[root@CentOS7-0001 prometheus-2.33.3]# ./promtool check config prometheus.yml / / detect configuration file
[root@CentOS7-0001 prometheus-2.33.3]# curl -X POST  http://127.0.0.1:9090/ -/Quit / / graceful shutdown
[root@CentOS7-0001 prometheus-2.33.3]# curl -X POST  http://127.0.0.1:9090/ -/Reload / / hot load
[root@CentOS7-0001 prometheus-2.33.3]# netstat -lnp | grep 9090 / / view the running status
[root@CentOS7-0001 prometheus-2.33.3]# curl  http://127.0.0.1:9090/metrics //Crul test
7. Access verification
After installing and starting prometheus Browser input http://192.168.65.56:9090/graph To access prometheus, and the visual interface appears, indicating that the installation is successful.
8. Set prometheus as system service
8.1. Make Prometheus in the form of soft connection
[root@CentOS7-0001 prometheus-2.33.3]# ln -s /srv/thinkive/software/prometheus-2.33.3 /usr/local/prometheus
8.2. Create Prometheus data store directory
[root@CentOS7-0001 prometheus-2.33.3]# mkdir -p /var/lib/prometheus
8.3. Add Prometheus to the system management program
Create a new prometheus.com directory in / etc/systemd/system / Service file, write content, copy and execute
[root@CentOS7-0001 prometheus-2.33.3]# cat >/etc/systemd/system/prometheus.service <<EOF

[Unit]
Description=Prometheus
Documentation=https://prometheus.io/
After=network.target

[Service]
Type=simple

# --storage.tsdb.path is optional. The default data directory is in the running directory/ dada directory
ExecStart=/usr/local/prometheus/prometheus --config.file=/usr/local/prometheus/prometheus.yml --storage.tsdb.path=/var/lib/prometheus
Restart=on-failure

[Install]
WantedBy=multi-user.target
EOF
8.4. Start prometheus service
[root@CentOS7-0001 system]# Systemctl daemon reload / / reload system services
[root@CentOS7-0001 system]# systemctl start prometheus.service / / start the Prometheus service
4, Prometheus monitored node_exporter (default port 9100)
You can right-click the latest version in the release of github to get the download link
1. Download the version and extract it to the specified directory
[root@CentOS7-0001 install]#wget -r -p -np -k -nc -c https://github.com/prometheus/node_exporter/releases/download/v0.17.0/node_exporter-0.17.0.linux-amd64.tar.gz [root@CentOS7-0001 install]# tar -zxvf node_exporter-0.17.0.linux-amd64.tar.gz -C /srv/thinkive/software/
2. Enter node_exporter directory startup
[root@CentOS7-0001 /]# cd /srv/thinkive/software/node_exporter-0.17.0.linux-amd64/
[root@CentOS7-0001 node_exporter-0.17.0.linux-amd64]# ls
LICENSE node_exporter nohup.out NOTICE
[root@CentOS7-0001 node_exporter-0.17.0.linux-amd64]# ./node_exporter
You can use nohup to start in the background.
3. Access verification
Install and start node_ After the exporter, the default port is 9100, and the command can be executed: curl http://l192.168.65.56/metrics Verify that the data returned indicates normal.
4. Add the address of this exporter to the configuration file of Prometheus
Enter the Prometheus installation directory
[root@CentOS7-0001 /]# cd /srv/thinkive/software/prometheus-2.33.3/
Edit the profile Prometheus yml
scrape_ Add target under the configs node, as follows:
- job_name: 'server56'
    static_configs:
    - targets: ['192.168.65.56:9100']
5. Restart Prometheus to view the monitoring data information
The monitoring information can be viewed in Prometheus: http://192.168.65.56:9090/graph
5, Prometheus monitoring Alertmanager (default port 9093)
The alarm capability is divided into two independent parts in the Prometheus architecture. By defining AlertRule in Prometheus, Prometheus will periodically calculate the alarm rules. If the alarm trigger conditions are met, Prometheus will send alarm information to Alertmanager. Prometheus is responsible for generating the alarm, and Alertmanager is responsible for the subsequent processing after the alarm is generated. Therefore, after the deployment of Alertmanager is completed, you need to set the information related to Alertmanager in Prometheus.
1. Download the version and extract it to the specified directory
[root@CentOS7-0001 install]# wget -r -p -np -k -nc -c https://github.com/prometheus/alertmanager/releases/download/v0.22.1/alertmanager-0.22.1.linux-amd64.tar.gz [root@CentOS7-0001 install]# tar -zxvf node_exporter-0.17.0.linux-amd64.tar.gz -C /srv/thinkive/software/
2. Enter the Alertmanager directory to start
Specify profile startup:
Users can also use parameters to modify relevant configurations when starting Alertmanager.
--config.file is used to specify the path of alertmanager configuration file,
--storage.path is used to specify the data storage path.
[root@CentOS7-0001 alertmanager-0.22.1.linux-amd64]# ./alertmanager --config.file=alertmanager.yml --storage.path=data/
Other startup methods:
[root@CentOS7-0001 alertmanager-0.22.1.linux-amd64]# . / alertmanager / / normal startup
[root@CentOS7-0001 alertmanager-0.22.1.linux-amd64]# nohup ./ Alertmanager & / / start in the background
3. Verify installation
[root@CentOS7-0001 alertmanager-0.22.1.linux-amd64]# netstat -lnp | grep 9093
Access verification: http://192.168.65.56:9093
4. Add Alertmanager to Prometheus
The alerting node configures the Alertmanager address, rule_ The files node opens first_rules.yml configuration
alerting:
  alertmanagers:
	- static_configs:
		- targets: ['192.168.65.56:9093']
# Open rule_ First in files_ Comments on Rules
rule_files:
  - "first_rules.yml"
  # - "second_rules.yml"
5. Add first under the installation directory of Alertmanager_ rules. YML configuration
groups:
- name: test-rule
  rules:
  - alert: "Test alarm"
    expr: (go_memstats_frees_total > 10000000)
    for: 1m
    labels:
      severity: warning
    annotations:
      summary: "{{ $labels.alertname }}"
      description: "{{ $labels.alertname }}Test alarm"
      value: "{{ $value }}"
6. Restart prometheus login authentication
Save and restart Prometheus after configuration. Visit: http://192.168.65.56:9090/graph Click Alters. If data is displayed, it indicates that it has been configured.
Vi MySQL monitored by Prometheus (default port 9104)
1. Download the sql and extract it to the specified directory
[root@CentOS7-0002 install]# wget https://codeload.github.com/john1337/my2Collector/zip/master
[root@CentOS7-0002 install]# unzip -d /root master
Archive: master
12373a44941bd587926fcece1d9baac84d79e703
creating: /root/my2Collector-master/
inflating: /root/my2Collector-master/LICENSE
inflating: /root/my2Collector-master/README.md
inflating: /root/my2Collector-master/my2.sql
2. Log in to mysql and import sql
Use the command to log in to mysql,mysql -u user name - p password
[root@CentOS7-0002 install]# mysql -uroot -proot
Import sql file with command
mysql> source /root/my2Collector-master/my2Collector-master/my2.sql
3. Download mysqld_exporter and extract it to the specified directory
[root@CentOS7-0002 install]# wget -r -p -np -k -nc -c https://github.com/prometheus/mysqld_exporter/releases/download/v0.10.0/mysqld_exporter-0.10.0.linux-amd64.tar.gz [root@CentOS7-0002 install]# tar -xvf mysqld_exporter-0.10.0.linux-amd64.tar.gz -C /srv/thinkive/software/
4. New profile
Enter mysqld_exporter installation directory, create my CNF configuration file, add the following information:
[client]
user=root
password=AaZz123456
As long as the account and password can be connected to mysql, you can also assign an account to it separately;
5. Start mysqld_exporter and verify
root@CentOS7-0002 mysqld_exporter-0.10.0]# ./mysqld_exporter -config.my-cnf="my.cnf" &
Verification address:
[root@CentOS7-0002 mysqld_exporter-0.10.0]# curl http://192.168.65.166:9104
6. mysqld_exporter added to Prometheus
Prometheus. Add the following configuration to YML configuration:
- job_name: 'mysql166'
    static_configs:
    - targets: ['192.168.65.166:9104']
7. Restart prometheus login authentication
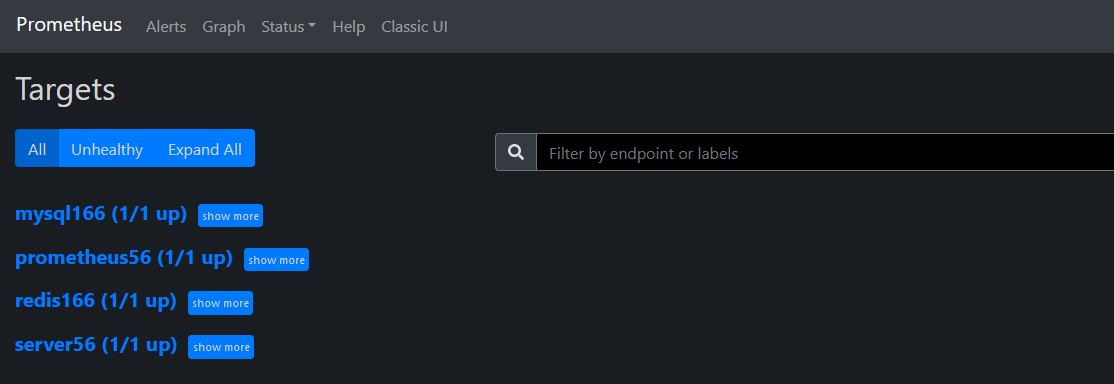
After configuration, save and restart Prometheus, and then click status - > targets. If the State of mysql is found to be in the Up State, it indicates that it has been configured. If not, you can pay attention to whether mysql has enabled remote access. Generally, newly installed msyql is accessible only on this machine;
VII Redis monitored by Prometheus (default port 9121)
1. Download redis_exporter and extract it to the specified directory
[root@CentOS7-0002 install]# wget -r -p -np -k -nc -c https://github.com/oliver006/redis_exporter/releases/download/v1.0.3/redis_exporter-v1.0.3.linux-amd64.tar.gz
[root@CentOS7-0002 install]# tar -zxvf redis_exporter-v1.0.3.linux-amd64.tar.gz -C /srv/thinkive/software/
2. Start Redis_exporter
[root@CentOS7-0002 redis_exporter-v1.0.3.linux-amd64]# ./redis_ Exporter redis / / 192.168.65.166:6379 & / / start without password
[root@CentOS7-0002 redis_exporter-v1.0.3.linux-amd64]# ./redis_exporter -redis.addr 192.168.65.166:6379 -redis.password 123456 / / start with a password
The IP side is based on the actual IP address and port of the actual redis service
3. redis_exporter added to Prometheus
Prometheus installation directory configuration file Prometheus Add the following contents to YML configuration
- job_name: 'redis166'
    static_configs:
    - targets: ['192.168.65.166:9121']
4. Restart prometheus login authentication
After configuration, save and restart Prometheus, and then click status - > targets. If the State of redis is Up, it indicates that it has been configured. If it has not been configured
8, Grafana monitored by Prometheus (default port 3000)
prometheus can be introduced into grafana management console
1. Download the version and extract it to the specified directory
Download from grafana official website: Download Grafana | Grafana Labs
[root@CentOS7-0001 install]#wget -r -p -np -k -nc -c https://dl.grafana.com/enterprise/release/grafana-enterprise-8.4.1.linux-amd64.tar.gz [root@CentOS7-0001 install]# tar -zxvf grafana-enterprise-8.4.1.linux-amd64.tar.gz -C /srv/thinkive/software
2. Enter the Grafana directory to start
[root@CentOS7-0001 /]# cd /srv/thinkive/software/grafana-8.4.1/bin/
[root@CentOS7-0001 bin]# ./grafana-server web
You can use nohup to start in the background.
3. Access verification
After installing and starting Grafana, the default port is 3000 Browser input http://192.168.65.56:3000 To access Grafana, the administrator account password is admin/admin by default. The first login will let you change the administrator password, and then you can log in and check it.
After logging in, you can add prometheus in the Grafana management console. The specific operation will not be explained in detail here
9, Mail alarm monitored by Grafana
1. Profile modification
Enter the Grafana configuration path and edit the file defaults ini
[root@CentOS7-0001 /]# /srv/thinkive/software/grafana-8.4.1/conf
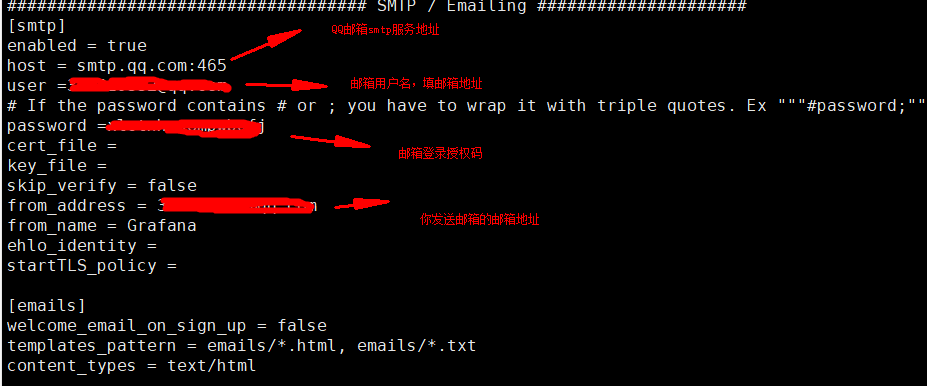
smtp.qq.com:465 is for QQ mailbox. The servers of other mailboxes are different. Please make corresponding changes and go directly to Baidu
2. Save, exit, enter the Grafana directory and restart
[root@CentOS7-0001 /]# cd /srv/thinkive/software/grafana-8.4.1/bin/
[root@CentOS7-0001 bin]# ./grafana-server web
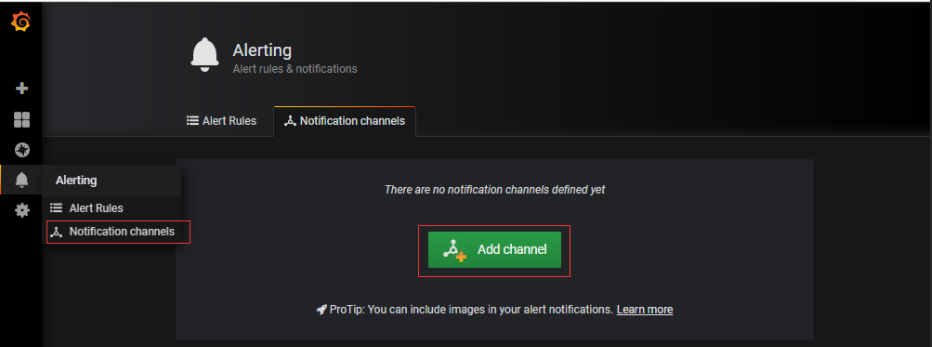
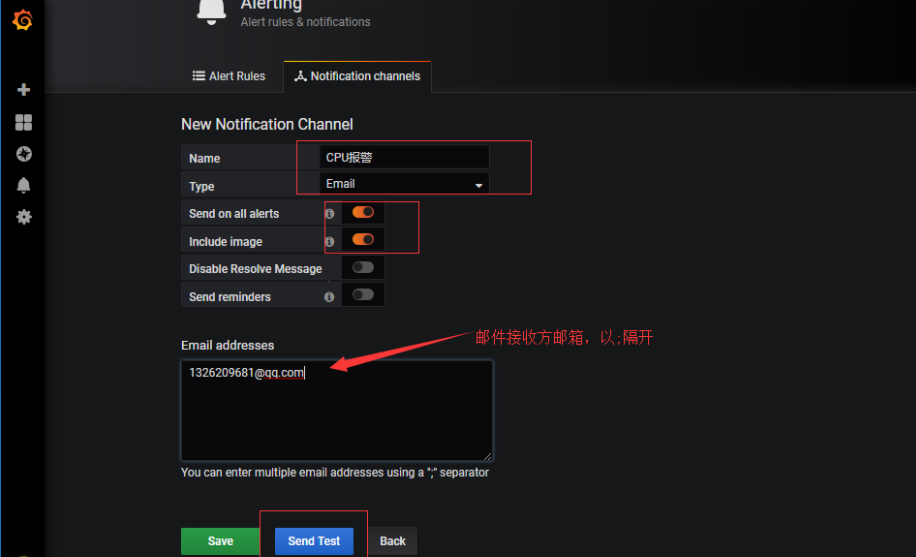
3. The browser logs in to the Grafana management terminal to configure the alarm
 10, Other content extensions:
Common note node download address:
1.node_exporter
The user monitors the index information of the node virtual machine.
Download address: https://github.com/prometheus/node_exporter/releases/download/v0.17.0-rc.0/node_exporter-0.17.0-rc.0.linux-386.tar.gz
2.jmx_exporter
Download address: https://repo1.maven.org/maven2/io/prometheus/jmx/jmx_prometheus_javaagent/0.3.1/jmx_prometheus_javaagent-0.3.1.jar
3.elasticsearch_exporter
Download address: https://github.com/justwatchcom/elasticsearch_exporter/releases/download/v1.0.4rc1/elasticsearch_exporter-1.0.4rc1.linux-386.tar.gz
4.redis_exporter
Download address: https://github.com/oliver006/redis_exporter/releases/download/v0.22.0/redis_exporter-v0.22.0.linux-386.tar.gz
5.mysqld_exporter
Download address; https://github.com/prometheus/mysqld_exporter/releases/download/v0.11.0/mysqld_exporter-0.11.0.linux-386.tar.gz
6.postgres_exporter
Download address: https://github.com/wrouesnel/postgres_exporter/releases/download/v0.4.7/postgres_exporter_v0.4.7_linux-amd64.tar.gz
7.mongodb_exporter
Download address: https://github.com/dcu/mongodb_exporter/releases/download/v1.0.0/mongodb_exporter-linux-amd64
8.statsd_exporter
Download address: https://github.com/prometheus/statsd_exporter/releases/download/v0.8.0/statsd_exporter-0.8.0.linux-amd64.tar.gz
9.mesos_exporter
Download address: https://github.com/mesos/mesos_exporter/releases/download/v1.1.1/mesos_exporter-1.1.1.linux-arm64.tar.gz
10.apache_exporter
Download address: https://github.com/Lusitaniae/apache_exporter/releases/download/v0.5.0/apache_exporter-0.5.0.linux-amd64.tar.gz
11.hadoop_exporter
Download address: https://github.com/wyukawa/hadoop_exporter
12.logstash_exporter
Download address: https://github.com/BonnierNews/logstash_exporter/archive/v0.1.2.tar.gz
13.sql_exporter
Download address: https://github.com/justwatchcom/sql_exporter/releases/download/v0.2.0/sql_exporter-0.2.0.linux-amd64.tar.gz
14.oracle_exporter
Download address: https://github.com/iamseth/oracledb_exporter/releases/download/0.0.8/oracledb_exporter.linux-amd64
15.zookeeper_exporter
Download address 1: https://github.com/carlpett/zookeeper_exporter/releases/download/v1.0.1/zookeeper_exporter-1.0.1.linux-amd64.tar.gz
Download address 2: https://github.com/carlpett/zookeeper_exporter/releases/download/v1.0.2/zookeeper_exporter
16.influxdb_exporter
Download address: https://github.com/prometheus/influxdb_exporter/releases/download/v0.1.0/influxdb_exporter-0.1.0.linux-amd64.tar.gz
17.zabbix_exporter
Download address: https://github.com/MyBook/zabbix-exporter/archive/1.0.2.tar.gz
18.opentsdb_exporter
Download address: https://github.com/cloudflare/opentsdb_exporter/archive/0.0.3.tar.gz
19.grafana_exporter
Download address: https://github.com/frodenas/grafana_exporter/releases/download/v0.1.0/grafana_exporter-0.1.0.linux-amd64.tar.gz
20.json_exporter
Download address: https://github.com/sciffer/json_exporter