preface
Note that monitoring dell server hardware in the title refers to monitoring the status of server hardware (disk, memory, power supply, etc.), not monitoring hardware performance, disk space, memory usage, etc. it is similar to zabbix monitoring idrac's snmp to obtain hardware status
Now most companies use prometheus monitoring containers and services, zabbix monitoring hardware, ports, and of course other monitoring architectures. Here, we don't compare the advantages and disadvantages of each monitoring. We just make a document. The document doesn't explain the basic content in detail. It's only suitable for viewing some prometheus foundations. It's not suitable for non-contact people
prerequisite
<1> Each server to be monitored starts the snmp of idrac and sets the community name, which is similar to the password (public by default)
Pay attention to the password you set, which will be used later


<2> Due to security problems, the network is generally limited. Find a server that can ping the idrac IP address of each server and install the snmp monitoring component
<3> The Prometheus server needs to be able to connect to snmp_exporter
Component installation
Installation dependency
yum -y install gcc gcc-g++ make net-snmp net-snmp-utils net-snmp-libs net-snmp-devel golang git
snmp_exporter installation
<1> Download snmp_exporter
https://github.com/prometheus/snmp_exporter/releases

cd /data
wget https://github.com/prometheus/snmp_exporter/releases/download/v0.20.0/snmp_exporter-0.20.0.linux-amd64.tar.gz
tar xf snmp_exporter-0.20.0.linux-amd64.tar.gz
mv snmp_exporter-0.20.0.linux-amd64 snmp_exporter
<2> Configure startup mode
The startup mode is configured according to the system version. Startup is not required temporarily (SNMP is not generated)
Centos7

cat /usr/lib/systemd/system/snmp-exporter.service

[Unit]
Description=SNMP exporter
Documentation=https://github.com/prometheus/snmp_exporter


[Service]
ExecStart=/data/snmp_exporter/snmp_exporter \
--config.file=/data/snmp_exporter/snmp.yml \
--web.listen-address=:9116 \
--snmp.wrap-large-counters
ExecReload=/bin/kill -HUP $MAINPID
KillMode=process
Restart=on-failure

[Install]
WantedBy=multi-user.target


management style:
systemctl daemon-reload
systemctl enable snmp-exporter
systemctl restart snmp-exporter
systemctl status snmp-exporter
systemctl stop snmp-exporter
Centos6

cat /etc/init.d/snmp_exporter
#!/bin/bash

# chkconfig: 2345 80 80
# description: Start and Stop snmp_exporter
# Source function library.

. /etc/init.d/functions

prog_name="snmp_exporter"
prog_path="/data/${prog_name}"
pidfile="/var/run/${prog_name}.pid"
prog_logs="/data/${prog_name}/${prog_name}.log"
options="--config.file=/data/snmp_exporter/snmp.yml --web.listen-address=:9116 --snmp.wrap-large-counters"
DESC="snmp_exporter"

[ -x "${prog_path}" ] || exit 1

RETVAL=0

start(){
action $"Starting $DESC..." su -s /bin/sh -c "nohup $prog_path $options >> $prog_logs 2>&1 &" 2> /dev/null
RETVAL=$?
PID=$(pidof ${prog_path})
[ ! -z "${PID}" ] && echo ${PID} > ${pidfile}
echo
[ $RETVAL -eq 0 ] && touch /var/lock/subsys/$prog_name
return $RETVAL
}

stop(){
echo -n $"Shutting down $prog_name: "
killproc -p ${pidfile}
RETVAL=$?
echo
[ $RETVAL -eq 0 ] && rm -f /var/lock/subsys/$prog_name
return $RETVAL
}

restart() {
stop
start
}

case "$1" in
start)
start
;;
stop)
stop
;;
restart)
restart
;;
status)
status $prog_path
RETVAL=$?
;;
*)
echo $"Usage: $0 {start|stop|restart|status}"
RETVAL=1
esac

------------------------------------------------------------
cat  /etc/sysconfig/snmp_exporter
ARGS=""


------------------------------------------------------------
management style:
chmod +x /etc/init.d/snmp_exporter
chkconfig snmp_exporter on
/etc/init.d/snmp_exporter restart
mibs downloads and generates snmp.yml
MIB and OID
OID is the id provided by SNMP agent to uniquely identify an object or information. It is a string of numbers such as 1.3.6.1.4.1.4413.1.3.2.1.17
MIB is a database that stores the information corresponding to OID in a tree structure
Just as an organization has designated 134 as hands-on, MIB is
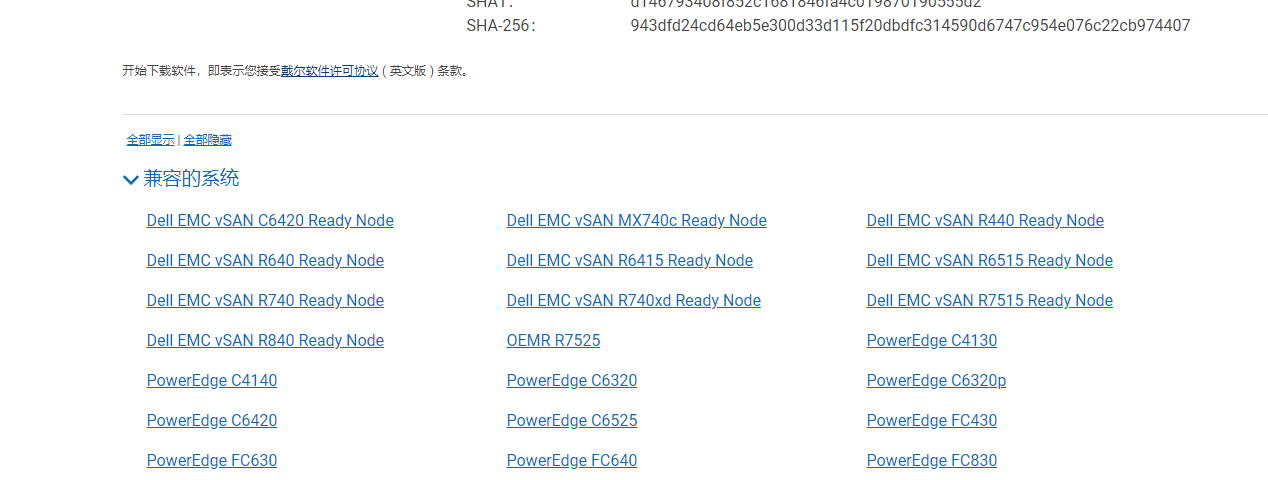
<1> Download the mib suitable for your server model and view the compatible system
https://www.dell.com/support/search/zh-cn#q=mibs&sort=relevancy&f:langFacet=[zh]
wget https://dl.dell.com/FOLDER06009600M/1/Dell-OM-MIBS-940_A00.zip
unzip Dell-OM-MIBS-940_A00.zip
<2> View OID
snmptranslate -Tz -m /root/support/station/mibs/iDRAC-SMIv2.mib
cp /usr/share/snmp/mibs/SNMPv2-SMI.txt /root/support/station/mibs/
<3> Generate snmp.yml
Official address:
https://github.com/prometheus/snmp_exporter/tree/main/generator#file-format

# Configuration variable
export GO111MODULE=on
export GOPROXY=https://mirrors.aliyun.com/goproxy/
export MIBDIRS=/root/support/station/mibs/

#Pull generator
go get github.com/prometheus/snmp_exporter/generator
cd ${GOPATH-$HOME/go}/pkg/mod/github.com/prometheus/snmp_exporter@v0.20.0/generator
go build


#Edit generator.yml
(community To set as you idrac of snmp Group name)

vim generator.yml

modules:
  idrac:
    walk:
      - 1.3.6.1
    version: 2
    timeout: 30s
    auth:
      community: public

#Generate monitoring indicators
./generator generate
cp -r snmp.yml /data/snmp_exporter/
<4> Start snmp_exporter
systemctl restart snmp-exporter
/etc/init.d/snmp_exporter restart
<5> Test whether the index grabbing is normal
http://snmp_ IP of exporter: 9116
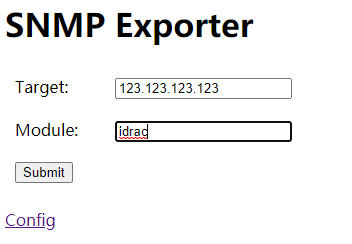
remarks:
Target Fill in the remote management card of the server to be captured ip,Of the network card configured inside the server ip invalid
Module:Fill in this snmp Module of,snmp.yml In the file walk above
 If you part of the server snmp Your password is something else,It is recommended to copy a new one snmp file,Modify the at the end of the file community: xxx
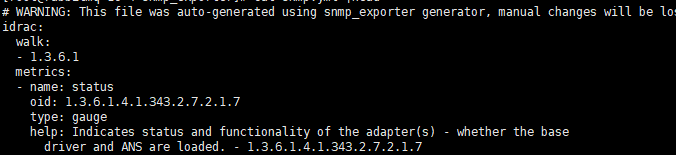
cat snmp.yml

Prometheus configuration
No matter how Prometheus is installed, it does not need to be installed again. The focus is to add an idrac configuration to prometheus.yml
You may write prometheus monitoring and alarm related documents later
prometheus configuration
<1> Configure where to read alarm rules
# Load rules once and periodically evaluate them according to the global 'evaluation_interval'.
rule_files:
    - "rule/*.yml"
  # - "second_rules.yml"
Directory for creating alarm rules,Write the file of the alarm rule in the directory
mkdir rule
vim idrac.yml
<2> Configure the job and set the indicators to be collected or excluded
Mode 1
static_configs mode

- job_name: 'IDRAC'
  scrape_interval: 180s             #Interval for fetching data
  scrape_timeout: 180s              #Timeout for fetching data
  static_configs:
    - targets:
        - 123.123.123.123           #idrac ip to monitor, default snmp port 161
#       - 123.123.123.123:161       #If it is other ports, you can also add ports
#      labels:                      #labels can be added according to requirements, such as the internal ip corresponding to the idrac, work room, etc
#        IP: 'xxx'
#        project: 'xxx'
  metrics_path: /snmp
  params:
    module: [dell]                  #
  relabel_configs:
    - source_labels: [__address__]
      target_label: __param_target
    - source_labels: [__param_target]
      target_label: instance
    - target_label: __address__
      replacement: xxxxx:9116      #Your snmp_exporter server


Characteristics of this model,To monitor which ones, you need to targets Add several.If it is hundreds, it will lead to prometheus.yml The number of file lines is particularly large
Mode II
file_sd_configs mode


  - job_name: "IDRAC"
    params:
      module:
      - idrac
    scrape_interval: 180s
    scrape_timeout: 180s
    metrics_path: /snmp
    file_sd_configs:
      - files:
        - targets/*.json               #Read the json file. The directory name is arbitrary, but you have to create it
        refresh_interval: 5m           #How long does the file load and how often
    relabel_configs:
     - source_labels: [__address__]
       target_label: __param_target
     - source_labels: [__param_target]
       target_label: instance
     - target_label: __address__
       replacement: xxxx:9116         #Your snmp_exporter server


Characteristics of this model,Need to create json file,Monitor item write json file,json The format is as follows:
cat targets/idrac.json

[
  {
    "targets": [
      "123.123.123.123:161"
    ],
    "labels": {
      "IP": "xxxx",
      "Project": "xxx"
    }
  },
  {
    "targets": [
      "123.123.123.124:161"
    ],
    "labels": {
      "IP": "xxx",
      "Project": "xxx"
    }
  }
]

or

[
  {
    "targets": [
      "123.123.123.123:161",
      "123.123.123.124:161"
    ],
    "labels": {
      "IP": "xxxx",
      "Project": "xxx"
    }
  }
]
Mode III
consul_sd_file mode
 This method is to register monitoring with consul In service,prometheus adopt consul Realize automatic discovery of services
 Not detailed here consul,Not used consul And configured prometheus This method is not recommended for the alarm,Not easy to understand


  - job_name: 'IDRAC'
    params:
      module:
      - idrac
    scrape_interval: 180s
    scrape_timeout: 180s
    metrics_path: /snmp
    consul_sd_configs:
    - server: 'monitor-consul.com:8500'           #This is the domain name of your consumer service, or you can directly fill in the ip address
      tag_separator: ','
      services: []
    relabel_configs:
      - source_labels: [__meta_consul_tags]
        regex: .*idrac.*                          #This is to classify the indicators in your consumer's tags that meet the regularity into the Job
        action: keep
      - source_labels: ['__meta_consul_service_metadata_eth-ip']     #This is the label marked by your consumer, which is displayed in Prometheus - > targets - > Idrac - > endpoint
        target_label: __param_target
      - source_labels: ['__meta_consul_service_address']
        target_label: instance
      - target_label: __address__
        replacement: xxx:9116


Characteristics of this model,The service needs to be registered to consul,There are two registration methods: static and file:
json Examples are as follows,Write your own according to your needs(Label random,But it should match the keyword of the nail group you call the police,accord with alertmanger Related configuration)


cat consul-idrac.json
{
  "ID": "IDRAC-xxx",
  "Name": "IDARC-xxx",
  "Tags": [
    "idrac"
  ],
  "Address": "xxx",                                  #IDRAC IP
  "Meta": {                                          #The label in consumer, and then the label will be rewritten as the label of prometheus
	"eth-ip":"xxx",                                  #Server service ip
	"project":"beijing"                              #Location
  },
  "EnableTagOverride": false,
  "Check": {
	  "HTTP": "http://xxxx:9116/metrics ", # your snmp server IP and port. Health check
      "Interval": "10s"
  },
  "Weights": {
    "Passing": 10,
    "Warning": 1
  }
}


explain:Because the health check uses snmp_exporter What we're actually checking is snmp_exporter,So even the front IP And so on is wrong,consul The status is also normal.But it doesn't affect prometheus To monitor,Service registration to consul after,It's just from consul Gets the value and label of the service,then prometheus Then monitor according to your own configuration.about snmp Suitable for the second json

or
cat consul-idrac2.json

{
  "ID": "IDRAC-xxx",
  "Name": "IDARC-xxx",
  "Tags": [
    "idrac"
  ],
  "Address": "xxx:161",
  "Meta": {                                          #The label in consumer, and then the label will be rewritten as the label of prometheus
	"eth-ip":"xxx",                                  #Server service ip
	"project":"beijing"                              #Location
  }
}


register
curl --request PUT --data @consul-idrac.json http://monitor-consul.com:8500/v1/agent/service/register?replace-existing-checks=1
 Unregister
curl -X PUT http://monitor-consul.com:8500/v1/agent/service/deregister/IDRAC-xxx
effect:

Alarm rule configuration
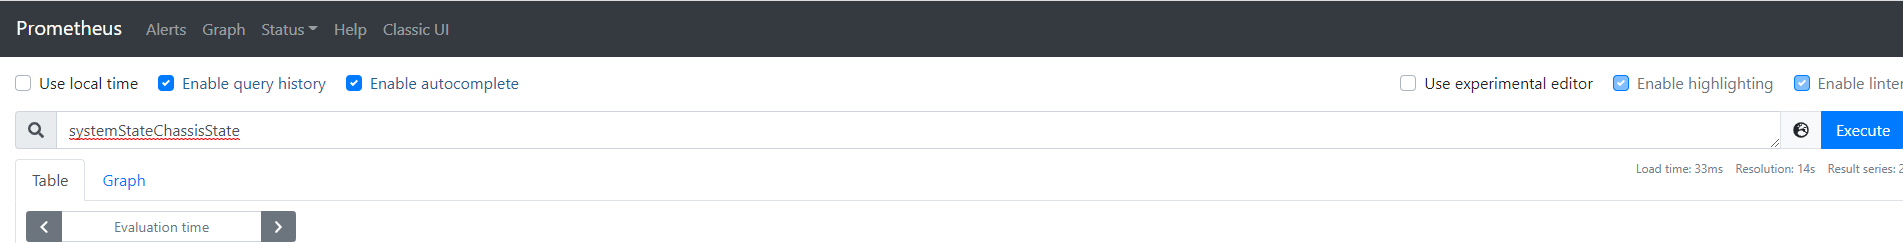
Pay attention to the indicators in snmp.yml, but not all indicators can be used. You can search on prometheus

cat rule/idrac.yml
groups:
    - name: IDRAC-Physical machine hardware running status
      rules:

      - alert: IDRAC state
        expr: up{job=~"IDRAC.*"} == 0
        for: 1m
        labels:
          status: error
        annotations:
          description: "{{$labels.instance}} IDRAC abnormal"

      - alert: Overall status of chassis components
        expr: chassisStatus != 3
        for: 1m
        labels:
          status: error
        annotations:
          summary: "The overall running status of chassis components is abnormal. Please check it in time!!"
          description: "{{$labels.instance}}Abnormal chassis components"

      - alert: Chassis CMOS Overall battery status
        expr: systemBatteryStatus != 3
        for: 1m
        labels:
          status: error
        annotations:
          summary: "Chassis CMOS The overall state of the battery is abnormal. Please check it in time!!"
          description: "{{$labels}}Chassis CMOS Abnormal battery status"


      - alert: Memory module running status
        expr: memoryDeviceStatus != 3
        for: 1m
        labels:
          status: error
        annotations:
          summary: "The status of the memory module is abnormal. Please check it in time!!"
          description: "{{$labels.instance}} Memory module {{$labels.memoryDeviceIndex}}abnormal"


      - alert: processor CPU Overall status
        expr: processorDeviceStatusStatus != 3
        for: 1m
        labels:
          status: error
        annotations:
          summary: "processor CPU The overall status is abnormal. Please check it in time!!"
          description: "{{$labels.instance}} processor CPU{{$labels.processorDeviceStatusIndex}}abnormal"

      - alert: Network card status
        expr: networkDeviceStatus != 3
        for: 1m
        labels:
          status: error
        annotations:
          description: "{{$labels.instance}} network card{{$labels.networkDeviceIndex}}abnormal"

      - alert: ps Overall status of power supply
        expr: powerSupplyStatus != 3
        for: 1m
        labels:
          status: error
        annotations:
          summary: "ps The overall status of the power supply is abnormal. Please check it in time!!"
          description: "{{$labels.instance}} ps Power Supply {{ $labels.powerSupplyIndex }}Abnormal state"

      - alert: Storage controller overall status
        expr: globalStorageStatus != 3
        for: 1m
        labels:
          status: error
        annotations:
          summary: "The status of the storage controller is abnormal. Please check it in time!!"
          description: "{{$labels.instance}} Storage controller exception"

      - alert: Overall status of physical system components
        expr: globalSystemStatus != 3
        for: 1m
        labels:
          status: error
        annotations:
          summary: "The overall components of the physical system are running abnormally. Please check it in time!!"
          description: "{{$labels.instance}} Physical system component exception"

      - alert: Physical disk running status
        expr: physicalDiskState != 3
        for: 1m
        labels:
          status: error
        annotations:
          summary: "The physical disk is running abnormally. Please check it in time!!"
          description: "{{$labels.instance}} Physical disk{{$labels. physicalDiskNumber}}abnormal"

      - alert: Virtual disk running status
        expr: virtualDiskState != 2
        for: 1m
        labels:
          status: error
        annotations:
          summary: "The virtual disk is running abnormally. Please check it in time!!"
          description: "{{$labels.instance}} Virtual disk{{$labels.virtualDiskNumber}}abnormal"
Reload prometheus
curl -X POST http://XXXX: 9090 / - / reload #prometheus' IP
To alarm, you also need to configure the alarm plug-in Alertmanager and the nail plug-in Prometheus webhook dingtalk, and add robots in the dingding group. The alarm process is not demonstrated here