Prometheus Operator - the second part uses Prometheus Operator to manage monitoring configuration, such as alertmanager alarm, user-defined alarm rules, etc~ https://mp.weixin.qq.com/s?__biz=MzU0NjEwMTg4Mg==&mid=2247485774&idx=1&sn=1b0301dadc4b737e19b1066219813db7&chksm=fb63865bcc140f4d8966d1c3745c8f69c6384337c43a1a8eda6e1ae488bd78f08e44c9553b19&token=313041406&lang=zh_CN#rd So far, we have managed Promtheus instance, monitoring configuration, alarm rules and other resources through the user-defined resource type of Prometheus Operator.
The original manual management work is changed into a declarative management mode through the Prometheus Operator, which greatly simplifies the complexity of Prometheus operation and maintenance management under Kubernetes. Next, we will continue to use Promtheus Operator to define and manage Alertmanager related content.
In order to manage Alertmanager instances through Prometheus Operator, users can define Alertmanager through customized resources, as shown below. The number of Alertmanager instances can be controlled through replicas:
cat alertmanager-inst.yaml
apiVersion: monitoring.coreos.com/v1
kind: Alertmanager
metadata:
  name: inst
  namespace: monitoring
spec:
  replicas: 3
When replicas is greater than 1, Prometheus Operator will automatically create Alertmanager through cluster. Save the above as the file alertmanager-inst.yaml and create it with the following command:
kubectl -n monitoring apply -f alertmanager-inst.yaml
Check the Pod as shown below. We will find that the Pod instance of Alertmanager is always in the state of ContainerCreating:
kubectl -n monitoring get pods
View the Pod instance status of the Alertmanager through the kubectl describe command, and you can see alarm information similar to the following:
MountVolume.SetUp failed for volume "config-volume" : secrets "alertmanager-inst" not found
This is because the Prometheus Operator creates the Alertmanager instance through stateful. By default, it will find the Secret configuration through the naming rules of alertmanager-{ALERTMANAGER_NAME}, and mount the content of the Secret as a configuration file to the Alertmanager instance in the way of file mounting. Therefore, you also need to create corresponding configuration content for Alertmanager, as shown below, which is the configuration file of Alertmanager:
cat alertmanager.yaml
global:
  resolve_timeout: 5m
route:
  group_by: ['job']
  group_wait: 30s
  group_interval: 5m
  repeat_interval: 12h
  receiver: 'webhook'
receivers:
- name: 'webhook'
  webhook_configs:
  - url: 'http://alertmanagerwh:30500/'
Save the above as the file alertmanager Yaml, and create a Secret resource named alrtmanager Inst with the following command:
kubectl -n monitoring create secret generic alertmanager-inst --from-file=alertmanager.yaml
Update the alertmanager-inst.yaml file again
kubectl -n monitoring delete  -f alertmanager-inst.yaml

kubectl -n monitoring apply  -f alertmanager-inst.yaml
After the Secret is created successfully, view the status of the current Alertmanager Pod instance. As follows:
[root@master ~]# kubectl get pod -n monitoring
NAME                                   READY   STATUS    RESTARTS   AGE
alertmanager-inst-0                    2/2     Running   0          21m
alertmanager-inst-1                    2/2     Running   0          21m
prometheus-k8s-0                       3/3     Running   9          10d
prometheus-operator-7d6496d74b-vrjcj   1/1     Running   5          14d
Create a service in the front end of alertmanager so that we can access it in the browser:
cat alertmanager-service.yaml
apiVersion: v1
kind: Service
metadata:
  labels:
    app: alertmanager-service
  name: alertmanager-operator-svc
  namespace: monitoring
spec:
  ports:
  - name: operator
    port: 9093
    protocol: TCP
    targetPort: 9093
  selector:
    alertmanager: inst
    app: alertmanager
  sessionAffinity: None
  type: NodePort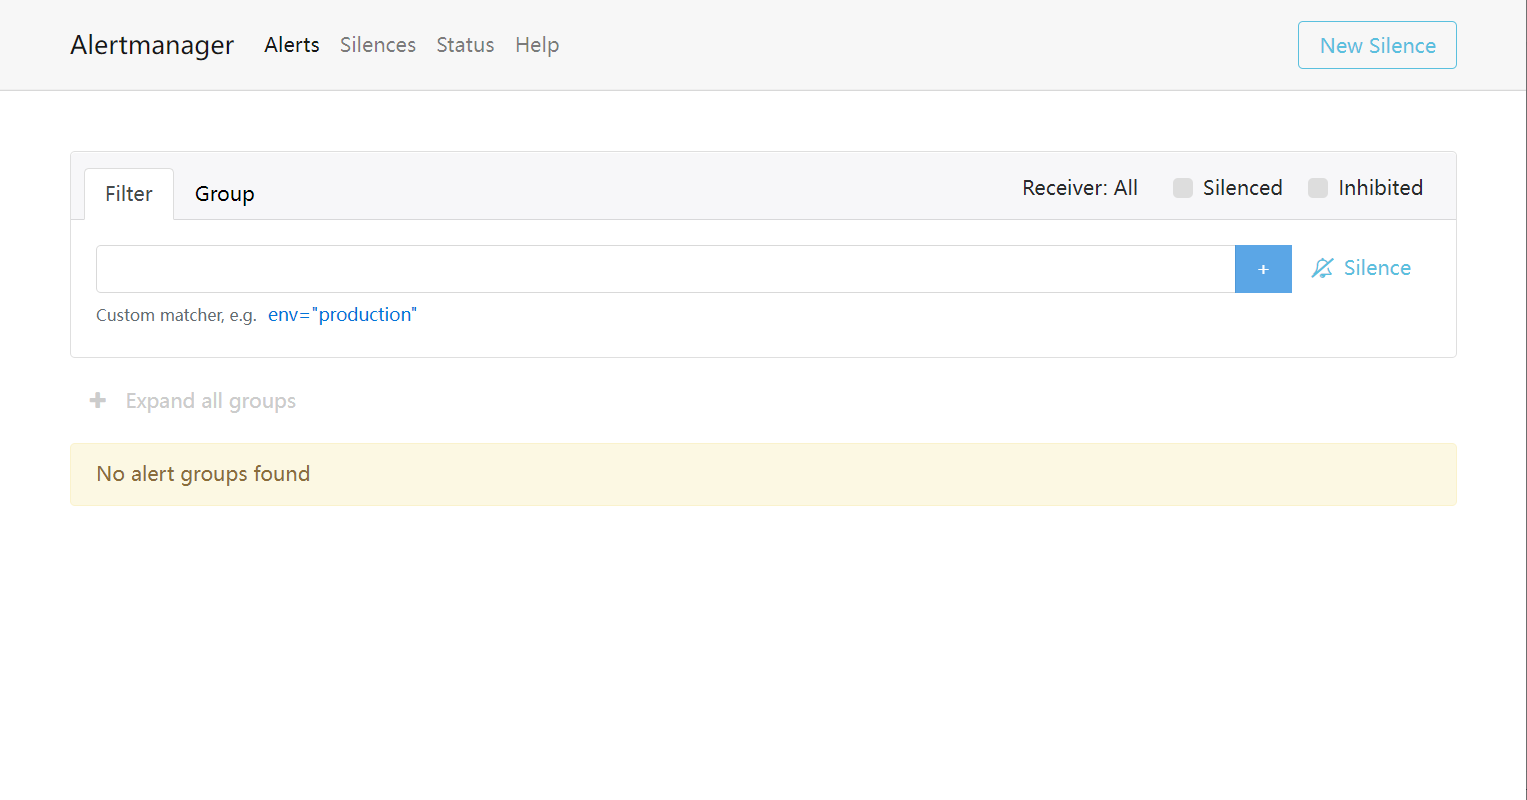
Next, we only need to modify our Prometheus resource definition and specify the Alertmanager resource to use through alerting:
cat prometheus-inst.yaml
apiVersion: monitoring.coreos.com/v1
kind: Prometheus
metadata:
name: inst
namespace: monitoring
spec:
serviceAccountName: prometheus
serviceMonitorSelector:
matchLabels:
team: frontend
ruleSelector:
matchLabels:
role: alert-rules
prometheus: example
alerting:
alertmanagers:
- name: alertmanager-example
namespace: monitoring
port: web
resources:
requests:
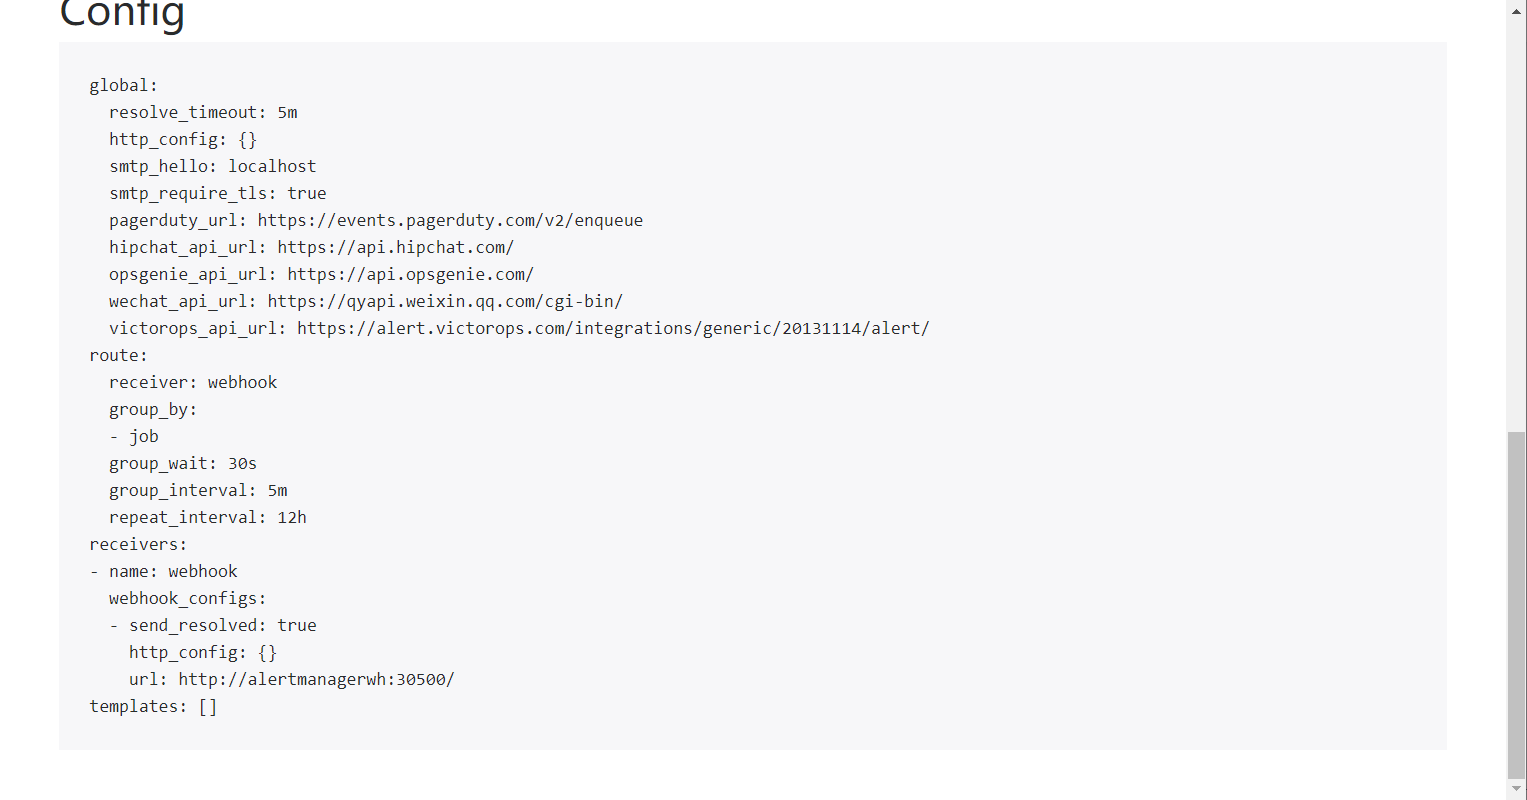
memory: 400MiAfter waiting for Prometheus to reload, access http://192.168.0.6:31535/config We can see that Prometheus Operator has added the following configuration to the configuration file: