Managing monitoring configurations using ServiceMonitor
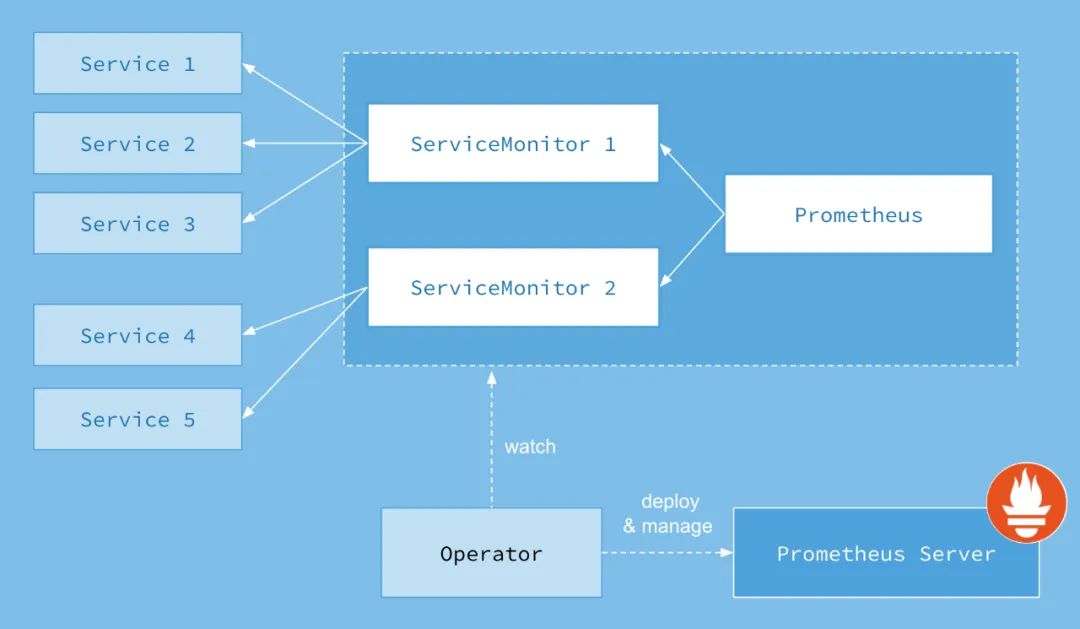
Modifying the monitoring configuration item is also one of the common operation and maintenance operations under Prometheus. In order to automatically manage the configuration of Prometheus, the Prometheus Operator uses the custom resource type ServiceMonitor to describe the information of the monitoring object. Here, we first deploy a sample application in the cluster and save the following to example app Yaml and create it using the kubectl command line tool:
cat example-app.yaml
kind: Service
apiVersion: v1
metadata:
  name: example-app
  labels:
    app: example-app
spec:
  selector:
    app: example-app
  ports:
  - name: web
    port: 8080
    targetPort: 8080
---
apiVersion: apps/v1
kind: Deployment
metadata:
  name: example-app
spec:
  selector:
    matchLabels:
       app: example-app
  replicas: 3
  template:
    metadata:
      labels:
        app: example-app
    spec:
      containers:
      - name: example-app
        image: fabxc/instrumented_app
        ports:
        - name: web
          containerPort: 8080
Update yaml file:
kubectl apply -f example-app.yaml
The sample application will create three Pod instances through Deployment and expose the application access information through Service.
kubectl get pods
The display is as follows:
NAME                                  READY   STATUS    RESTARTS   AGE
example-app-bb759dfcc-7njwm           1/1     Running   0          110s
example-app-bb759dfcc-8sl77           1/1     Running   0          110s
example-app-bb759dfcc-ckjqf           1/1     Running   0          110s
Accessing the local svc:8080/metrics instance, the application will return the following sample data:
[root@master prometheus-operator]# curl 10.233.11.186:8080/metrics
# HELP codelab_api_http_requests_in_progress The current number of API HTTP requests in progress.
# TYPE codelab_api_http_requests_in_progress gauge
codelab_api_http_requests_in_progress 0
# HELP codelab_api_request_duration_seconds A histogram of the API HTTP request durations in seconds.
# TYPE codelab_api_request_duration_seconds histogram
codelab_api_request_duration_seconds_bucket{method="GET",path="/api/bar",status="200",le="0.0001"} 0
codelab_api_request_duration_seconds_bucket{method="GET",path="/api/bar",status="200",le="0.00015000000000000001"} 0
codelab_api_request_duration_seconds_bucket{method="GET",path="/api/bar",status="200",le="0.00022500000000000002"} 0
codelab_api_request_duration_seconds_bucket{method="GET",path="/api/bar",status="200",le="0.0003375"} 0
In order to enable Prometheus to collect monitoring data deployed under Kubernetes, in the native Prometheus configuration mode, we define a separate Job in the Prometheus configuration file and use Kubernetes at the same time_ SD defines the entire service discovery process. In Prometheus Operator, you can directly declare a ServiceMonitor object, as shown below:
cat example-app-service-monitor.yaml
apiVersion: monitoring.coreos.com/v1
kind: ServiceMonitor
metadata:
  name: example-app
  namespace: monitoring
  labels:
    team: frontend
spec:
  namespaceSelector:
    matchNames:
    - default
  selector:
    matchLabels:
      app: example-app
  endpoints:
  - port: web
Here, ServiceMonitor can monitor resource indicators - port: web is the 8080 port exposed in the above pod
# kubectl get servicemonitor -n monitoring
NAME          AGE
example-app   7m33s
Select the Pod object of the monitoring target by defining the tag in the selector, and specify the port whose port name is web in the endpoints. By default, ServiceMonitor and monitoring objects must be in the same Namespace.
In this example, because Prometheus is deployed in the Monitoring namespace, in order to associate the example object in the default namespace, you need to use the namespaceSelector definition so that it can associate ServiceMonitor resources across namespaces. Save the above contents to example app service monitor Yaml file and create through kubectl:
kubectl create -f example-app-service-monitor.yaml
If you want ServiceMonitor to be able to associate tags under any namespace, define them as follows:
spec:
  namespaceSelector:
    any: true
If the monitored Target object enables basicauth authentication, you can define basicauth in the endpoints configuration when defining the ServiceMonitor object, as shown below:
apiVersion: monitoring.coreos.com/v1
kind: ServiceMonitor
metadata:
  name: example-app
  namespace: monitoring
  labels:
    team: frontend
spec:
  namespaceSelector:
    matchNames:
    - default
  selector:
    matchLabels:
      app: example-app
  endpoints:
  - basicAuth:
      password:
        name: basic-auth
        key: password
      username:
        name: basic-auth
        key: user
    port: web
The Secret object named basic auth is associated in basicAuth. The user needs to manually save the authentication information in Secret:
apiVersion: v1
kind: Secret
metadata:
  name: basic-auth
data:
  password: dG9vcg== # base64 encoded password
  user: YWRtaW4= # base64 encoded user name
type: Opaque
Associate Promethues with ServiceMonitor
The association relationship between Prometheus and ServiceMonitor is defined by serviceMonitorSelector. In Prometheus, select the currently monitored ServiceMonitor object through the tag.
Modify the definition of Prometheus in prometheus-inst.yaml as follows: in order to associate Prometheus with ServiceMonitor, we need to use serviceMonitorSelector in the Pormtheus definition. We can select the ServiceMonitor object that Prometheus needs to monitor through the tag. Modify the definition of Prometheus in Prometheus inst.yaml as follows:
apiVersion: monitoring.coreos.com/v1
kind: Prometheus
metadata:
  name: inst
  namespace: monitoring
spec:
  serviceMonitorSelector:
    matchLabels:
      team: frontend
  resources:
    requests:
      memory: 400Mi
Apply changes to Prometheus to the cluster:
$ kubectl -n monitoring apply -f prometheus-inst.yaml
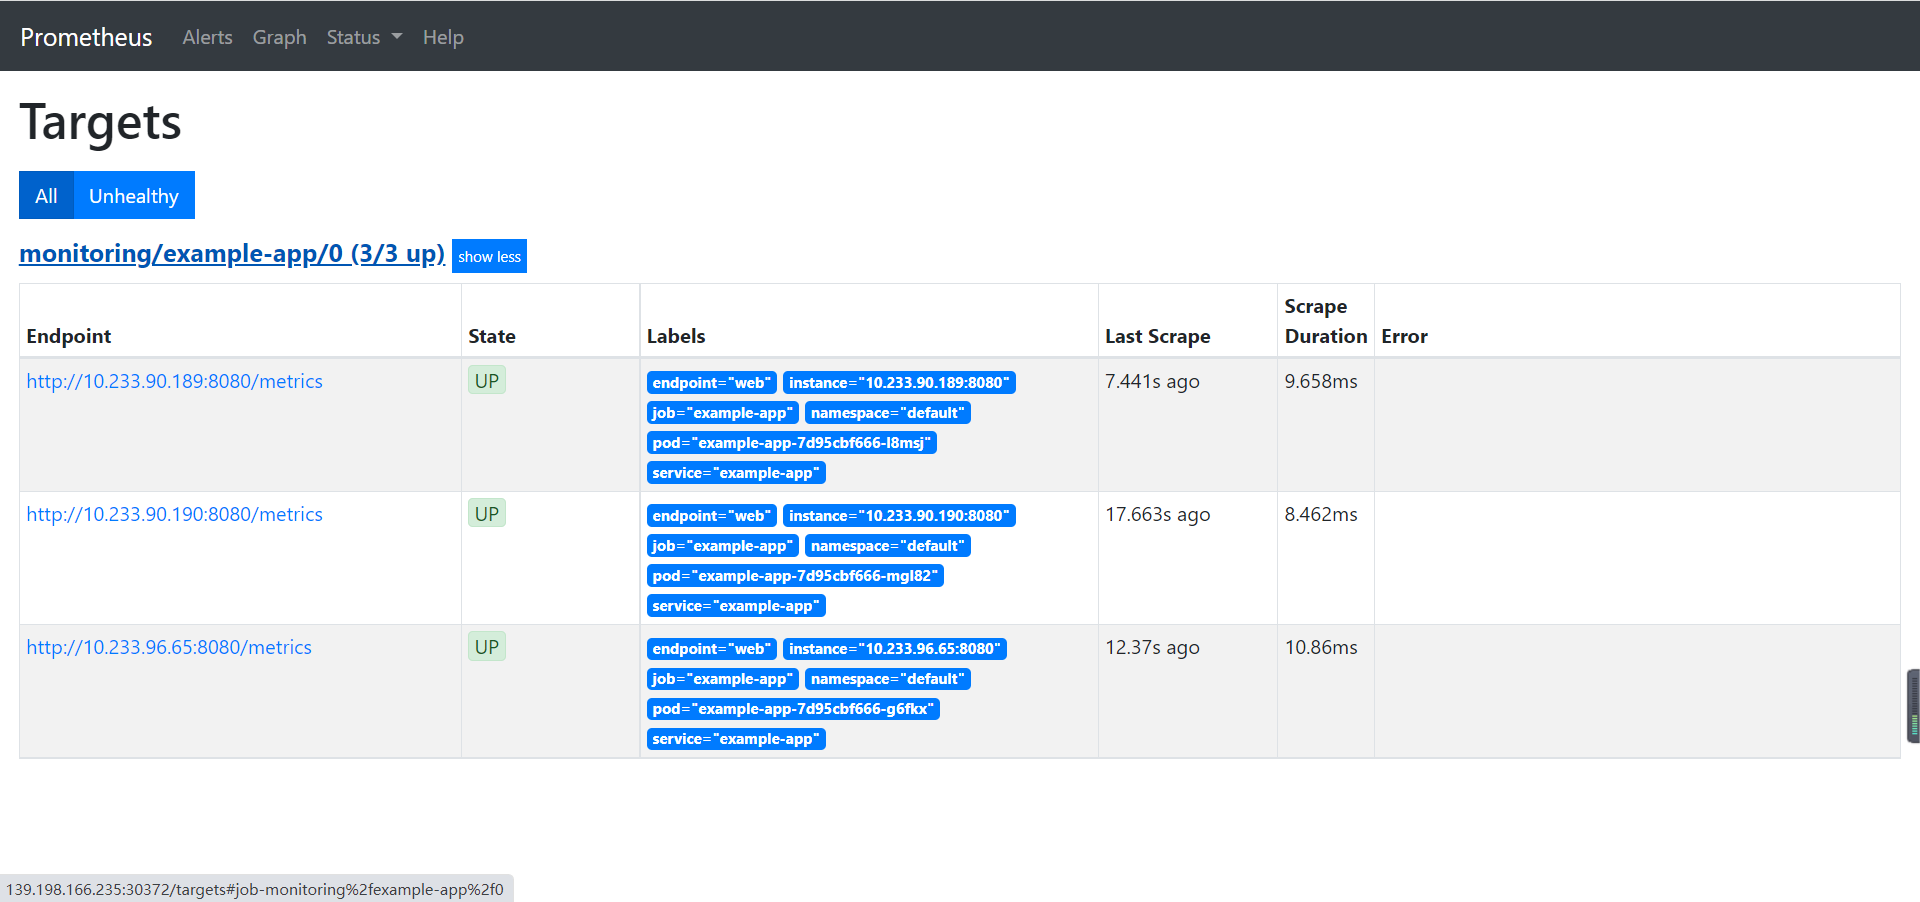
At this point, you are browsing http://192.168.0.6:31535/config Looking at the Prometheus configuration information, we will be surprised to find that the configuration file in Prometheus automatically contains a Job configuration named monitoring / example app / 0:
global:
  scrape_interval: 30s
  scrape_timeout: 10s
  evaluation_interval: 30s
  external_labels:
    prometheus: monitoring/inst
    prometheus_replica: prometheus-inst-0
alerting:
  alert_relabel_configs:
  - separator: ;
    regex: prometheus_replica
    replacement: $1
    action: labeldrop
rule_files:
- /etc/prometheus/rules/prometheus-inst-rulefiles-0/*.yaml
scrape_configs:
- job_name: monitoring/example-app/0
  honor_timestamps: true
  scrape_interval: 30s
  scrape_timeout: 10s
  metrics_path: /metrics
  scheme: http
  kubernetes_sd_configs:
  - role: endpoints
    namespaces:
      names:
      - default
  relabel_configs:
  - source_labels: [__meta_kubernetes_service_label_app]
    separator: ;
    regex: example-app
    replacement: $1
    action: keep
  - source_labels: [__meta_kubernetes_endpoint_port_name]
    separator: ;
    regex: web
    replacement: $1
    action: keep
  - source_labels: [__meta_kubernetes_endpoint_address_target_kind, __meta_kubernetes_endpoint_address_target_name]
    separator: ;
    regex: Node;(.*)
    target_label: node
    replacement: ${1}
    action: replace
  - source_labels: [__meta_kubernetes_endpoint_address_target_kind, __meta_kubernetes_endpoint_address_target_name]
    separator: ;
    regex: Pod;(.*)
    target_label: pod
    replacement: ${1}
    action: replace
  - source_labels: [__meta_kubernetes_namespace]
    separator: ;
    regex: (.*)
    target_label: namespace
    replacement: $1
    action: replace
  - source_labels: [__meta_kubernetes_service_name]
    separator: ;
    regex: (.*)
    target_label: service
    replacement: $1
    action: replace
  - source_labels: [__meta_kubernetes_pod_name]
    separator: ;
    regex: (.*)
    target_label: pod
    replacement: $1
    action: replace
  - source_labels: [__meta_kubernetes_service_name]
    separator: ;
    regex: (.*)
    target_label: job
    replacement: ${1}
    action: replace
  - separator: ;
    regex: (.*)
    target_label: endpoint
    replacement: web
    action: replace