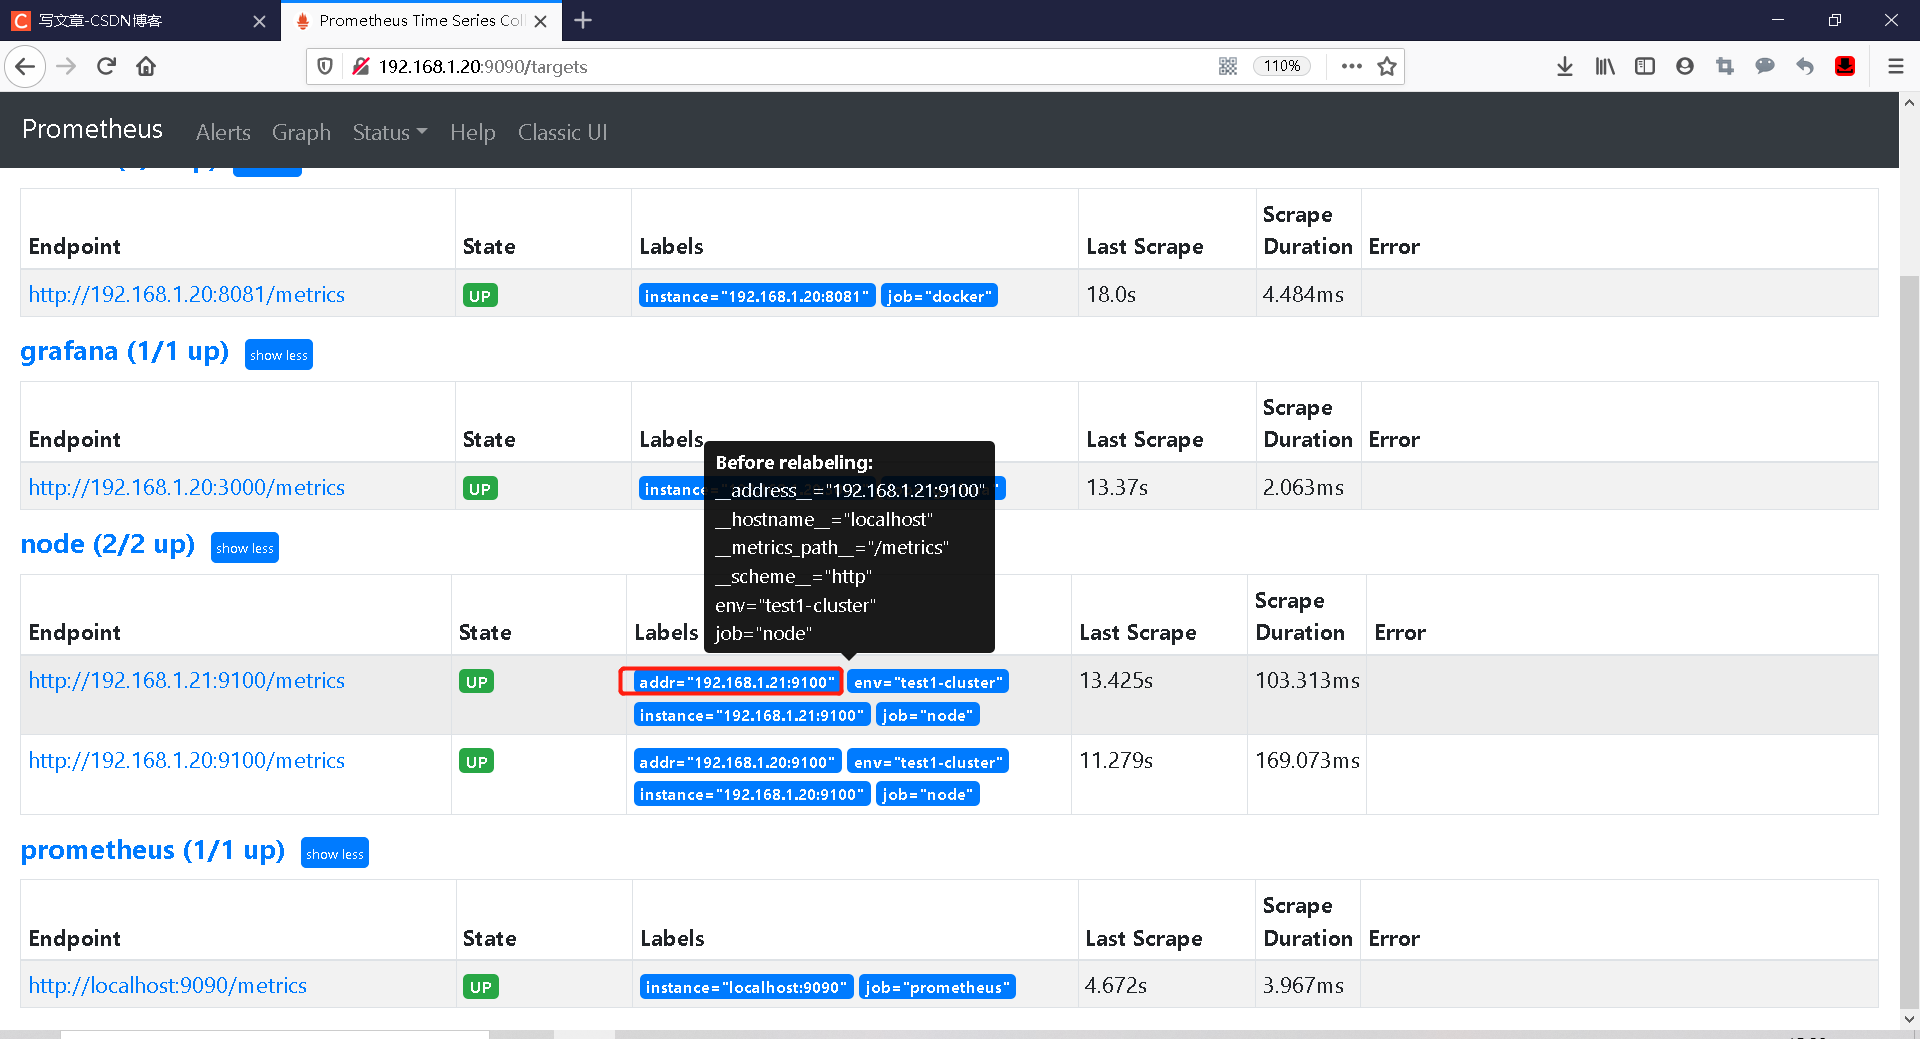
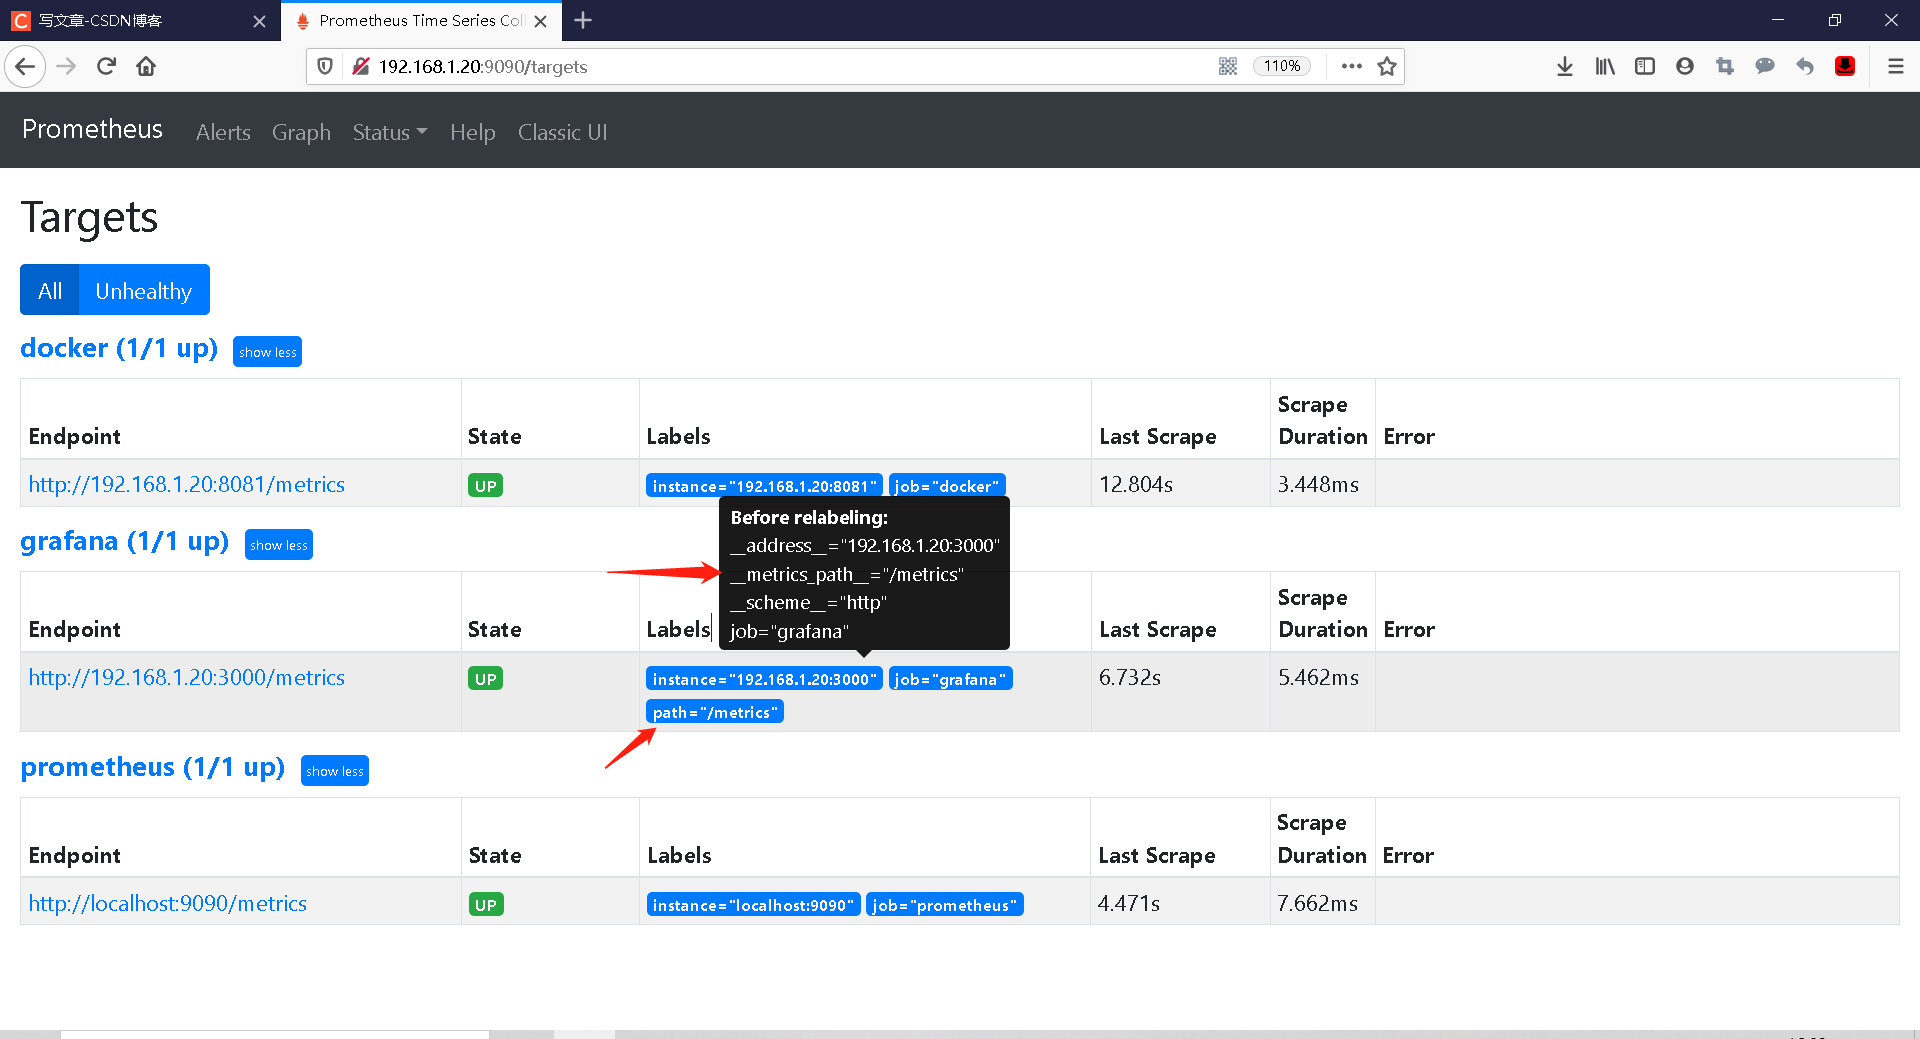
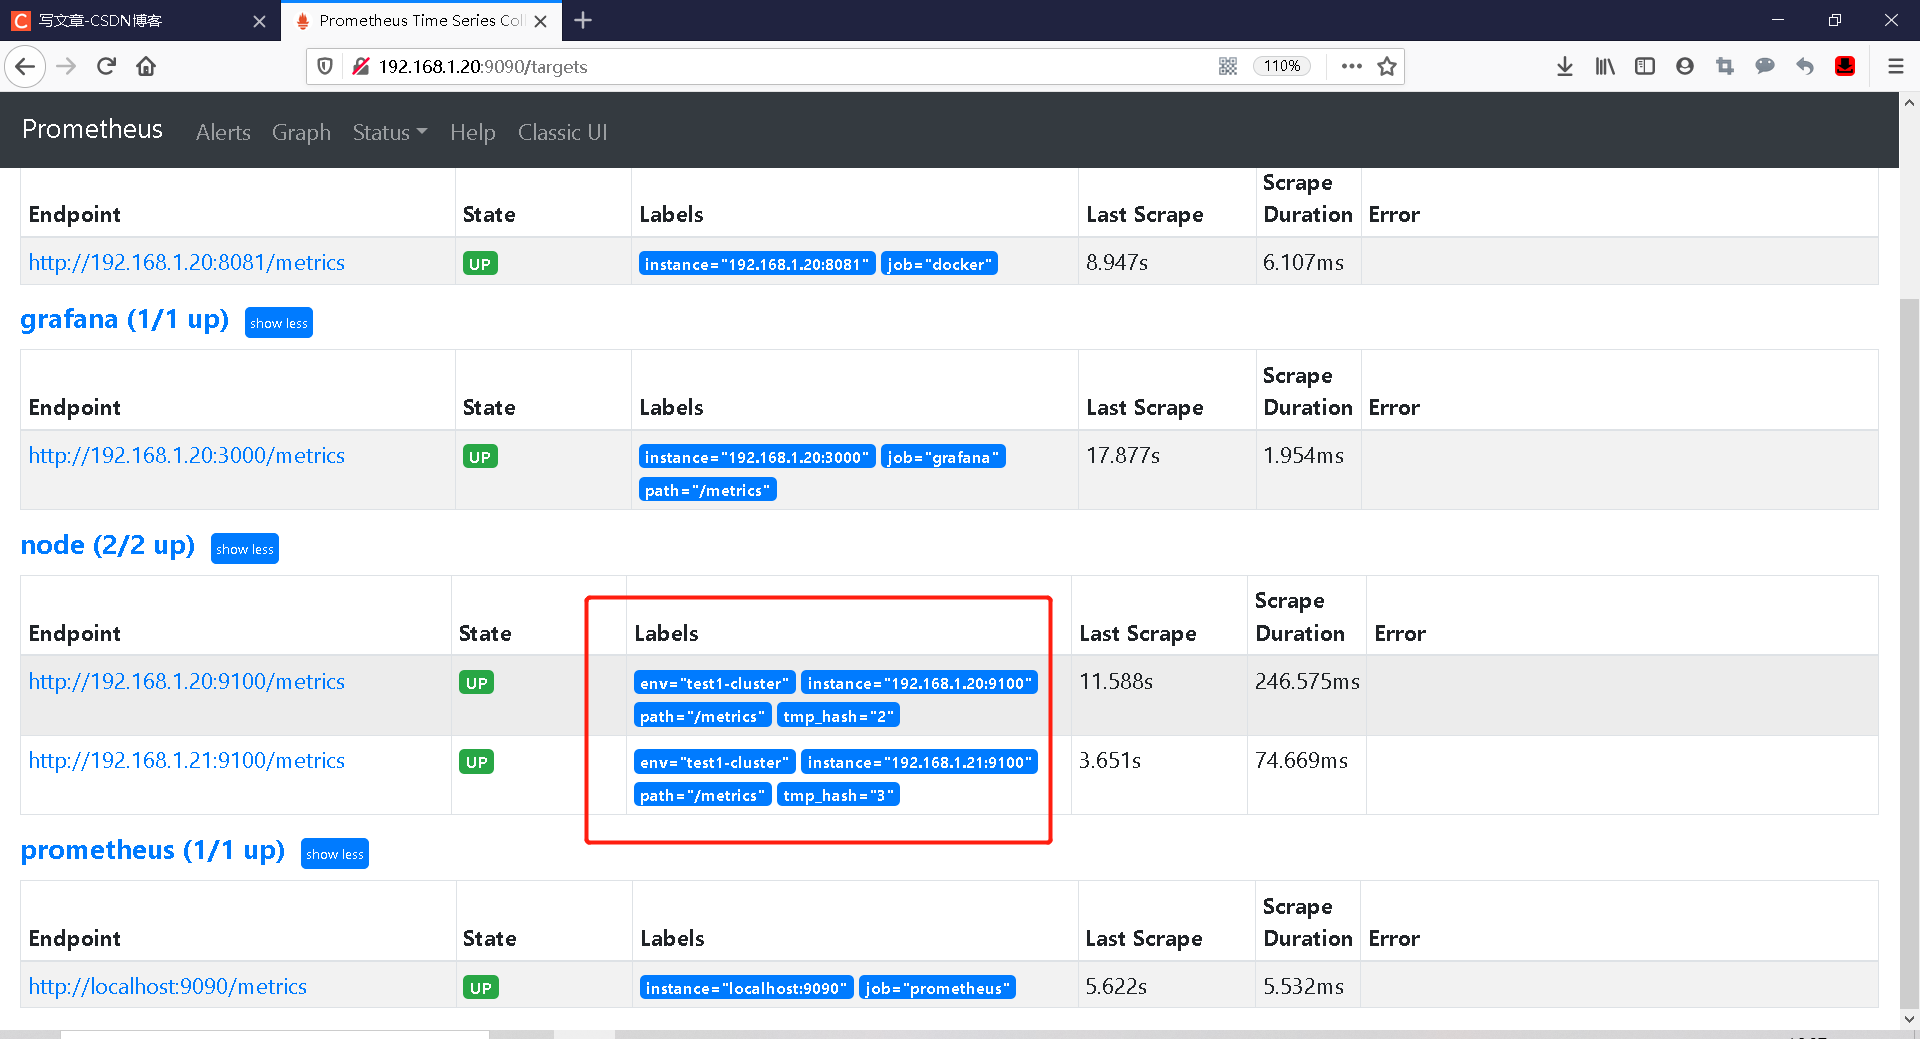
Previously, we have declared the targets instance to monitor and collect our node service status, as follows
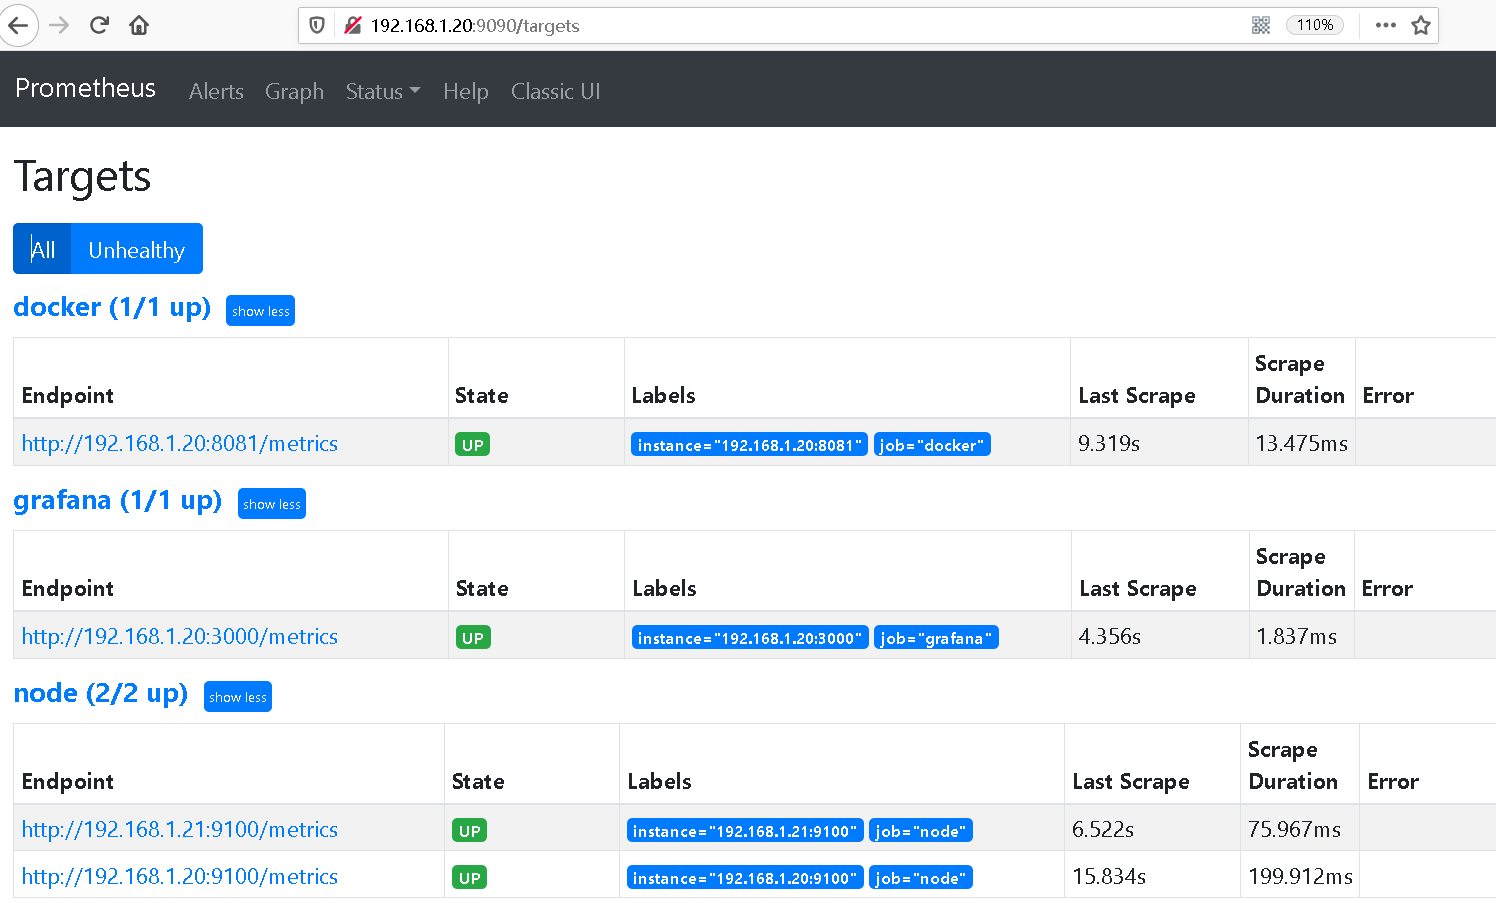
However, when prometheus loads the target instance, there will be some default tags. We put the mouse over the label and it will be displayed
These tags will help us to declare how prometheus should get indicators from the target instance
I Common system built-in labels
__address__              #Access address of current Target instance < host >: < port >
__scheme__               #Collect the HTTP Scheme, HTTP or HTTPS of the access address of the target service
__metrics_path__         #Access path of the access address of the collection target service
__param_<name>           #Collect the request parameters contained in the target service of the task
Generally speaking, targets are marked with "_" As the front is the built-in tags of the system, which will not be written into the indicator data
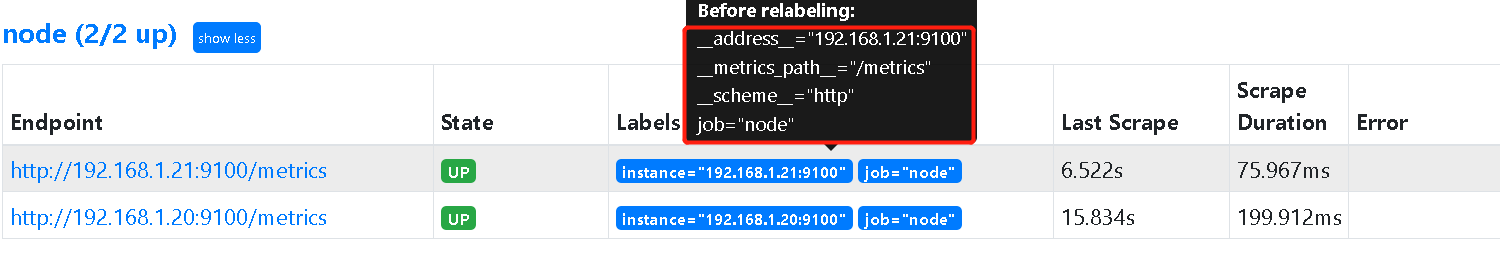
However, there will be some exceptions. For example, we learned earlier that the data collected by prometheus contains the label of instance
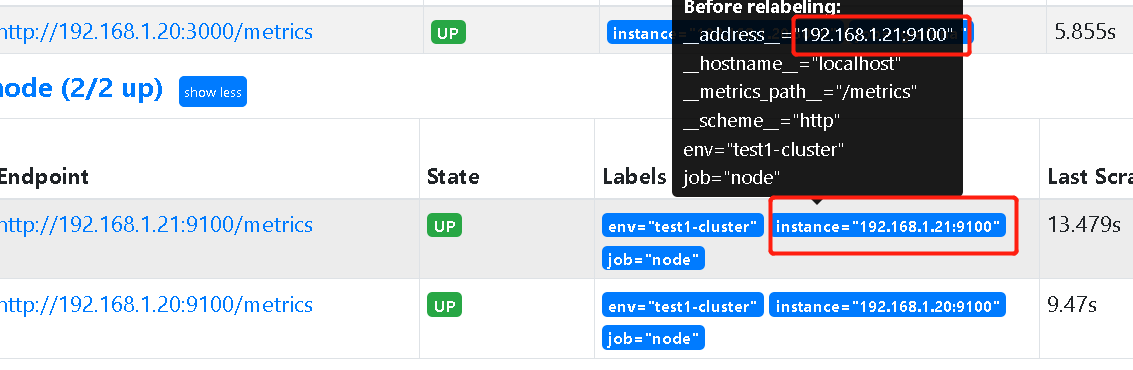
The contents of these tags correspond to those in the target instance__ address__ The label is actually rewritten here
II Custom label
#First, let's take a look at the basic configuration of node exporter
- job_name: 'node'
    static_configs:
      - targets: ['192.168.1.21:9100']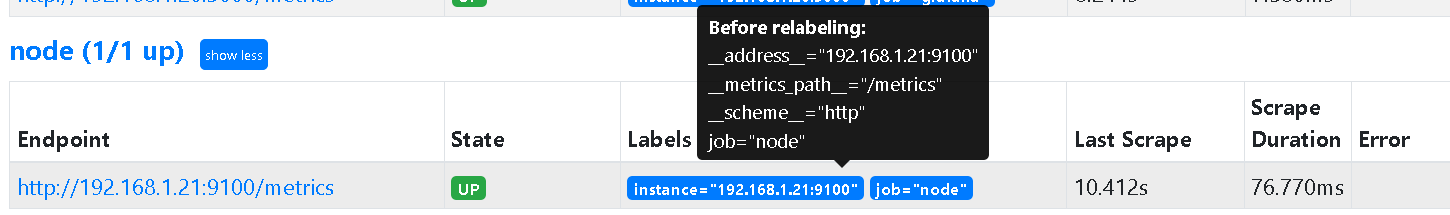
From the above figure, we can get some brief information. On this basis, we can add some custom tags
  - job_name: 'node'
    static_configs:
      - targets: ['192.168.1.21:9100']

        labels:                    #Add label
          env: test1-cluster
          __hostname__: localhost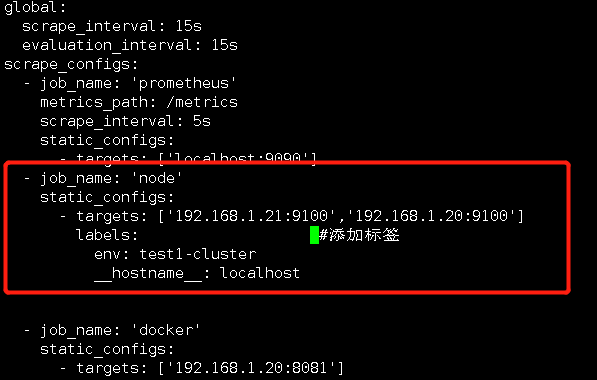
Overload configuration
curl -XPOST http://localhost:9090/-/reload
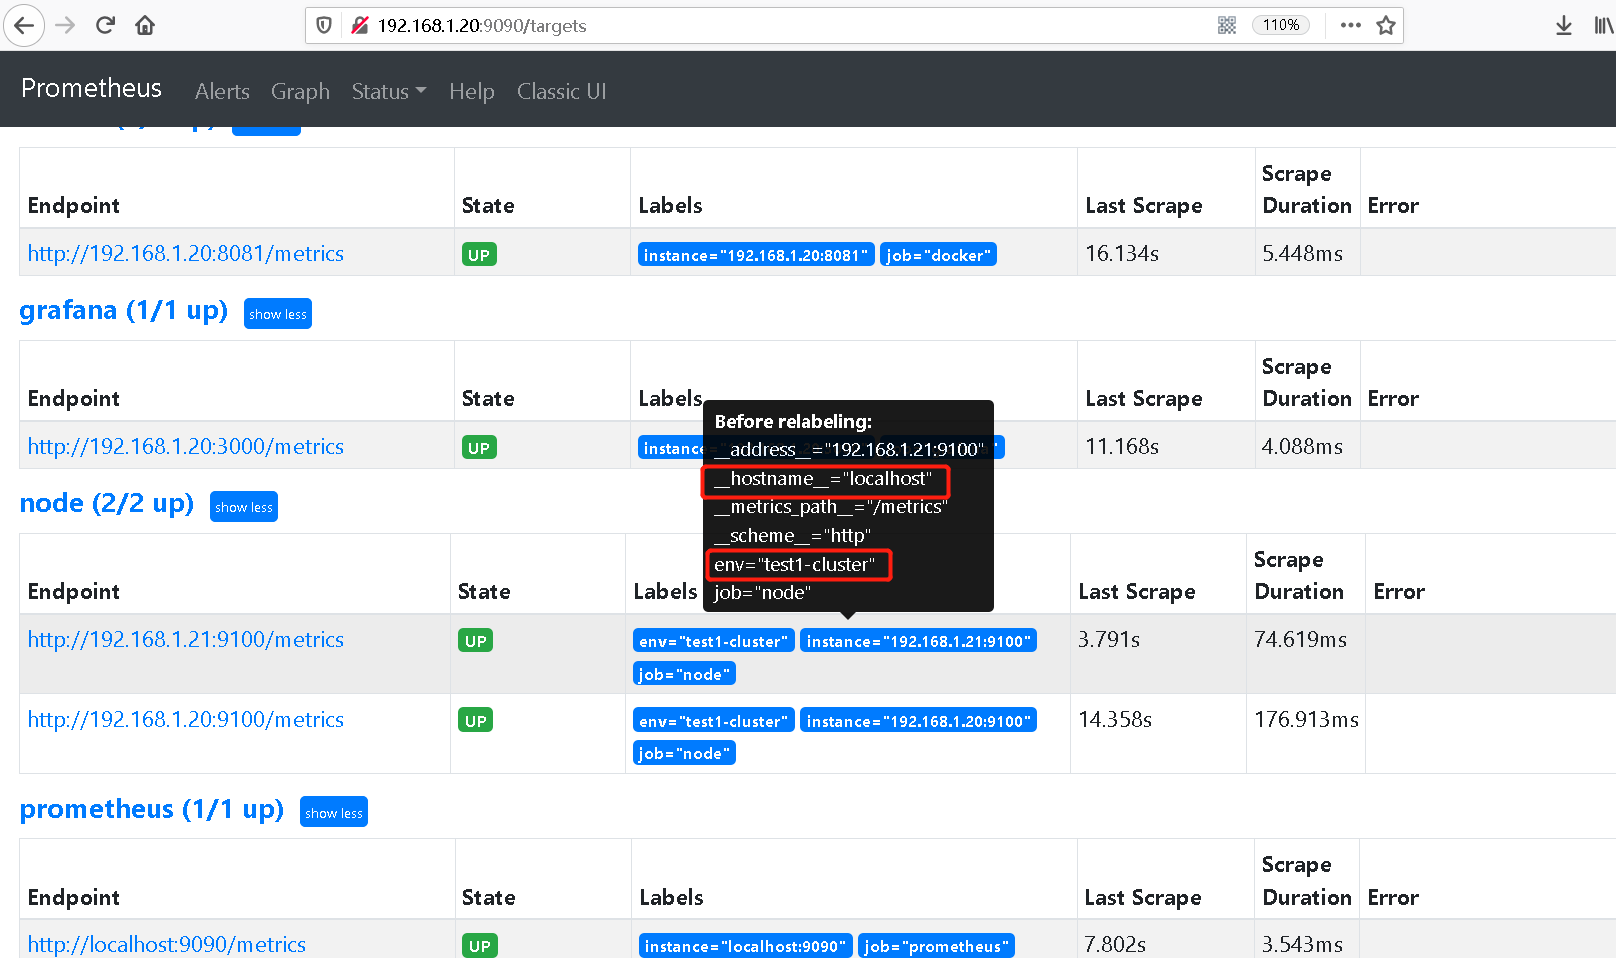
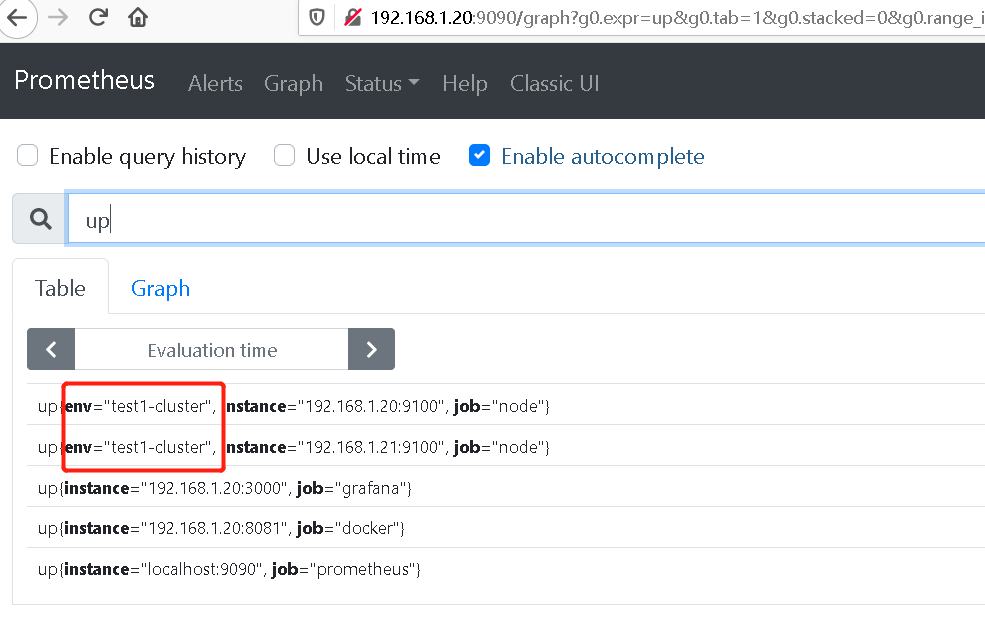
As we said earlier, take__ The prefix label will not appear in the indicator display, as shown in the following figure
As shown in the figure above, we successfully added two tags to the instance (env, _hostname _), When there are many cluster environments, we will deploy prometheus services on each cluster
In order to make the alertmanager alarm accurate, we need to set a label unique to our current cluster on different prometheus servers
III Label rewriting
In fact, we have encountered rewriting operations before, as follows. In fact, instance is controlled by__ address__ Rewritten
Maybe it's a little confused to say so. Let's make a small case
Case 1 rewriting and adding
    relabel_configs:
      - source_labels: [ '__address__' ]
        target_label:  'addr'


#Our operation here is to "label the built-in system"__ address__'
#Override to addr, and the value directly inherits the previous value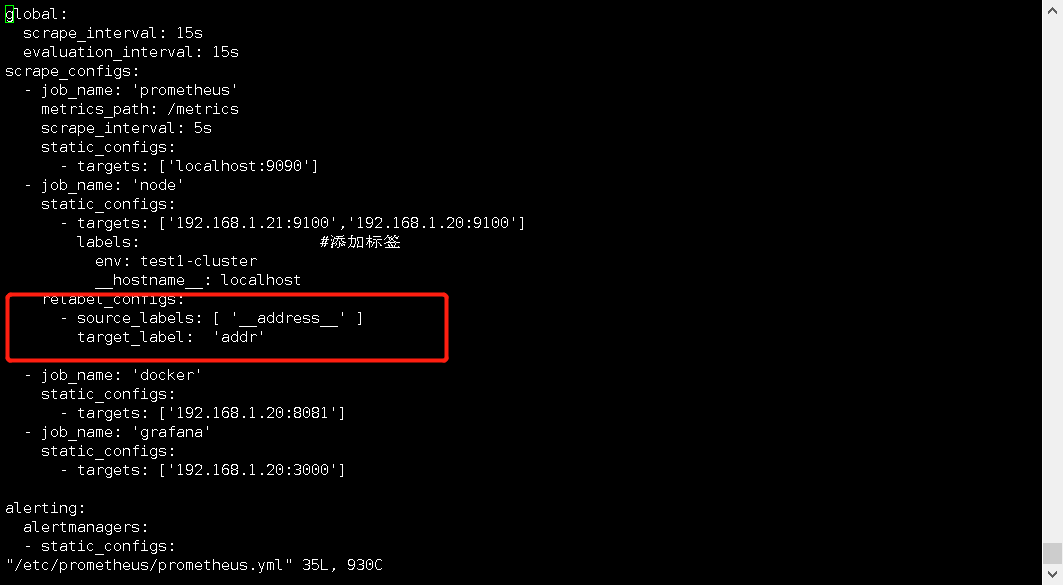
heavy load
curl -XPOST http://localhost:9090/-/reload
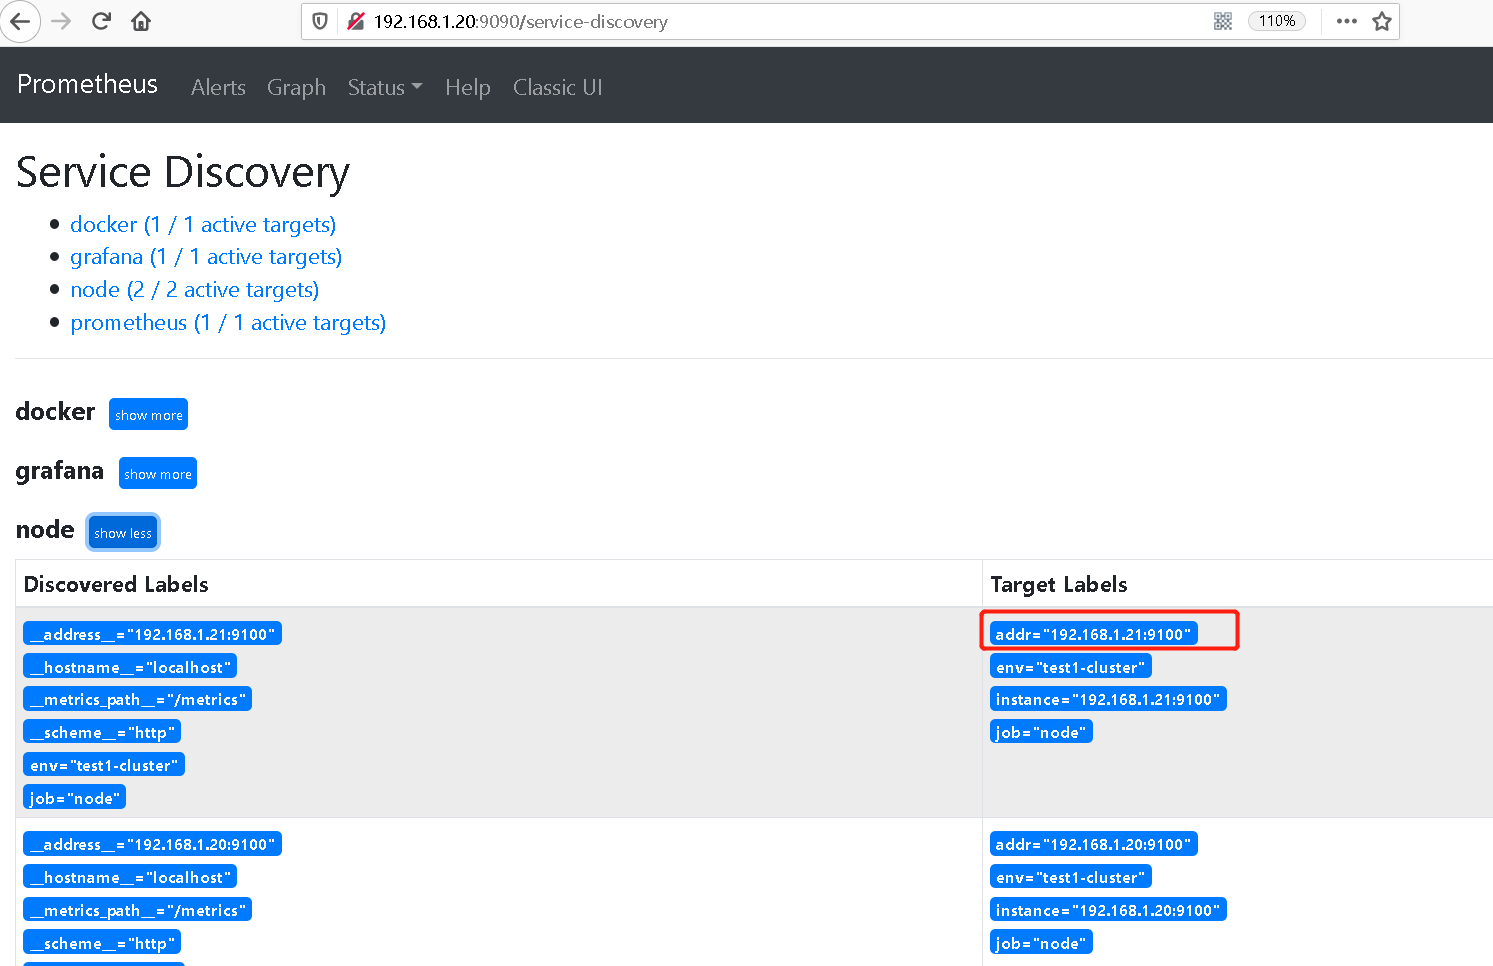
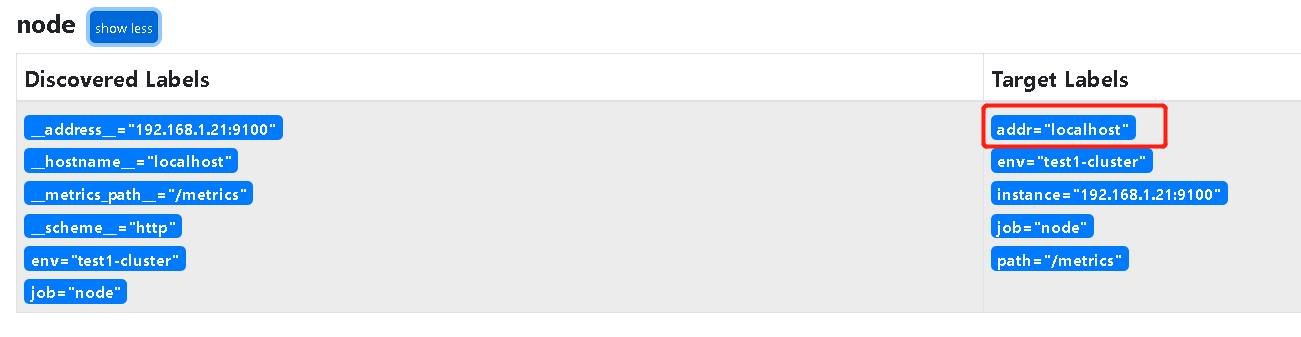
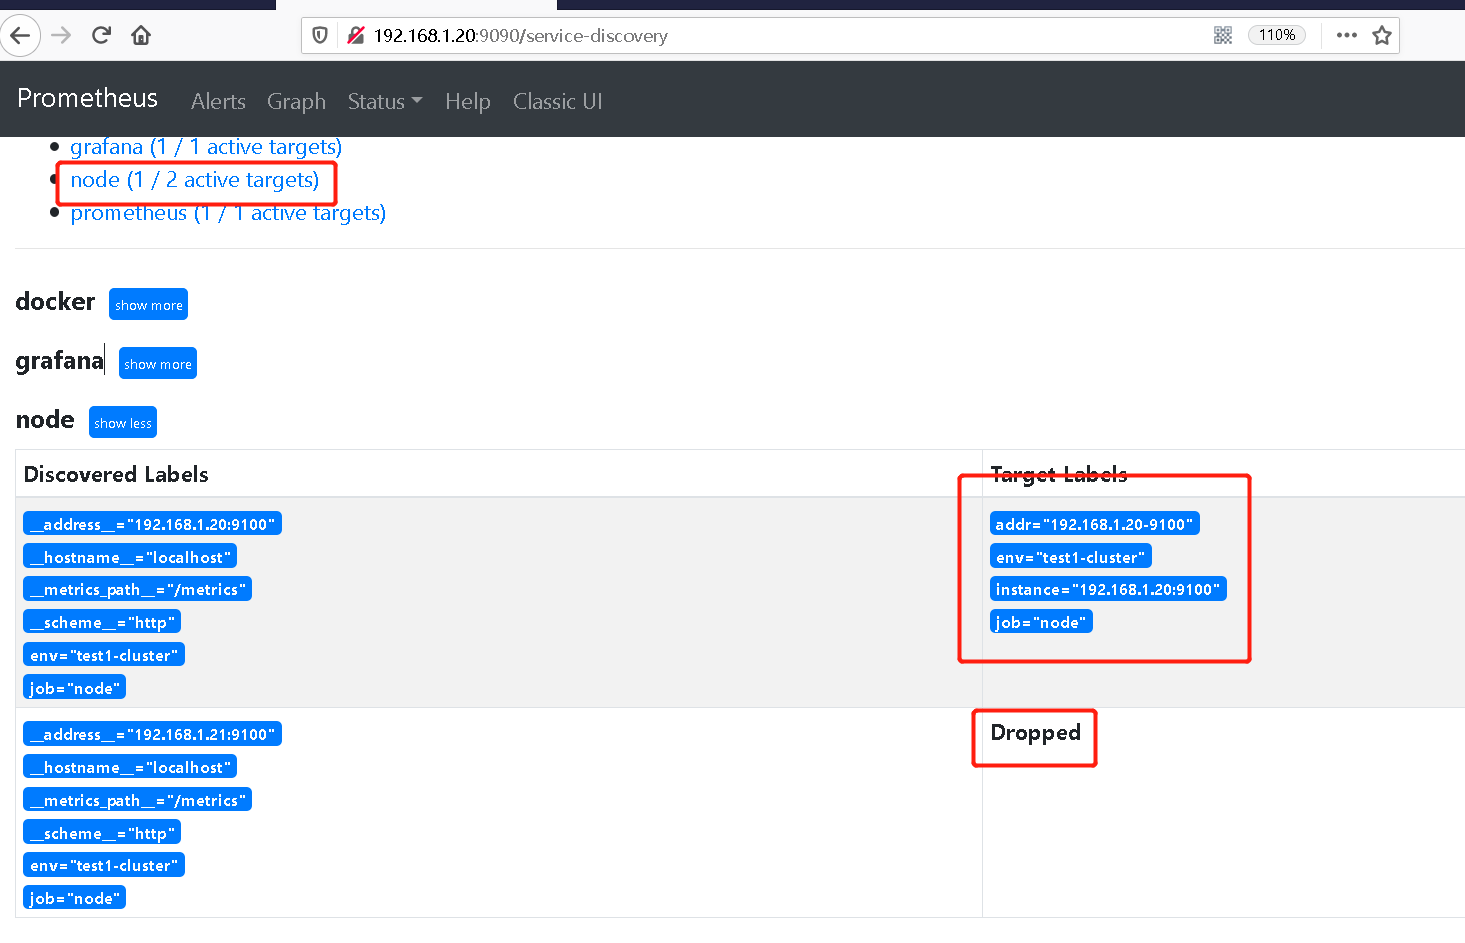
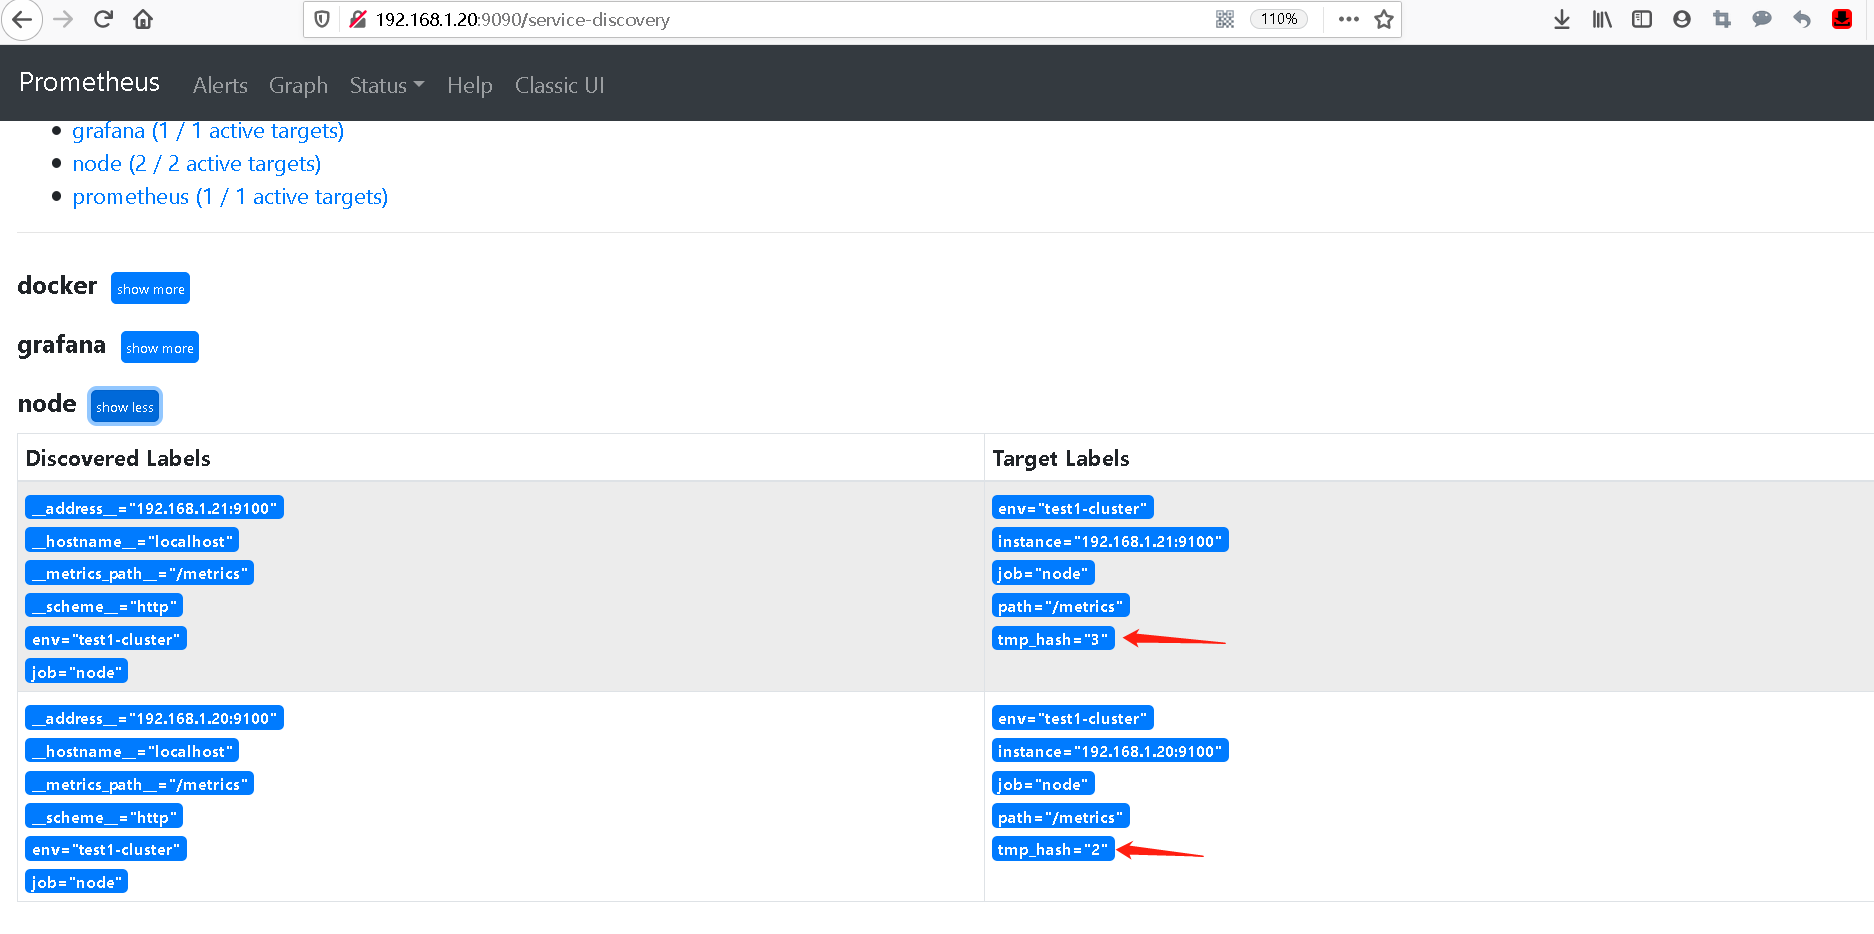
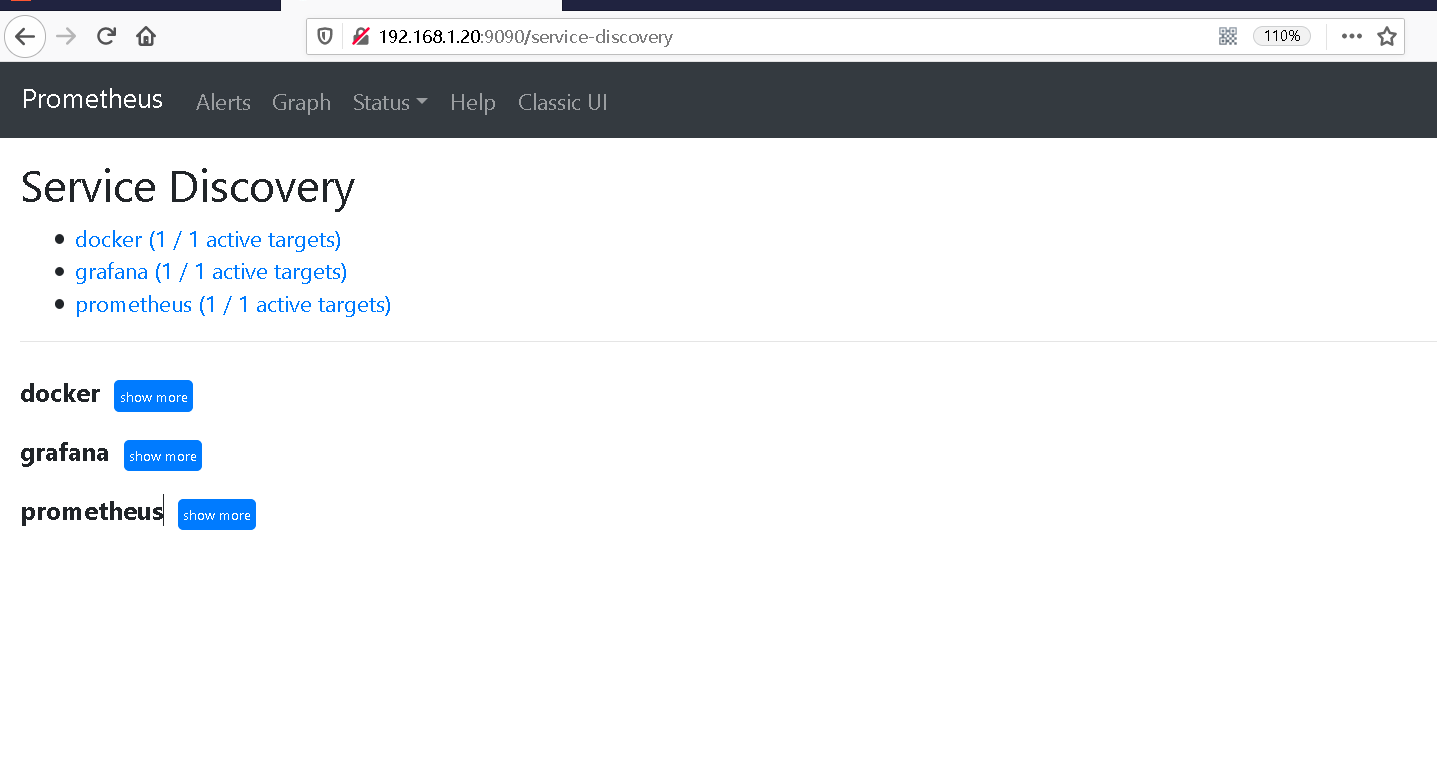
It's equivalent to redefining a new tag from the built-in tag of address, but it's a little eye-catching from the targets. We can also check it from the service discovery
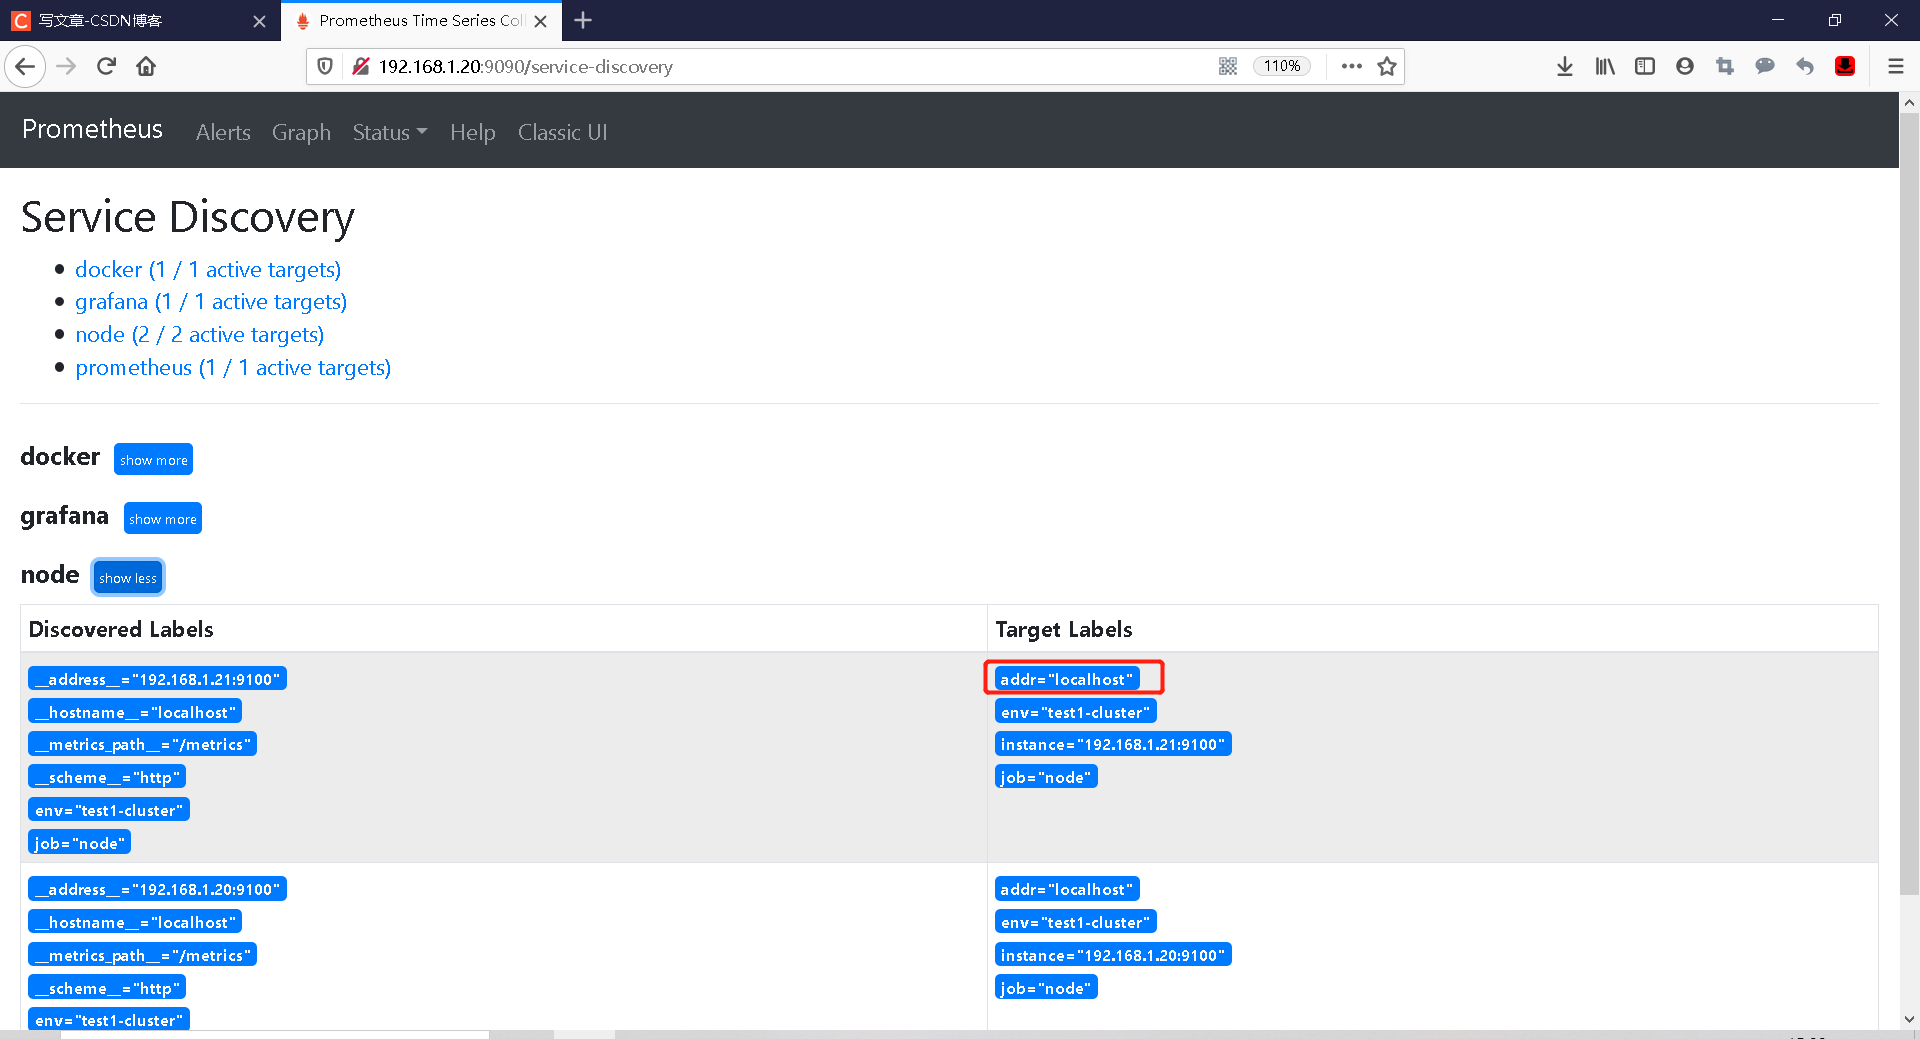
Case 2 rewrite override
This is similar to the above, except that we will not use the value of the meta tag, but instead use our custom value
    relabel_configs:
      - source_labels: [ '__address__' ]
        target_label:  'addr'
        replacement: 'localhost'  #add to
Heavy load
curl -XPOST http://localhost:9090/-/reload
Little knowledge
#We can set multiple source tags
#Then through the separator:_ Declaration separator
#To more accurately define the value of the target tag
#as follows

      - source_labels: ['__address__','job']
        separator: _
        target_label: addr

#We'll get
192.168.1.20:9100_node
Case 3 regular rewriting
The value we rewritten above is not accurate, the newly added value is not accurate, and the overwritten value is inconvenient
We can use regularization to ensure that we match the value we need
relabel_configs:
- source_labels: [ '__address__' ]
target_label: 'addr'
regex: "(.*):(.*)" #add to
replacement: $1-$2 #modify
#Here's for those who don't know much about regularity
#The above remains unchanged. The obtained value should be 192.168.1.20:9100
#We use the regex parameter to represent regular matching, and the matched values are divided into two blocks
#$1 192.168.1.20
#$2 9100
#The set value of replacement is $1 - $2
#Then the value should be 192.168.1.20-9100
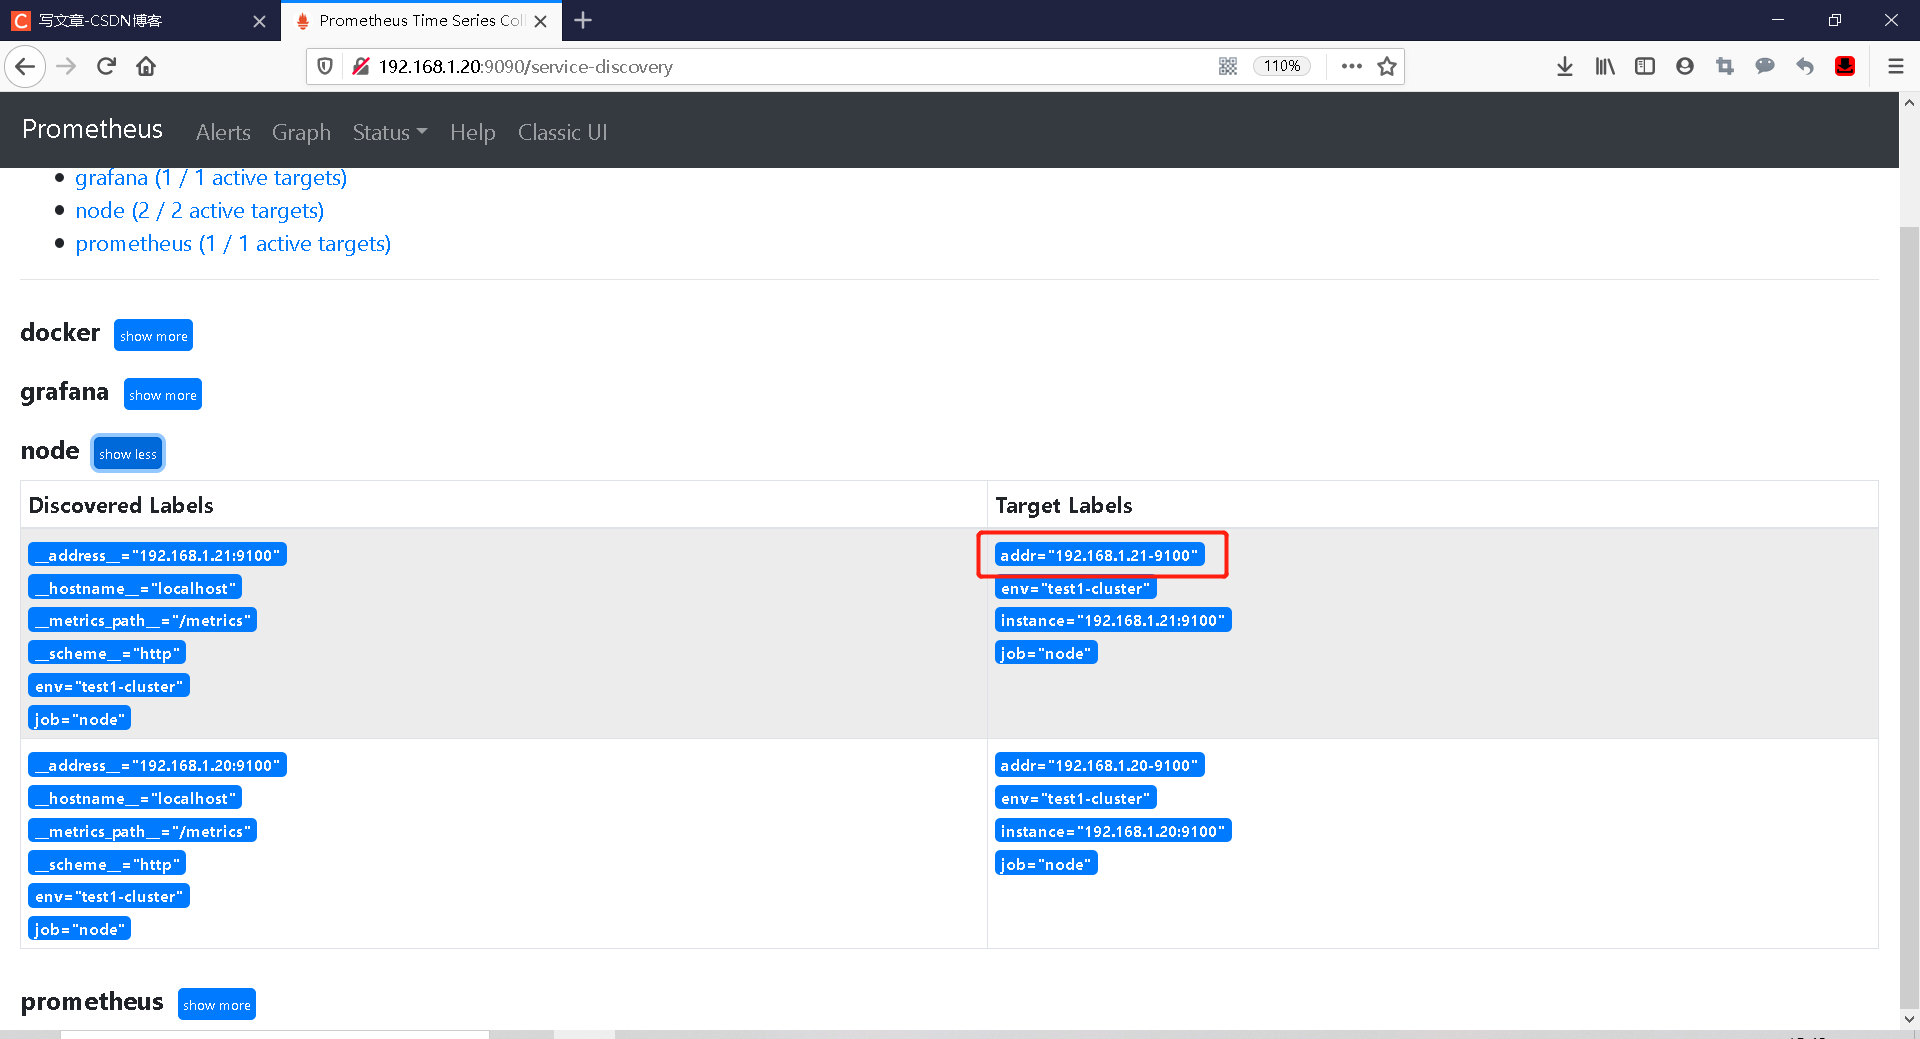
#Let's see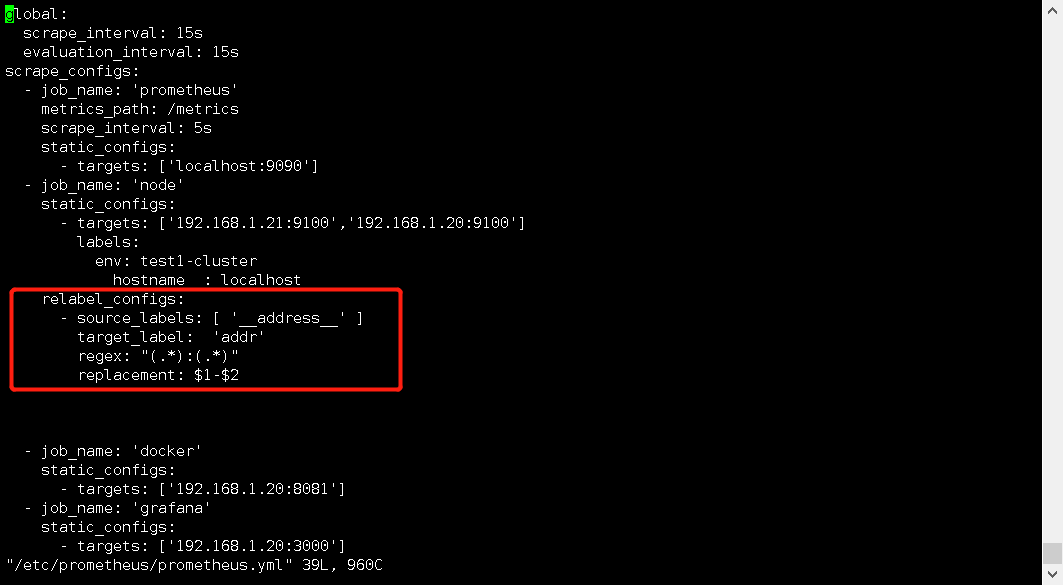
curl -XPOST http://localhost:9090/-/reload
Case 4 rewrite drop 1
I now have a target that doesn't need to be collected. I need to discard all the indicators collected later
drop uses regular to match whether the source tag matches the corresponding value. If it matches, the data will be discarded
      - source_labels: ['addr']
        regex: "192.168.1.21-9100"
        action: drop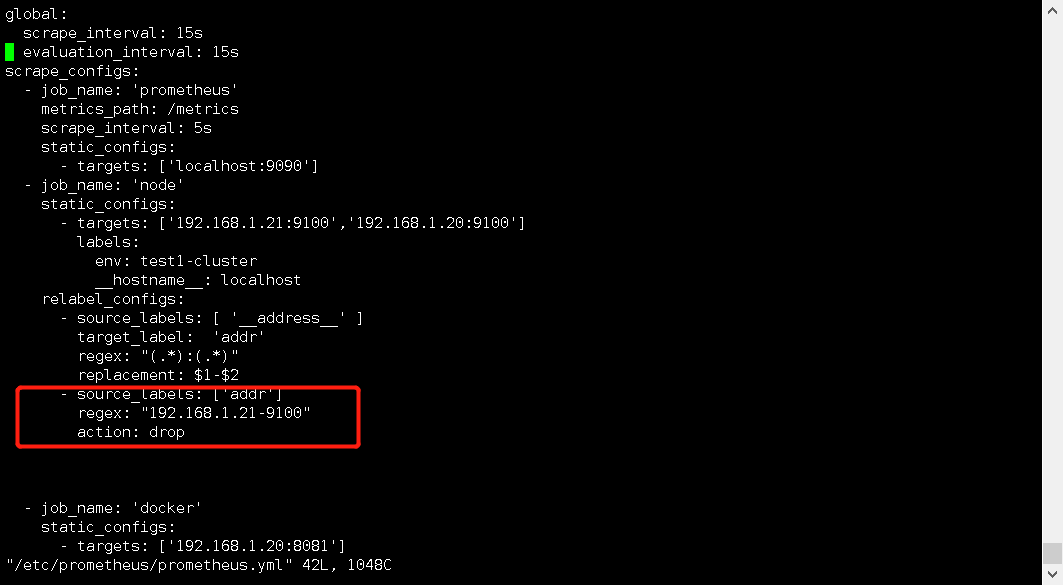
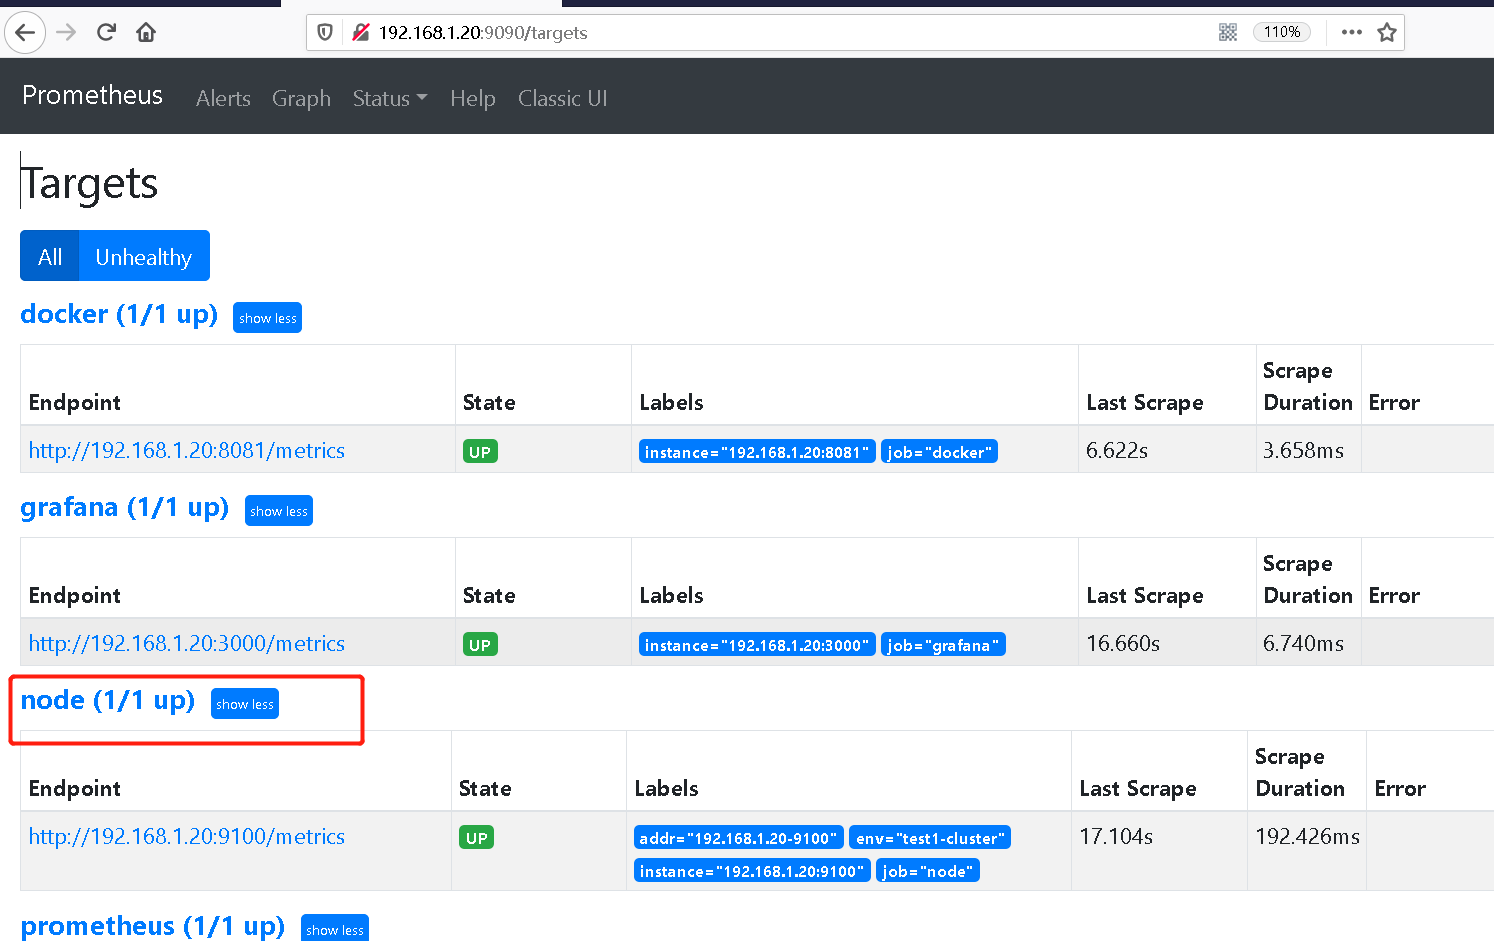
As configured above, drop will match the value of the source tag addr. If it matches, all subsequent indicators will be discarded and the targets status will be set to drop
Case 5 rewrite discard 2 (keep)
In contrast to drop, delete the source of the directory that does not match the connection_ labels
      - source_labels: ['addr']
        regex: "192.168.1.21-9100"
        action: keep
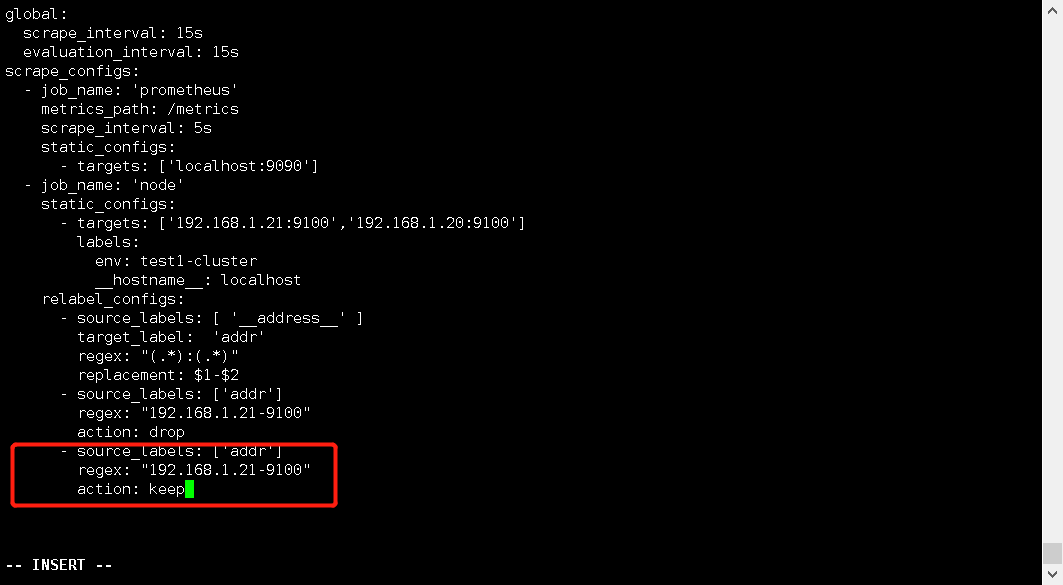
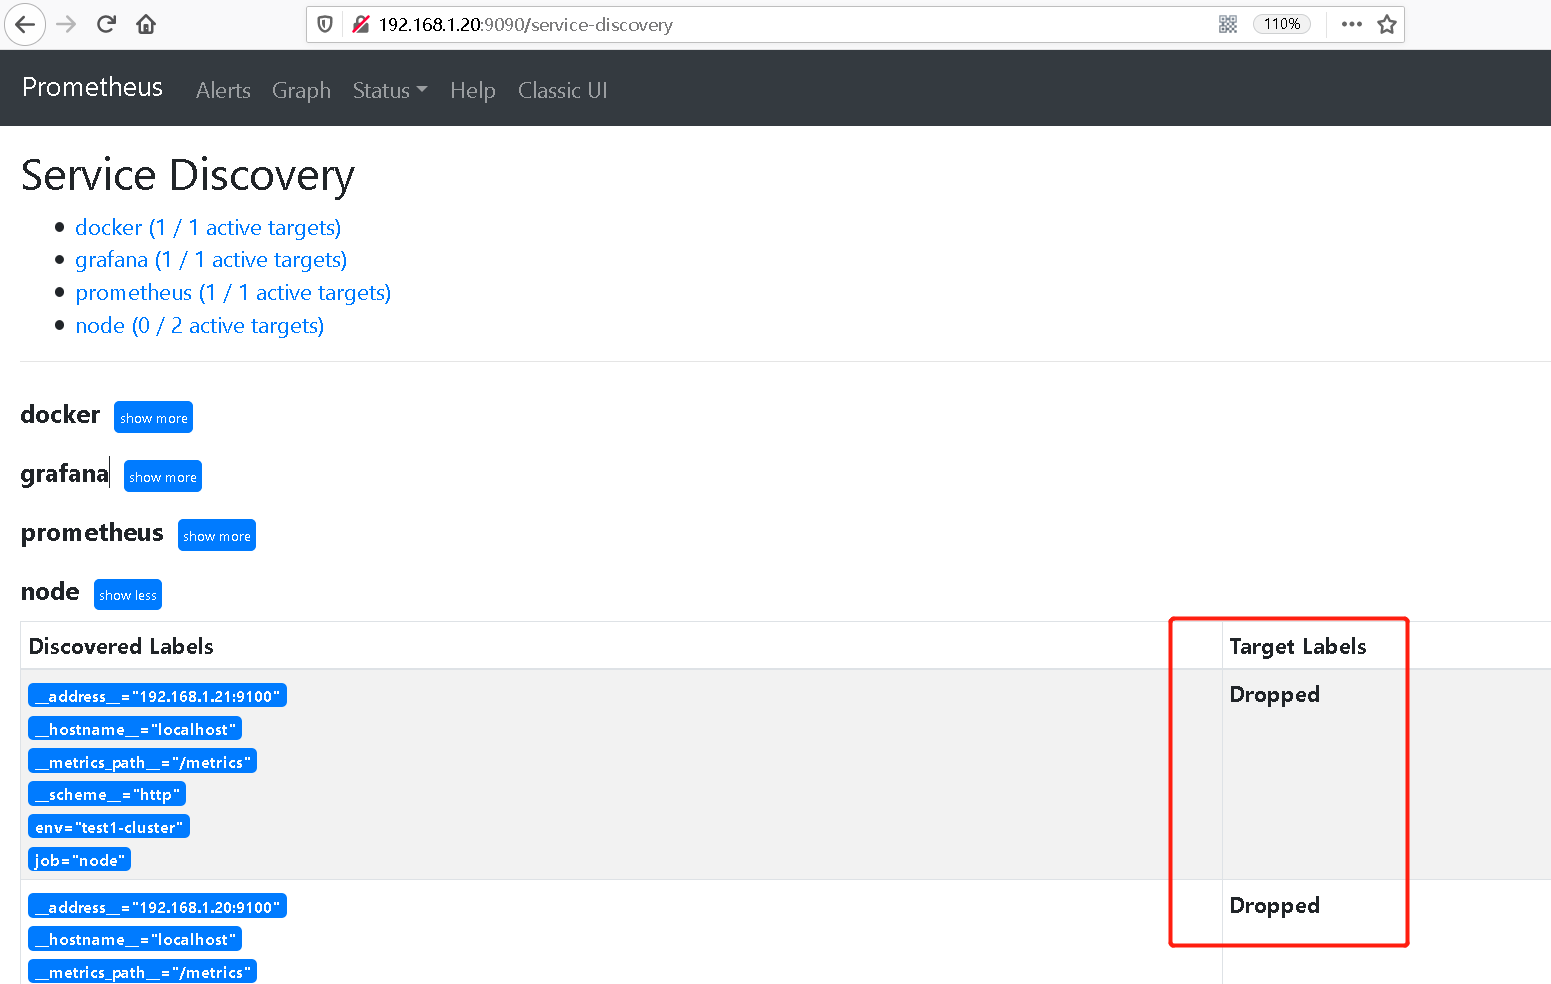
After the above drop matches, the targets are discarded, while keep does not match the label, so 192.168.1.20 should also be discarded
Case 6 label name replacement (labelmap)
We drop ped all the targets of the previous node. Let's comment them out first
      - source_labels: [ '__metrics_path__' ]
        regex: __metrics_(.+)__
        action: labelmap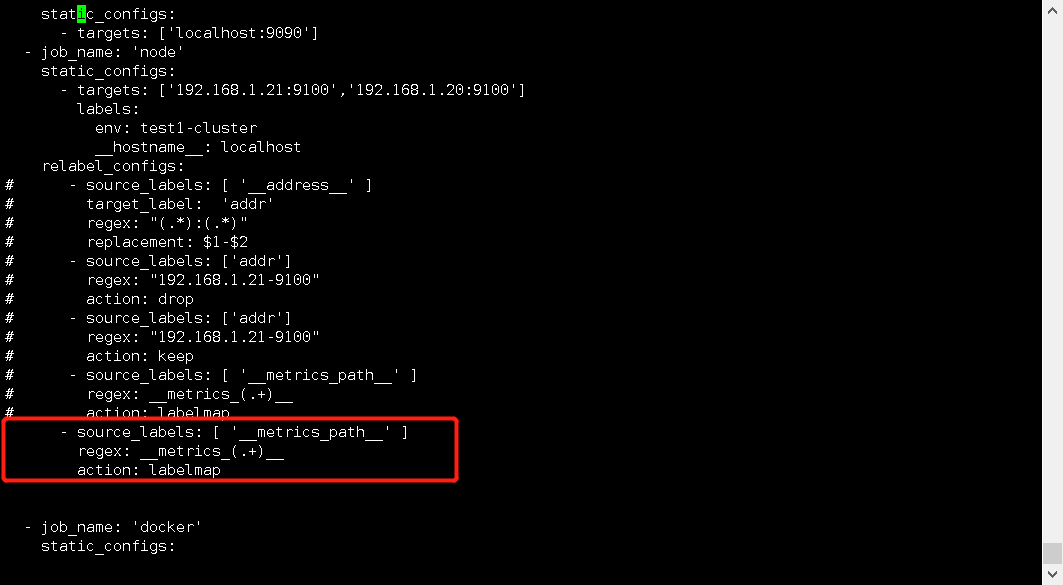
This is actually a bit similar to the above coverage. It uses the regular matching value as the key of the tag, and the value is inherited directly
As follows, it matches the path field in the name of the built-in tag and uses it as the tag name
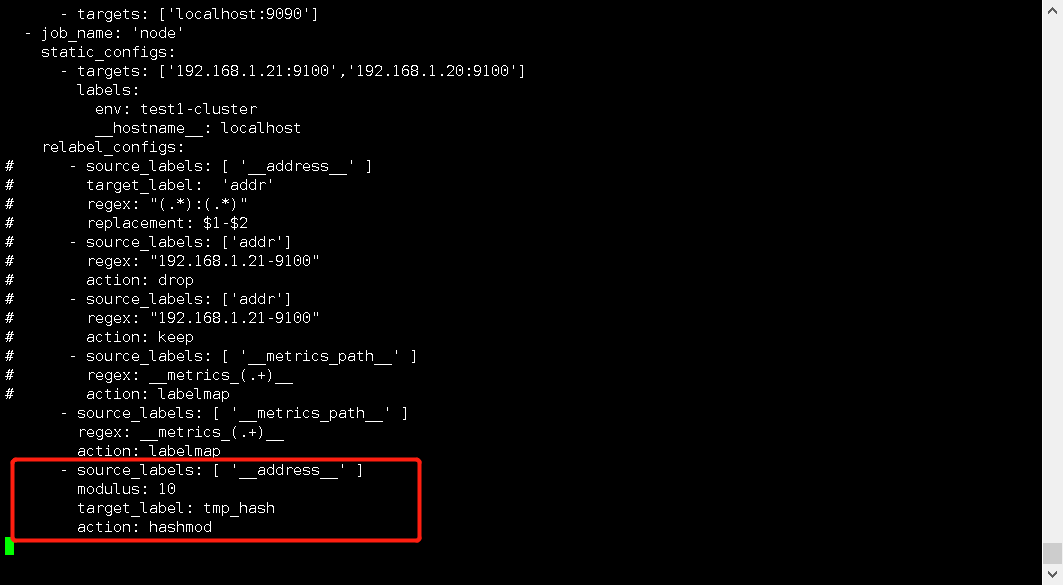
Case 7 hash (hashmod)
When relabel_ When config is set to hashmod, Prometheus will calculate the source according to the value of module as the coefficient_ hash value of labels value.
      - source_labels: [ '__address__' ]
        modulus: 4
        target_label: tmp_hash
        action: hashmod
Overload configuration
curl -XPOST http://localhost:9090/-/reload
Seriously, I don't understand what it is for. I found some information that it is used for hash splitting and horizontal expansion. Thank you for your understanding (≥ ≓≤) ノ
Case 8 label deletion 1 (labeldrop)
labeldrop will delete all matching labels
      - regex: '(job)'
        action: labeldrop
Case 9 label deletion 2 (label keep)
In contrast to label drop, it deletes all mismatched labels
      - regex: '(job)'
        action: labelkeep
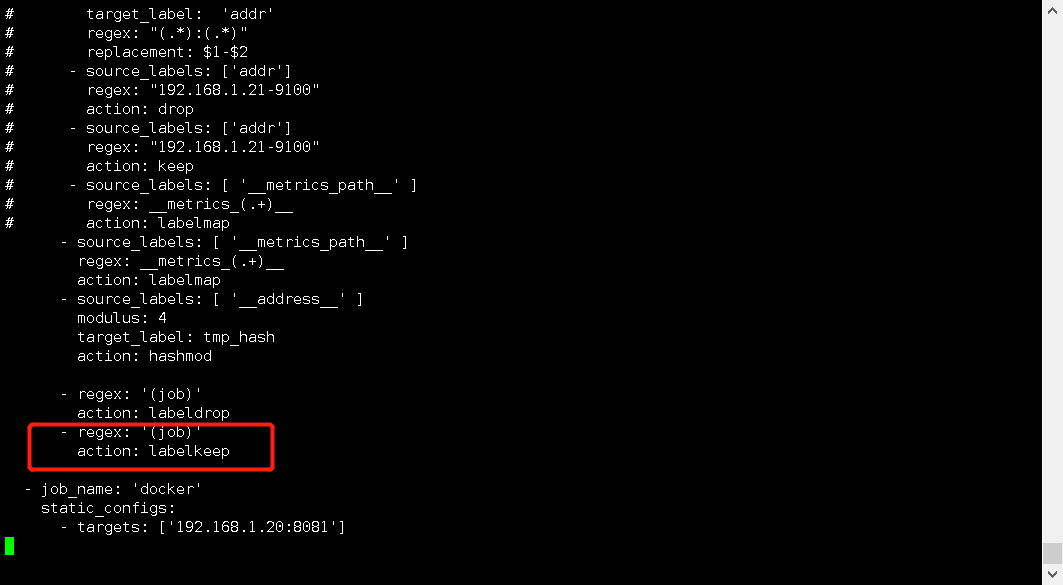
Guess what happens? Yes, not even targets
IV metric_relabel_configs
metric_relabel_configs module and relabel_config is similar, but it has a very common method
That is to throw away the unnecessary data directly. First, let's find out the difference between them
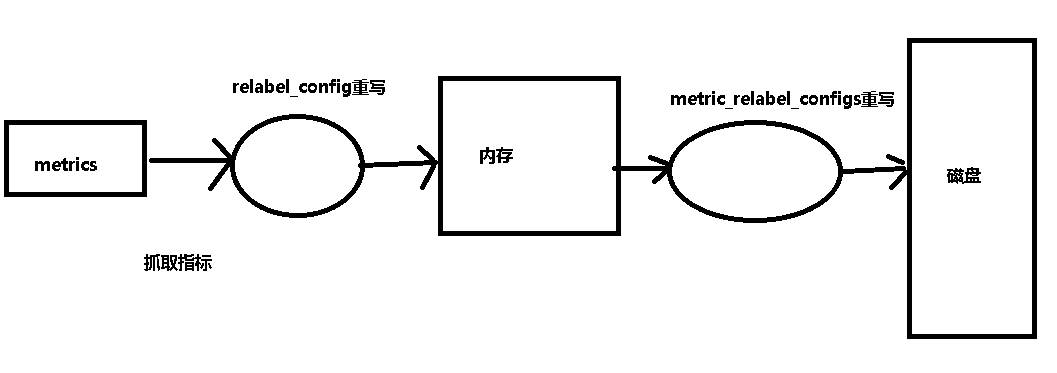
As shown in the figure, prometheus can rewrite the index for the first time before grabbing it into memory
This label can be rewritten before writing to the disk
Delete unnecessary metric
Here, we will comment out the above rewriting operations and add the following configuration
metric_relabel_configs:
- source_labels: [ '__name__' ]
regex: 'node_cpu_seconds_total'
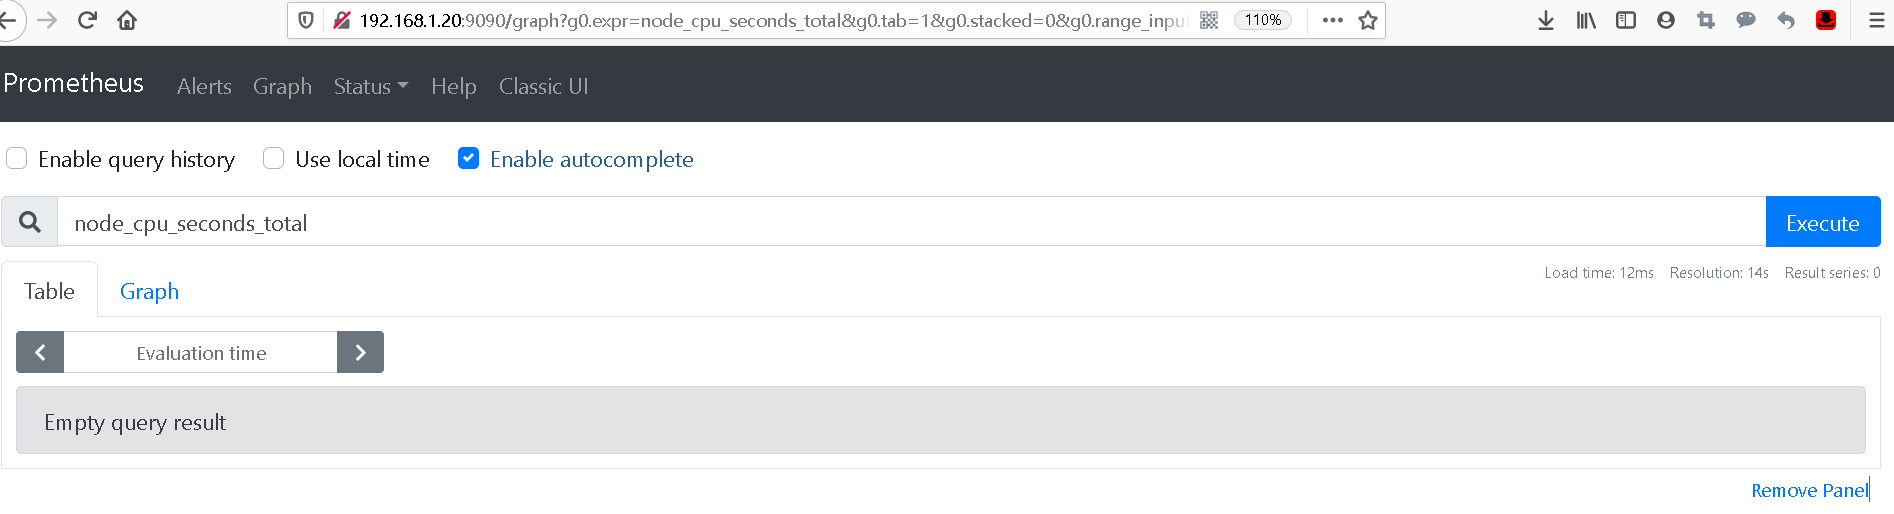
action: drop
#Here__ name__ It is the indicator name, not the label
#This operation is to delete all nodes_ cpu_ seconds_ All total indicators are discardedHeavy load
curl -XPOST http://localhost:9090/-/reload
Let's check manually. There is no data