introduce
In this article, we will see the limitations of Prometheus monitoring technology stack and why moving to Thanos based technology stack can improve indicator retention and reduce overall infrastructure costs.
The content for this presentation can be obtained at the link below and submitted to their respective licenses.
https://github.com/particuleio/teks/tree/main/terragrunt/live/thanoshttps://github.com/particuleio/terraform-kubernetes-addons/tree/main/modules/aws
Kubernetes Prometheus technology stack
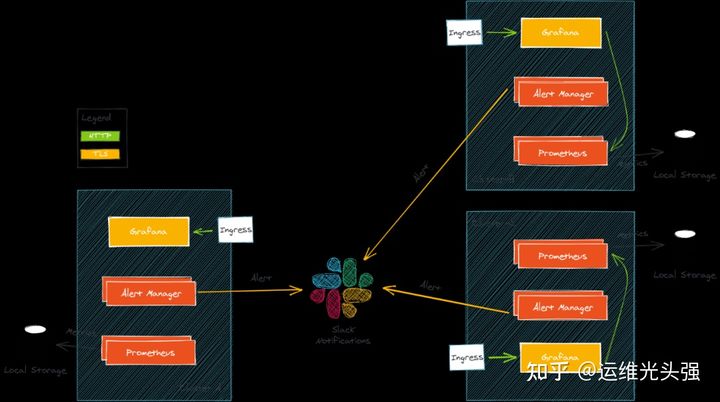
When deploying the Kubernetes infrastructure for our customers, it is standard practice to deploy the monitoring technology stack on each cluster. This stack usually consists of several components:
- Prometheus: collect metrics
- Alarm manager: send alarms to various providers according to index query
- Grafana: visual luxury dashboard
The simplified architecture is as follows:
matters needing attention
This architecture has some considerations. When the number of clusters from which you want to obtain indicators increases, its scalability and scalability are not very good.
Multiple Grafana
In this setting, each cluster has its own Grafana and its own set of dashboards, which is very troublesome to maintain.
Storing indicator data is expensive
Prometheus stores indicator data on disk. You must choose between storage space and indicator retention time. If you want to store data for a long time and run on a cloud provider, the cost of block storage may be high if you store TB of data. Similarly, in a production environment, Prometheus often uses replication or fragmentation or both, which can double or even quadruple storage requirements.
Solution
Multiple Grafana data sources
Prometheus endpoints can be exposed on an external network and added to a single Grafana as a data source. You only need to use TLS or TLS and basic authentication on the Prometheus external endpoint to achieve security. The disadvantage of this solution is that it cannot be calculated based on different data sources.
Prometheus Federation
Prometheus Federation allows you to grab Prometheus from Prometheus. This solution works well when you don't grab a lot of indicator data. In terms of scale, if the capture duration of all Prometheus targets is longer than the capture interval, you may encounter some serious problems.
Prometheus remote write
Although remote writing is a solution (also implemented by Thanos receiver), we will not discuss the "push metrics" section in this article. You can read about the pros and cons of push metrics here [1]. It is recommended to use indicators as a last resort when you do not trust multiple clusters or tenants (for example, when building Prometheus as a service provider). Anyway, this may be the subject of future articles, but we will focus on crawling here.
Thanos, it's coming
Thanos is an "open source, highly available Prometheus system with long-term storage capacity". Many well-known companies are using thanos, which is also part of the CNCF incubation project.
A major feature of Thanos is that it allows "unlimited" storage space. By using object storage (such as S3), almost every cloud provider provides object storage. If you run in a prerequisite environment, object storage can be provided through solutions such as rook or minio.
How does it work?
Thanos and Prometheus fight side by side. It is common to upgrade from Prometheus to thanos.
Thanos is divided into several components, each component has a target (each service should be like this:), and components communicate through gRPC.
Thanos Sidecar
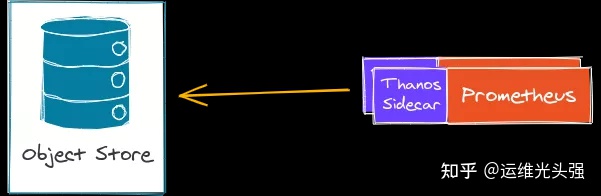
Thanos runs with Prometheus (there is a side car) and outputs Prometheus metrics to an object repository every 2 hours. This makes Prometheus almost stateless. Prometheus still keeps 2-hour metrics in memory, so in case of downtime, you may still lose 2-hour metrics (this problem should be handled by your Prometheus settings, using HA / shards instead of thanos).
Thanos sidecar, together with the Prometheus operator and the Kube Prometheus stack, can be easily deployed. This component acts as a store for thanos queries.
Thanos storage
The Thanos store acts as a gateway to transform queries into remote object stores. It can also cache some information on local storage. Basically, this component allows you to query the object store for metrics. This component acts as a store for Thanos queries.
Thanos Compactor
Thanos comparator is a singleton (it is not scalable), which is responsible for compressing and reducing indicators stored in object storage. Downsampling is the relaxation of index granularity over time. For example, you may want to keep your indicator for 2 or 3 years, but you don't need as many data points as yesterday's indicator. This is the function of the compressor, which can save bytes on object storage, so as to save costs.
Thanos Query
Thanos query is the main component of thanos. It is the central point to send PromQL query to thanos. Thanos query exposes a Prometheus compatible endpoint. It then assigns the query to all "stores". Remember, the Store can be any other thanos component that provides metrics. Thanos queries can send queries to another thanos query (they can be stacked).
- Thanos Store
- Thanos Sidecar
- Thanos Query
It is also responsible for deduplication of the same indicators from different stores or Prometheus. For example, if you have a metric value in Prometheus and also in the object Store, Thanos Query can de duplicate the metric value. In the case of Prometheus HA settings, data deduplication is also based on Prometheus replicas and Shards.
Thanos Query Frontend
As its name implies, the Thanos query front end is the front end of Thanos query. Its goal is to split large queries into multiple smaller queries and cache query results (in memory or memcached). There are other components, such as receiving Thanos in the case of remote writing, but this is still not the subject of this article.
Multi cluster architecture
There are many ways to deploy these components to multiple Kubernetes clusters. According to different use cases, some methods are better than others. We can't give a detailed introduction here.
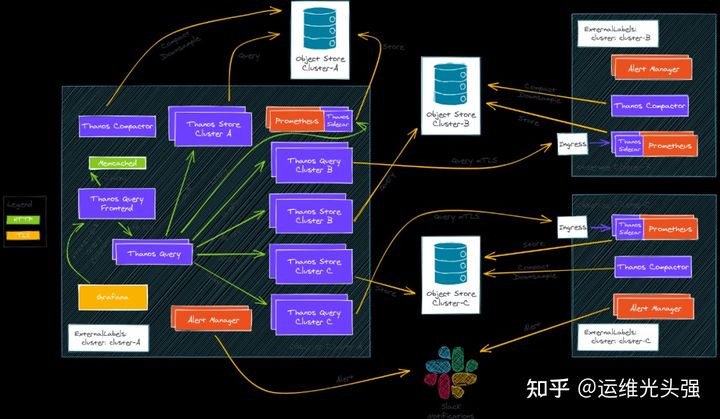
Our example is running on AWS. Two clusters are deployed using tEKS[2]. Our all in one solution deploys the production ready EKS cluster on AWS:
- A cluster of observers [3]
- An observed cluster [4]
Our deployment uses the official Kube Prometheus stack and bitnami thanos charts.
Everything was planned in our terrain kubernetes addons repository.
The directory structure in Thanos demo folder is as follows:
. ├── env_tags.yaml ├── eu-west-1 │ ├── clusters │ │ └── observer │ │ ├── eks │ │ │ ├── kubeconfig │ │ │ └── terragrunt.hcl │ │ ├── eks-addons │ │ │ └── terragrunt.hcl │ │ └── vpc │ │ └── terragrunt.hcl │ └── region_values.yaml └── eu-west-3 ├── clusters │ └── observee │ ├── cluster_values.yaml │ ├── eks │ │ ├── kubeconfig │ │ └── terragrunt.hcl │ ├── eks-addons │ │ └── terragrunt.hcl │ └── vpc │ └── terragrunt.hcl └── region_values.yaml
This allows DRY (don't repeat yourself) infrastructure and can easily expand the number of AWS accounts, regions, and clusters.
Observer cluster
The observer cluster is our main cluster. We will query other clusters from it:
Prometheus is running:
- Grafana enabled
- Thanos side car upload to specific bucket
kube-prometheus-stack = {
  enabled                     = true
  allowed_cidrs               = dependency.vpc.outputs.private_subnets_cidr_blocks
  thanos_sidecar_enabled      = true
  thanos_bucket_force_destroy = true
  extra_values                = <<-EXTRA_VALUES
    grafana:
      deploymentStrategy:
        type: Recreate
      ingress:
        enabled: true
        annotations:
          kubernetes.io/ingress.class: nginx
          cert-manager.io/cluster-issuer: "letsencrypt"
        hosts:
          - grafana.${local.default_domain_suffix}
        tls:
          - secretName: grafana.${local.default_domain_suffix}
            hosts:
              - grafana.${local.default_domain_suffix}
      persistence:
        enabled: true
        storageClassName: ebs-sc
        accessModes:
          - ReadWriteOnce
        size: 1Gi
    prometheus:
      prometheusSpec:
        replicas: 1
        retention: 2d
        retentionSize: "10GB"
        ruleSelectorNilUsesHelmValues: false
        serviceMonitorSelectorNilUsesHelmValues: false
        podMonitorSelectorNilUsesHelmValues: false
        storageSpec:
          volumeClaimTemplate:
            spec:
              storageClassName: ebs-sc
              accessModes: ["ReadWriteOnce"]
              resources:
                requests:
                  storage: 10Gi
    EXTRA_VALUES
Generate a CA certificate for the observer cluster:
- This CA will be trusted by the observed cluster entering sidecar
- Generate TLS certificates for Thanos querier components, which will query the observed cluster
Thanos component deployment:
- Thanos components are fully deployed
- Query front end as the data source endpoint of Grafana
- The storage gateway is used to query the observer bucket
- Query will execute queries against the storage gateway and other queriers
Additional Thanos components deployed:
- The Thanos querier configured with TLS queries each observed cluster
thanos-tls-querier = {
  "observee" = {
    enabled                 = true
    default_global_requests = true
    default_global_limits   = false
    stores = [
      "thanos-sidecar.${local.default_domain_suffix}:443"
    ]
  }
}

thanos-storegateway = {
  "observee" = {
    enabled                 = true
    default_global_requests = true
    default_global_limits   = false
    bucket                  = "thanos-store-pio-thanos-observee"
    region                  = "eu-west-3"
  }
Observed cluster
The observed cluster is the Kubernetes cluster, which has the smallest Prometheus/Thanos installation and will be queried by the observed cluster.
Prometheus operator is running:
- Thanos here is a specific bucket uploaded to the observer
- Thanos sidecar is published together with the entry object authenticated by TLS client, and the observer cluster CA is trusted
kube-prometheus-stack = {
  enabled                     = true
  allowed_cidrs               = dependency.vpc.outputs.private_subnets_cidr_blocks
  thanos_sidecar_enabled      = true
  thanos_bucket_force_destroy = true
  extra_values                = <<-EXTRA_VALUES
    grafana:
      enabled: false
    prometheus:
      thanosIngress:
        enabled: true
        ingressClassName: nginx
        annotations:
          cert-manager.io/cluster-issuer: "letsencrypt"
          nginx.ingress.kubernetes.io/ssl-redirect: "true"
          nginx.ingress.kubernetes.io/backend-protocol: "GRPC"
          nginx.ingress.kubernetes.io/auth-tls-verify-client: "on"
          nginx.ingress.kubernetes.io/auth-tls-secret: "monitoring/thanos-ca"
        hosts:
        - thanos-sidecar.${local.default_domain_suffix}
        paths:
        - /
        tls:
        - secretName: thanos-sidecar.${local.default_domain_suffix}
          hosts:
          - thanos-sidecar.${local.default_domain_suffix}
      prometheusSpec:
        replicas: 1
        retention: 2d
        retentionSize: "6GB"
        ruleSelectorNilUsesHelmValues: false
        serviceMonitorSelectorNilUsesHelmValues: false
        podMonitorSelectorNilUsesHelmValues: false
        storageSpec:
          volumeClaimTemplate:
            spec:
              storageClassName: ebs-sc
              accessModes: ["ReadWriteOnce"]
              resources:
                requests:
                  storage: 10Gi
    EXTRA_VALUES
Thanos component deployment:
- Thanos compressor to manage down sampling for this particular cluster
thanos = {
  enabled = true
  bucket_force_destroy = true
  trusted_ca_content      = dependency.thanos-ca.outputs.thanos_ca
  extra_values = <<-EXTRA_VALUES
    compactor:
      retentionResolution5m: 90d
    query:
      enabled: false
    queryFrontend:
      enabled: false
    storegateway:
      enabled: false
    EXTRA_VALUES
}
Go a little deeper
Let's check what's running on the cluster. With regard to observers, we have:
kubectl -n monitoring get pods
NAME                                                        READY   STATUS    RESTARTS   AGE
alertmanager-kube-prometheus-stack-alertmanager-0           2/2     Running   0          120m
kube-prometheus-stack-grafana-c8768466b-rd8wm               2/2     Running   0          120m
kube-prometheus-stack-kube-state-metrics-5cf575d8f8-x59rd   1/1     Running   0          120m
kube-prometheus-stack-operator-6856b9bb58-hdrb2             1/1     Running   0          119m
kube-prometheus-stack-prometheus-node-exporter-8hvmv        1/1     Running   0          117m
kube-prometheus-stack-prometheus-node-exporter-cwlfd        1/1     Running   0          120m
kube-prometheus-stack-prometheus-node-exporter-rsss5        1/1     Running   0          120m
kube-prometheus-stack-prometheus-node-exporter-rzgr9        1/1     Running   0          120m
prometheus-kube-prometheus-stack-prometheus-0               3/3     Running   1          120m
thanos-compactor-74784bd59d-vmvps                           1/1     Running   0          119m
thanos-query-7c74db546c-d7bp8                               1/1     Running   0          12m
thanos-query-7c74db546c-ndnx2                               1/1     Running   0          12m
thanos-query-frontend-5cbcb65b57-5sx8z                      1/1     Running   0          119m
thanos-query-frontend-5cbcb65b57-qjhxg                      1/1     Running   0          119m
thanos-storegateway-0                                       1/1     Running   0          119m
thanos-storegateway-1                                       1/1     Running   0          118m
thanos-storegateway-observee-storegateway-0                 1/1     Running   0          12m
thanos-storegateway-observee-storegateway-1                 1/1     Running   0          11m
thanos-tls-querier-observee-query-dfb9f79f9-4str8           1/1     Running   0          29m
thanos-tls-querier-observee-query-dfb9f79f9-xsq24           1/1     Running   0          29m

kubectl -n monitoring get ingress
NAME                            CLASS    HOSTS                                            ADDRESS                                                                         PORTS     AGE
kube-prometheus-stack-grafana   <none>   grafana.thanos.teks-tg.clusterfrak-dynamics.io   k8s-ingressn-ingressn-afa0a48374-f507283b6cd101c5.elb.eu-west-1.amazonaws.com   80, 443   123m
Observed:
kubectl -n monitoring get pods
NAME                                                        READY   STATUS    RESTARTS   AGE
alertmanager-kube-prometheus-stack-alertmanager-0           2/2     Running   0          39m
kube-prometheus-stack-kube-state-metrics-5cf575d8f8-ct292   1/1     Running   0          39m
kube-prometheus-stack-operator-6856b9bb58-4cngc             1/1     Running   0          39m
kube-prometheus-stack-prometheus-node-exporter-bs4wp        1/1     Running   0          39m
kube-prometheus-stack-prometheus-node-exporter-c57ss        1/1     Running   0          39m
kube-prometheus-stack-prometheus-node-exporter-cp5ch        1/1     Running   0          39m
kube-prometheus-stack-prometheus-node-exporter-tnqvq        1/1     Running   0          39m
kube-prometheus-stack-prometheus-node-exporter-z2p49        1/1     Running   0          39m
kube-prometheus-stack-prometheus-node-exporter-zzqp7        1/1     Running   0          39m
prometheus-kube-prometheus-stack-prometheus-0               3/3     Running   1          39m
thanos-compactor-7576dcbcfc-6pd4v                           1/1     Running   0          38m

kubectl -n monitoring get ingress
NAME                                   CLASS   HOSTS                                                   ADDRESS                                                                         PORTS     AGE
kube-prometheus-stack-thanos-gateway   nginx   thanos-sidecar.thanos.teks-tg.clusterfrak-dynamics.io   k8s-ingressn-ingressn-95903f6102-d2ce9013ac068b9e.elb.eu-west-3.amazonaws.com   80, 443   40m
Our TLS query should be able to query the metrics of the observed cluster. Let's look at their behavior:
k -n monitoring logs -f thanos-tls-querier-observee-query-687dd88ff5-nzpdh

level=info ts=2021-02-23T15:37:35.692346206Z caller=storeset.go:387 component=storeset msg="adding new storeAPI to query storeset" address=thanos-sidecar.thanos.teks-tg.clusterfrak-dynamics.io:443 extLset="{cluster=\"pio-thanos-observee\", prometheus=\"monitoring/kube-prometheus-stack-prometheus\", prometheus_replica=\"prometheus-kube-prometheus-stack-prometheus-0\"}"
Therefore, this query pods can query my other clusters. If we check the Web, we can see the storage:
kubectl -n monitoring port-forward thanos-tls-querier-observee-query-687dd88ff5-nzpdh 10902
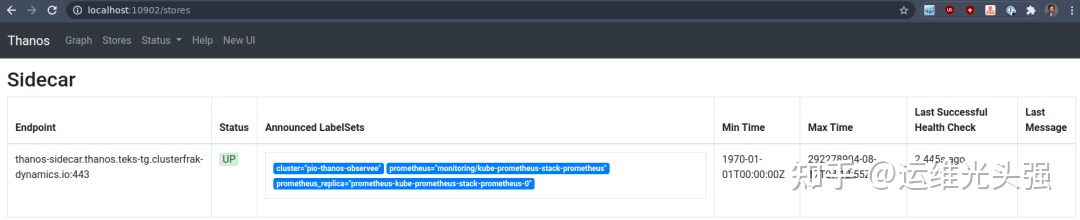
Great, but I only have one storage. Remember we said that queries can be stacked together? In our observer cluster, we have a standard http query that can query other components in the architecture diagram.
kubectl -n monitoring port-forward thanos-query-7c74db546c-d7bp8 10902
Here we can see that all storage has been added to our central query:
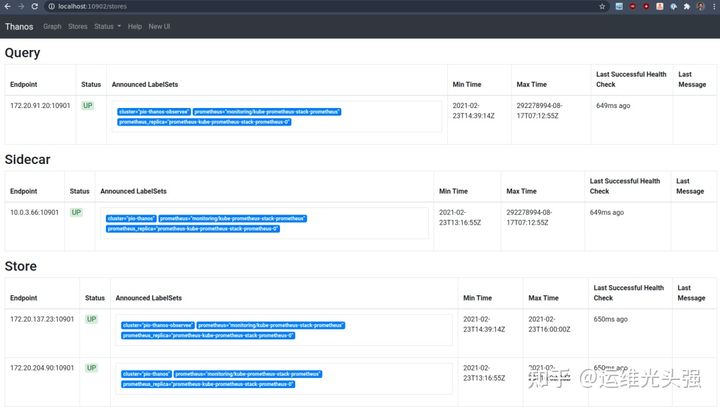
- The observer gathered the local Thanos
- Our storage gateway (one for remote observer cluster and one for local observer cluster)
- Local TLS query, which can query the observed sidecar
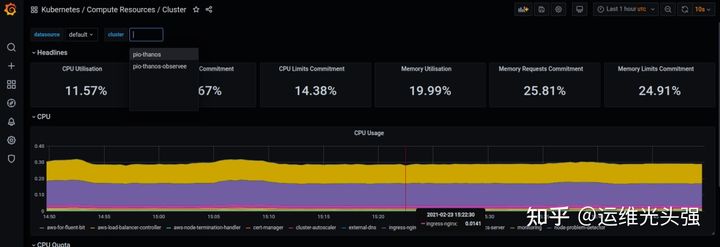
Visualization in Grafana
Finally, we can go to Grafana to see how the default Kubernetes dashboard is compatible with multiple clusters.
summary
Thanos is a very complex system with many mobile parts. We didn't study the specific custom configuration in depth because it will take too much time.
We provide a fairly complete AWS implementation in the tEKS repository, which abstracts a lot of complexity (mainly the mTLS part) and allows a lot of customization. You can also use the terrain kubernetes addons module as a stand-alone component. We plan to support other cloud providers in the future. Don't hesitate to contact us with questions about any project on Github.
Depending on your infrastructure and needs, there are many Thanos implementations that may be suitable for you.
If you want to study Thanos in depth, you can check their official Kube Thanos repository and their suggestions on cross cluster communication [5].
Of course, we are happy to help you set up your cloud native monitoring stack. Welcome to contact us contact@particule.io :)
You can also contact us through CNCF/Kubernetes Slack channel every day.
Original link: Multi-Cluster Monitoring with Thanos