PyQtGraph drawing data visualization (drawing) method of Python language
PyQtGraph plot
Data drawing scheme
The common data visualization (drawing) methods of Python language are Matplotlib and PyQtGraph
- Matplotlib
When it comes to data mapping in Python language, Matplotlib is certainly the most famous.
Advantages: complete functions, mature and stable, and huge community ecosystem.
Disadvantages: the performance of some drawing scenes is not high.
- PyQtGraph
PyQtGraph is a pure Python Library Based on Qt.
Advantages: the mapping performance of large amount of data is higher than that of Matplotlib, and the performance of dynamic updating graph is also higher than that of Matplotlib.
And it is perfectly integrated with Qt graphical interface framework, because its 2D drawing is developed based on Qt View Framework.
Disadvantages: there are not as many drawing functions as Matplotlib, and the development community is not as large as Matplotlib.
So, which solution should we use? My suggestion is:
If you have used Qt to develop graphical interface programs and the drawing function is supported by PyQtGraph, it is recommended to use PyQtGraph because it is seamlessly combined with Qt interface.
Otherwise, use Matplotlib.
This article first introduces the use example of PyQtGraph.
PyQtGraph installation
pip install pyqtgraph
Official documents and cases
PyQtGraph official documentation can Click here to view
It contains a lot of sample code. We just need to run the following code to view these demo s and the corresponding code
import pyqtgraph.examples
pyqtgraph.examples.run()
Graph example
The following is the most common example of drawing a curve according to the corresponding value of the x/y axis
from pyqtgraph.Qt import QtGui, QtCore
import pyqtgraph as pg

# Create a drawing window class PlotWindow object with a built-in drawing control class PlotWidget object
pw = pg.plot()

# Set chart title, color, font size
pw.setTitle("Temperature trend",color='008080',size='12pt')

# Change the background color to white
pw.setBackground('w')

# Show table lines
pw.showGrid(x=True, y=True)

# Set the upper, lower, left and right label s
# The first parameter can only be 'left', 'bottom', 'right', or 'top'
pw.setLabel("left", "air temperature(centigrade)")
pw.setLabel("bottom", "time")

# Set Y-axis scale range
pw.setYRange(min=-10,  # minimum value
             max=50)  # Maximum

# Create a PlotDataItem. The default is a graph
curve = pw.plot( pen=pg.mkPen('b')) # line color

hour = [1, 2, 3, 4, 5, 6, 7, 8, 9, 10]
temperature = [30, 32, 34, 32, 33, 31, 29, 32, 35, 45]

curve.setData(hour, # x coordinate
              temperature  # y coordinate
              )

QtGui.QApplication.instance().exec_()
Clear the drawing area and redraw
If you are drawing again with new data, you can call the clear method to clear the original content (plot item), as follows
# Clear the original plot content
pw.clear()

# Create a PlotDataItem. The default is a graph
curve = pw.plot( pen=pg.mkPen('b')) # line color
hour = [1, 2, 3, 4, 5, 6, 7, 8, 9, 10]
temperature = [130, 132, 134, 132, 133,131, 129, 132, 135, 145]

curve.setData(hour, # x coordinate
              temperature  # y coordinate
              )
PlotWidget and GraphicsLayoutWidget
There are two types of drawing control classes in PyQtGraph, PlotWidget and GraphicsLayoutWidget GraphicsView Subclass. GraphicsView is a subclass of Qt's QGraphicsView, based on which some functions have been improved.
Plotwidges can only have one built-in drawing object plottitem, while GraphicsLayoutWidget can have multiple built-in drawing objects. Usually we use the PlotWidget most
The built-in drawing object of the PlotWidget object PlotItem , which can be obtained through the getPlotItem() method.
For convenience, most plottitem methods can be called directly through the PlotWidget object. For example, setTitle, showGrid, setLabel, setYRange, plot, etc. in the above example code.
Calling the plot method will create a PlotDataItem. The default is a graph
For more details on the basic architecture of PyQtGraph drawing, Click here to view the official documents
Embedded in Qt program interface
In the above example, the chart is run and displayed in a separate program.
If we want to embed it into our Qt program interface, mainly through the PlotWidget or GraphicsLayoutWidget control class of pyqtgraph, the code is as follows
from PySide2 import QtWidgets
import pyqtgraph as pg

class MainWindow(QtWidgets.QWidget):

    def __init__(self):
        super().__init__()

        self.setWindowTitle('pyqtgraph Drawing example')

        # Create a PlotWidget object
        self.pw = pg.PlotWidget()

        # Set chart title
        self.pw.setTitle("Temperature trend",color='008080',size='12pt')

        # Set the upper, lower, left and right label s
        self.pw.setLabel("left","air temperature(centigrade)")
        self.pw.setLabel("bottom","time")
        # Change the background color to white
        self.pw.setBackground('w')


        hour = [1,2,3,4,5,6,7,8,9,10]
        temperature = [30,32,34,32,33,31,29,32,35,45]

        # hour and temperature are the values on the X and Y axes respectively
        self.pw.plot(hour,
                     temperature,
                     pen=pg.mkPen('b') # line color
                    )

        # Create additional Qt controls
        okButton = QtWidgets.QPushButton("OK")
        lineEdit = QtWidgets.QLineEdit('Click information')
        # edit and button are placed in the horizontal layout
        hbox = QtWidgets.QHBoxLayout()
        hbox.addWidget(lineEdit)
        hbox.addWidget(okButton)

        # The pyqtgraph chart control and the front horizontal layout are placed in the vertical layout
        vbox = QtWidgets.QVBoxLayout()
        vbox.addWidget(self.pw)
        vbox.addLayout(hbox)

        # Set global layout
        self.setLayout(vbox)

if __name__ == '__main__':
    app = QtWidgets.QApplication()
    main = MainWindow()
    main.show()
    app.exec_()
Histogram
pyqtgraph can produce such a histogram
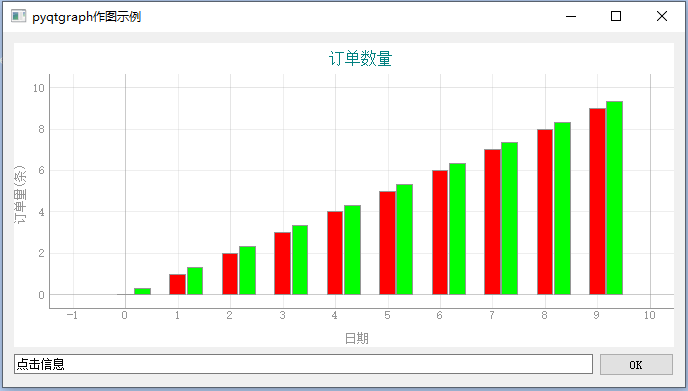
This section is only visible to internal students
Draw multiple drawings
You can use the GraphicsLayoutWidget to create multiple drawing pairs
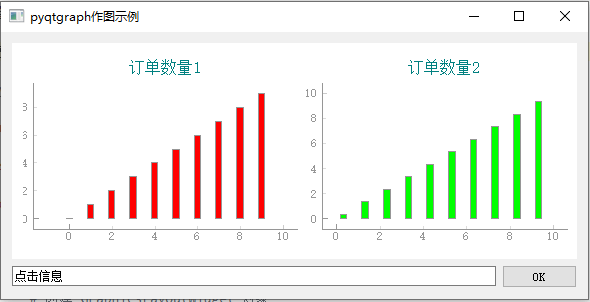
The corresponding codes are as follows
This section is only visible to internal students
Real time update graph
To draw a dynamic real-time update map, you only need to re plot the changed content.
The example code is as follows
from PySide2 import QtWidgets
from pyqtgraph.Qt import  QtCore
import pyqtgraph as pg
import sys
from random import randint

class MainWindow(QtWidgets.QMainWindow):

    def __init__(self):
        super().__init__()

        self.setWindowTitle('pyqtgraph Mapping')

        # Create a PlotWidget object
        self.pw = pg.PlotWidget()

        # Set chart title
        self.pw.setTitle("Temperature trend",
                         color='008080',
                         size='12pt')

        # Set the upper, lower, left and right label s
        self.pw.setLabel("left","air temperature(centigrade)")
        self.pw.setLabel("bottom","time")

        # Set Y-axis scale range
        self.pw.setYRange(min=-10, # minimum value
                          max=50)  # Maximum

        # Show table lines
        self.pw.showGrid(x=True, y=True)

        # Change the background color to white
        self.pw.setBackground('w')

        # Set Y-axis scale range
        self.pw.setYRange(min=-10, # minimum value
                          max=50)  # Maximum

        # Center the PlotWidget
        self.setCentralWidget(self.pw)

        # The real-time display should obtain the PlotDataItem object and call its setData method,
        # In this way, only the curve is re plot ted, and the performance is higher
        self.curve = self.pw.plot(
            pen=pg.mkPen('r', width=1)
        )

        self.i = 0
        self.x = [] # Value of x-axis
        self.y = [] # Value of y-axis

        # Start the timer and notify to refresh the data every 1 second
        self.timer = QtCore.QTimer()
        self.timer.timeout.connect(self.updateData)
        self.timer.start(1000)

    def updateData(self):
        self.i += 1
        self.x.append(self.i)
        # Create random temperature values
        self.y.append(randint(10,30))

        # plot data: x, y values
        self.curve.setData(self.x,self.y)

if __name__ == '__main__':
    app = QtWidgets.QApplication()
    main = MainWindow()
    main.show()
    app.exec_()
PyQtGraph graph can be embedded into the main window of Qt program as a Qt widget control.
We can add PyQtGraph graphic control as a third-party control in Qt Designer.
For example, as follows:
Adding third-party controls in Qt Designer
Through Qt Designer, we can design the position and size of controls on the interface in advance, and then load them dynamically.
However, Qt built-in controls are placed on the interface. How can third-party controls such as PlotWidget in PyQtGraph be placed in Qt Designer? How can our code get the object corresponding to the control?
Click here to learn the following while watching the video explanation
According to the above video, the generated interface ui file is in the following link zip file
http://cdn1.python3.vip/files/qt/stock-01.zip
If you use PySide2, the corresponding code is as follows. Pay attention to the function of registration on line 14
from PySide2.QtWidgets import QApplication
from PySide2.QtUiTools import QUiLoader
import pyqtgraph as pg

class Stock:

    def __init__(self):

        loader = QUiLoader()

        # pyside2 be sure to use registerCustomWidget
        # To register the third-party controls in the ui file, so that when loading
        # Only when the loader knows the class corresponding to the third-party control can the object be instantiated
        loader.registerCustomWidget(pg.PlotWidget)
        self.ui = loader.load("main.ui")

        hour = [1,2,3,4,5,6,7,8,9,10]
        temperature = [30,32,34,32,33,31,29,32,35,45]

        # Find the control designed by Qt designer through the control name historyPlot
        self.ui.historyPlot.plot(hour,temperature)

app = QApplication([])
stock = Stock()
stock.ui.show()
app.exec_()
If PyQt5 is used, it will be easier without registration. The corresponding code is as follows
from PyQt5.QtWidgets import QApplication
from PyQt5 import QtWidgets, uic

class Stock:

    def __init__(self):

        # PyQt5 loads ui files directly
        # Because the third-party control is defined by promote
        # You can already know the path of the module where the control class is located
        self.ui = uic.loadUi("main.ui")

        hour = [1,2,3,4,5,6,7,8,9,10]
        temperature = [30,32,34,32,33,31,29,32,35,45]
        self.ui.historyPlot.plot(hour, temperature)

app = QApplication([])
stock = Stock()
stock.ui.show()
app.exec_()
The axis scale is a string
When the above program runs, the scale of the X-axis is a number. What if we want the scale of the X-axis to be text?
We refer to the introduction of this website: python - Show string values on x-axis in pyqtgraph - Stack Overflow
To define the mapping list from number to string, refer to the following code
import pyqtgraph as pg

# Scale, note that it is a double-layer list
xTick = [[(0, 'a'), (1, 'b'), (2, 'c'), (3, 'd'), (4, 'e'), (5, 'f')]]
x = [0,1,2,3,4,5]
y = [1, 2, 3, 4, 5, 6]

win = pg.GraphicsWindow()
stringaxis = pg.AxisItem(orientation='bottom')
stringaxis.setTicks(xTick)
plot = win.addPlot(axisItems={'bottom': stringaxis})
curve = plot.plot(x,y)

pg.QtGui.QApplication.exec_()
If you use PlotWidget, to get the axis object, the reference code is as follows
# self.ui.historyPlot is the PlotWidget object
xax = self.ui.historyPlot.getAxis('bottom')
xax.setTicks(xTick)
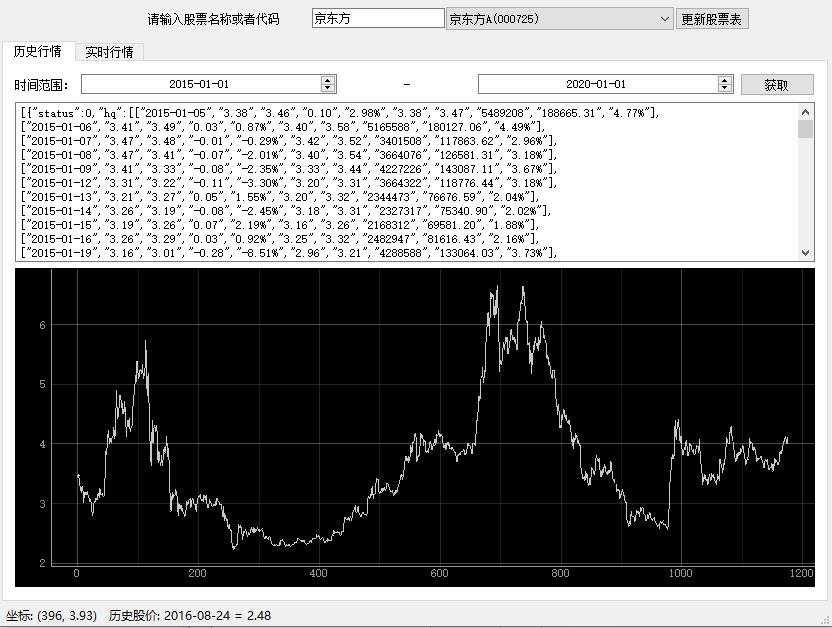
Gets the scale value where the mouse is located
Sometimes, our program needs to get the data corresponding to the mouse when the mouse moves on the pyqtgraph graph graph.
You can refer to the following code
import pyqtgraph as pg
import PySide2

x = [1,2,3,4,5]
y = [1,2,3,4,5]

win = pg.GraphicsWindow()
plot = win.addPlot()
curve = plot.plot(x,y)

def mouseover(pos):
    # The parameter pos is a pixel coordinate, which needs to be converted into a scale coordinate
    act_pos = curve.mapFromScene(pos)
    if type(act_pos) != PySide2.QtCore.QPointF:
        return
    print(act_pos.x(),act_pos.y())

    # With the scale coordinate value, you can process some information according to this value
    # For example, the status bar displays the date there

curve.scene().sigMouseMoved.connect(mouseover)

pg.QtGui.QApplication.exec_()