Introduction: a medical image recognition project was made in the third year of University. Doctors marked the focus points with red pen on the original image. By recording the red coordinate position, the external rectangle of the focus point can be obtained. However, the proportion of the area in the red circle under the external rectangle will be involved later. There are several red marks in some external rectangles. The fillPoly filling effect of opencv on the Internet is not the same Often not ideal, and there is similar python computing arbitrary polygon method is not ideal, their own exploration of a good effect of calculating the area of multi circle and irregular graphics algorithm.
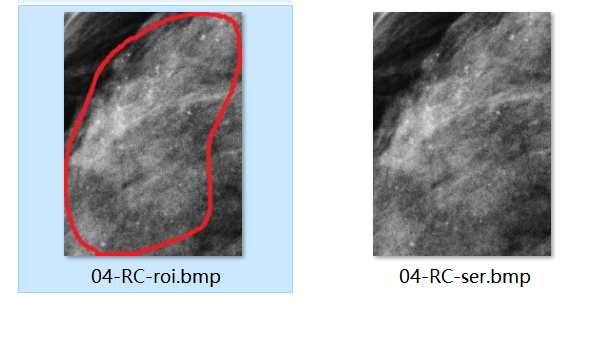
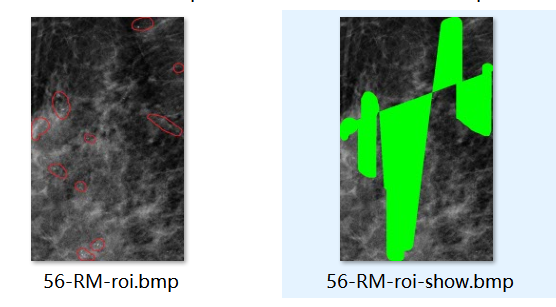
Most of them are like this
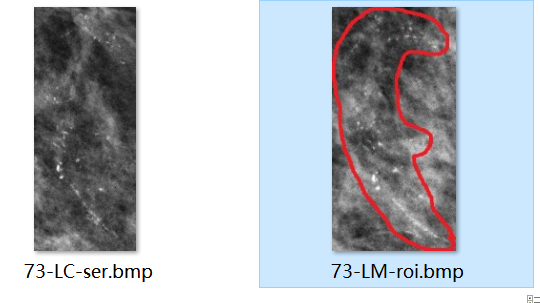
But there are also some laps
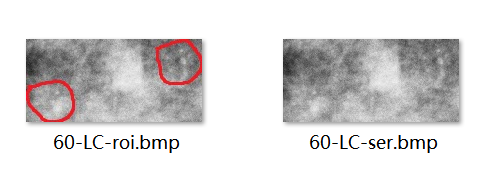

Obviously, these pictures need to calculate the proportion of area, and the samples need to be screened
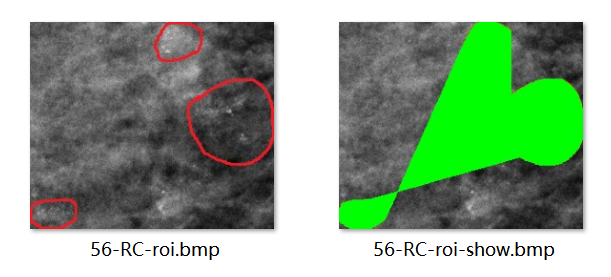
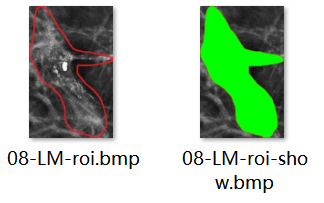
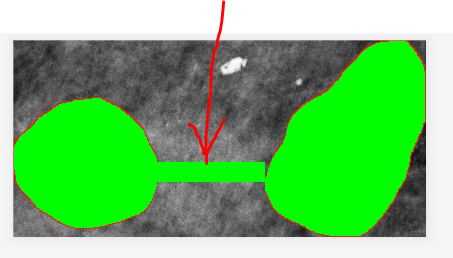
Through Baidu, using opencv to calculate the area, part of the effect is poor, single circle is not complete, and multiple circles are wrong (using the area calculation results to color, convenient for observation)

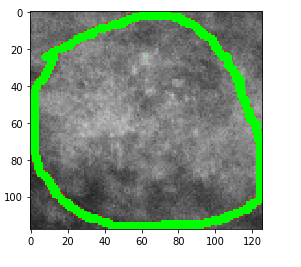
After using this algorithm, the accuracy of area calculation is improved a lot no matter in single circle or multi circle


The area of irregular figure can be calculated accurately
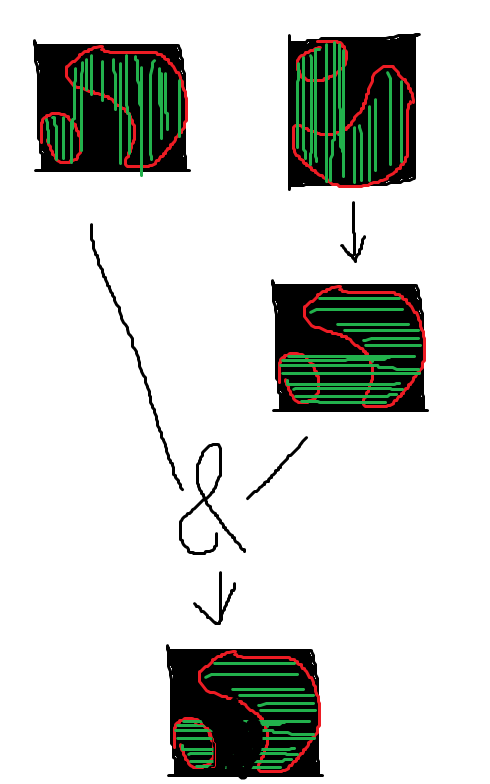
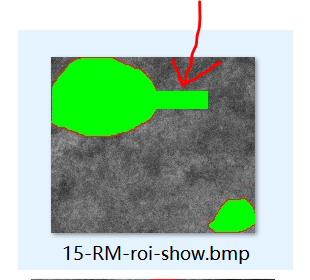
Body: the idea of the algorithm is very simple. It traverses every column of the picture, judges whether to encounter the marker circle through the color difference, records all the coordinates, records the smallest row and the largest row of the coordinates of each column, determines the smallest and the largest coordinates of each column, and then colors (similar to the implementation of fillPoly in opencv, but with some differences in details). However, this effect is not good, and the picture Rotate 90 degrees, and then do one side. Put the results of the two pictures together to do and operate. The results can deal with the problem of multi circle marking and multi calculation area (such as 08-LM above),
Algorithm implementation
Only the pilot library is used in the whole process
First, get the rgb value of the target color with the screen color picker. In my case, it is (237, 28, 36). It is also necessary to intercept the external rectangle in the early stage, and the color is the same
1 def pixel_wanted(pix):
2     return pix==(237,28, 36)
Each column sets the flip bit to False initially. If the previous pixel is not the target color, and the current is the target color, the recording starts. Once it is not the target color, the detection stops
The top pixel is set to black (0, 0, 0), because the top part of a picture is the target color, which leads to the problem of judgment, and directly causes the initialization of the top pixel to be black
Coordinate list records all the corresponding point coordinates
 1 coordinate_List = []
 2 top_Pixel = (0,0,0)
 3 for x in range(im.size[0]):
 4     flag = False #Initialize each column to flip to False
 5     for y in range(im.size[1]):
 6         current_pixel = im.getpixel((x,y))
 7         last_pixel = im.getpixel((x,y-1)) if y>0 else top_Pixel
 8         #Reversal decision
 9         if pixel_wanted(current_pixel) and \
10                 not pixel_wanted(last_pixel):
11             flag = True
12         if flag and not pixel_wanted(current_pixel):
13             flag = False
14         if(flag):
15             coordinate_List.append((x,y))
The points in the coordinate list are as follows
And then we will get the coordinate list above for processing
Record the minimum and maximum coordinates of each column in the coordinate list
Because the number of records in each column is uncertain (it should be improved in the previous step), it needs to be traversed many times
First, find the coordinates of the first column and record its row information (row information is determined to be the minimum),
Then traverse all the coordinates of the same column and compare the row coordinates. If the larger one, replace the largest one (determine the row information maximum), and record the data with a new list
 1 coordinate_Min_Max_List = []
 2 #Find the minimum and maximum
 3 for i in range(im.size[0]):
 4     min=-1
 5     max=-1
 6     for coordinate in coordinate_List:
 7         if coordinate[0] == i:
 8             min = coordinate[1]
 9             max = coordinate[1]
10             break
11     for coordinate in coordinate_List:
12         if coordinate[0] == i:
13             if coordinate[1]>max:
14                 max = coordinate[1]
15     coordinate_Min_Max_List.append(min)
16     coordinate_Min_Max_List.append(max)
Where, min and max should be initialized to a value where the coordinate does not exist, such as - 1. In order to avoid the shadow phenomenon in the case of multiple circles and gaps in the next step, see the following figure
At the end of the previous step, we get a list. The minimum row and the maximum row of column n are the 2n and 2n+1 elements, respectively. The - 1 in the result will not be drawn in the next step
Then you draw the picture, and each column fills the smallest row to the largest row in the list
 1 #Coloring
 2 for x in range(im.size[0]):
 3     for y in range(im.size[1]):
 4         min = coordinate_Min_Max_List[x*2]
 5         max = coordinate_Min_Max_List[x*2+1]
 6         if min<y<max:
 7             im.putpixel((x,y),(0,255,0))
 8         else:
 9             #It can cover the upper mask of non red circle
10             pass
So far, it's the algorithm implementation similar to OpenCV. Although it's not ready to flip and operate, it's better than opencv's generation effect. It's written as function subsequent calls,
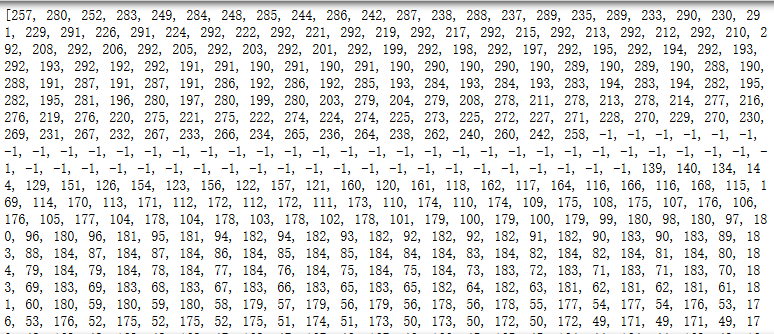
Then simply flip 90 degrees, call this function again, and do it again
 1 def Cal_S(im):
 2     im_0 = im.rotate(0)
 3     im_90 = im.rotate(90, expand=True)
 4
 5     im_0 = fillPoly(im_0)
 6     im_90 = fillPoly(im_90)
 7     im_90 = im_90.rotate(-90, expand=True)
 8
 9     i=0
10     for x in range(im.size[0]):
11         for y in range(im.size[1]):
12             if(im_0.getpixel((x,y))==(0,255,0) and
13             im_90.getpixel((x,y))==(0,255,0)):
14                 im.putpixel((x,y),(0,255,0))
15                 i+=1
16     return i/(im.size[0]*im.size[1])
Make an effect drawing twice

You can see that the effect is very good, but there are still some problems with some images, such as the cross distribution,
But now, the error has been greatly reduced. These extremely individual cross phenomena can be manually cut into the original picture, or they can not be dealt with at all

All the codes and green pictures can be drawn for convenient and intuitive viewing. In the function, you can save the pictures by the way and see the overall effect
 1 from PIL import Image
 2
 3 def pixel_wanted(pix):
 4     return pix==(237,28, 36)
 5
 6 def fillPoly(im):
 7     coordinate_List = []
 8
 9     top_Pixel = (0,0,0)
10     for x in range(im.size[0]):
11         flag = False #Initialize each column to flip to False
12         for y in range(im.size[1]):
13             current_pixel = im.getpixel((x,y))
14             last_pixel = im.getpixel((x,y-1)) if y>0 else top_Pixel
15             #Reversal decision
16             if pixel_wanted(current_pixel) and \
17                     not pixel_wanted(last_pixel):
18                 flag = True
19             if flag and not pixel_wanted(current_pixel):
20                 flag = False
21             if(flag):
22                 coordinate_List.append((x,y))
23     coordinate_Min_Max_List = []
24     #Find the minimum and maximum
25     for i in range(im.size[0]):
26         min=-1
27         max=-1
28         for coordinate in coordinate_List:
29             if coordinate[0] == i:
30                 min = coordinate[1]
31                 max = coordinate[1]
32                 break
33         for coordinate in coordinate_List:
34             if coordinate[0] == i:
35                 if coordinate[1]>max:
36                     max = coordinate[1]
37         coordinate_Min_Max_List.append(min)
38         coordinate_Min_Max_List.append(max)
39     #Coloring
40     for x in range(im.size[0]):
41         for y in range(im.size[1]):
42             min = coordinate_Min_Max_List[x*2]
43             max = coordinate_Min_Max_List[x*2+1]
44             if min<y<max:
45                 im.putpixel((x,y),(0,255,0))
46             else:
47                 #It can cover the upper mask of non red circle
48                 pass
49     return im
50
51 def Cal_S(im):
52     im_0 = im.rotate(0)
53     im_90 = im.rotate(90, expand=True)
54
55     im_0 = fillPoly(im_0)
56     im_90 = fillPoly(im_90)
57     im_90 = im_90.rotate(-90, expand=True)
58
59     i=0
60     for x in range(im.size[0]):
61         for y in range(im.size[1]):
62             if(im_0.getpixel((x,y))==(0,255,0) and
63             im_90.getpixel((x,y))==(0,255,0)):
64                 im.putpixel((x,y),(0,255,0))
65                 i+=1
66     return i/(im.size[0]*im.size[1])