Serial port class
Two ttl modules are used on win computer
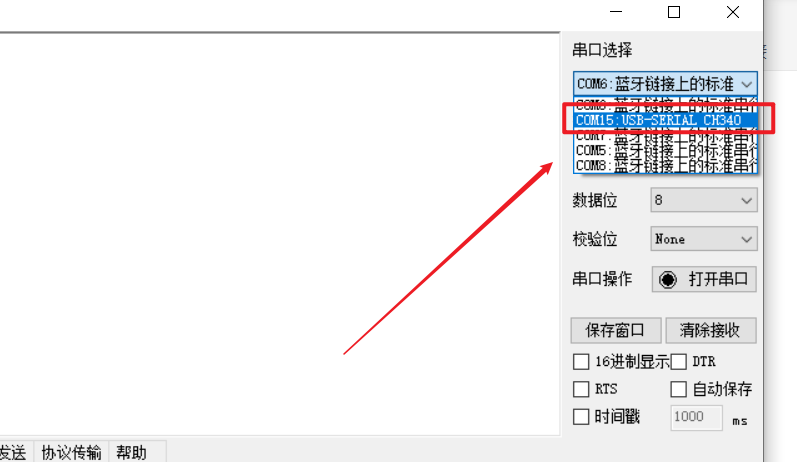
You can see the information of another serial port when inserting. The other serial port I see here is COM11
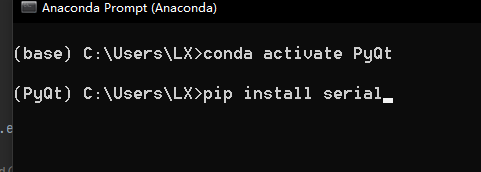
You need to install the serial port tool in advance. Here I choose the conda environment, so I just switch to the virtual environment, and then install pip
Let's start with a paragraph and print one character a second
import serial
import time

serial = serial.Serial('COM11', 115200)
print(serial)
if serial.isOpen():
   print("open success")
else:
    print("open failed")

try:
    while True:
        serial.write('hello serial\r\n'.encode('utf-8'))
        time.sleep(1)

except KeyboardInterrupt:
    if serial != None:
        serial.close()
The operation results are as follows
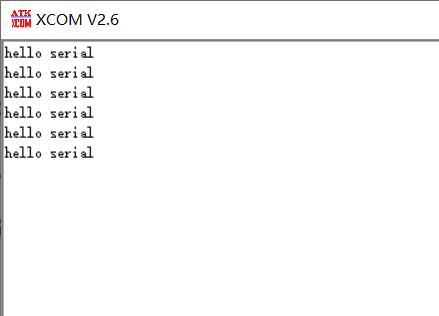
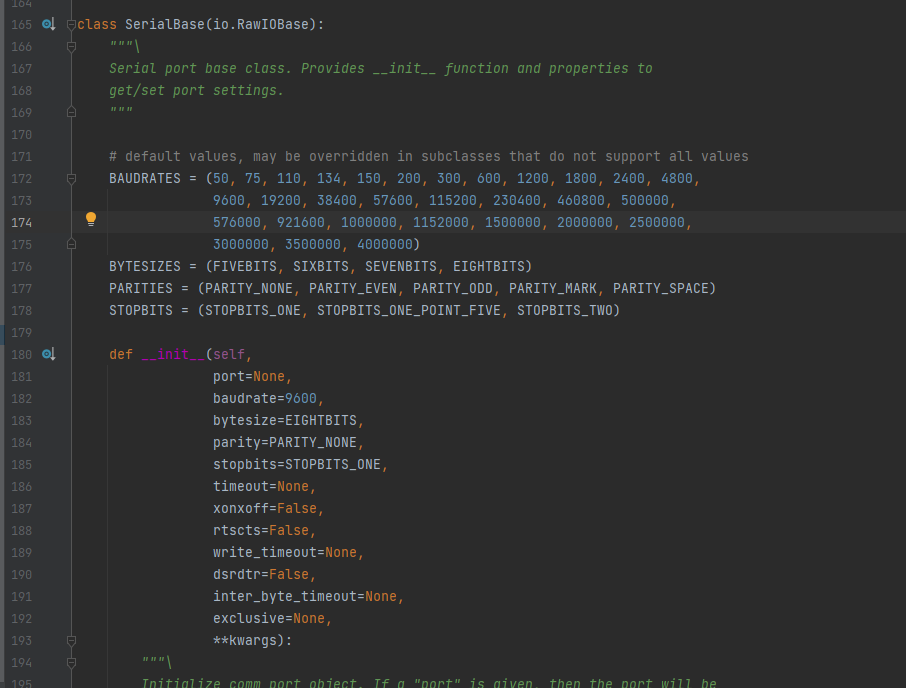
By analyzing the above code, we can see that to use the serial port, first define a serial port object and set the baud rate and serial port number. Of course, other parameters are default, which can be set or directly default, or you can directly look at the source code
Then note that the pyserial document indicates that the input parameter of write must be in bytes format
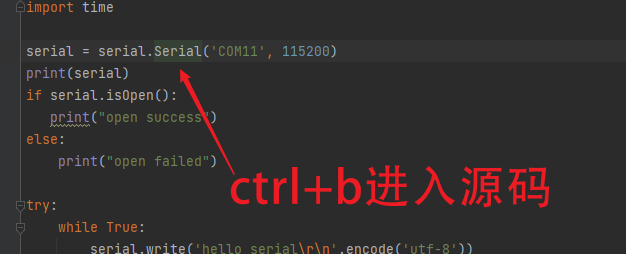
You can see that you finally enter this page
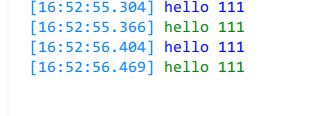
 You can also see the printed information directly
Next, test the send variable
serial.write(1)
Send 1 directly here

It always returns 00. (it was mentioned earlier that only binary data can be sent). So let's turn the character first
Modify the contents of the loop and don't forget to define the variables earlier
        serial.write((str(a)+'\r\n').encode('utf-8'))
        time.sleep(1)
a+=1 
In this way, we can send variables, and then we can turn them into characters at the other end
Let's try to use raspberry pie. Raspberry pie has a usb head and serial peripherals. All can be transmitted through serial port in two ways. Let's try to use these peripherals one by one
First, do you want to turn on this peripheral or the system settings? I won't repeat here. It's the same place as vnc

Raspberry pie pin diagram:
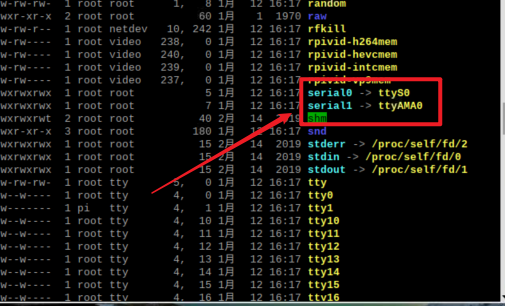
 View device, enter
ls -l /dev
See that there is a serial port. Here we use the obvious one in the above figure
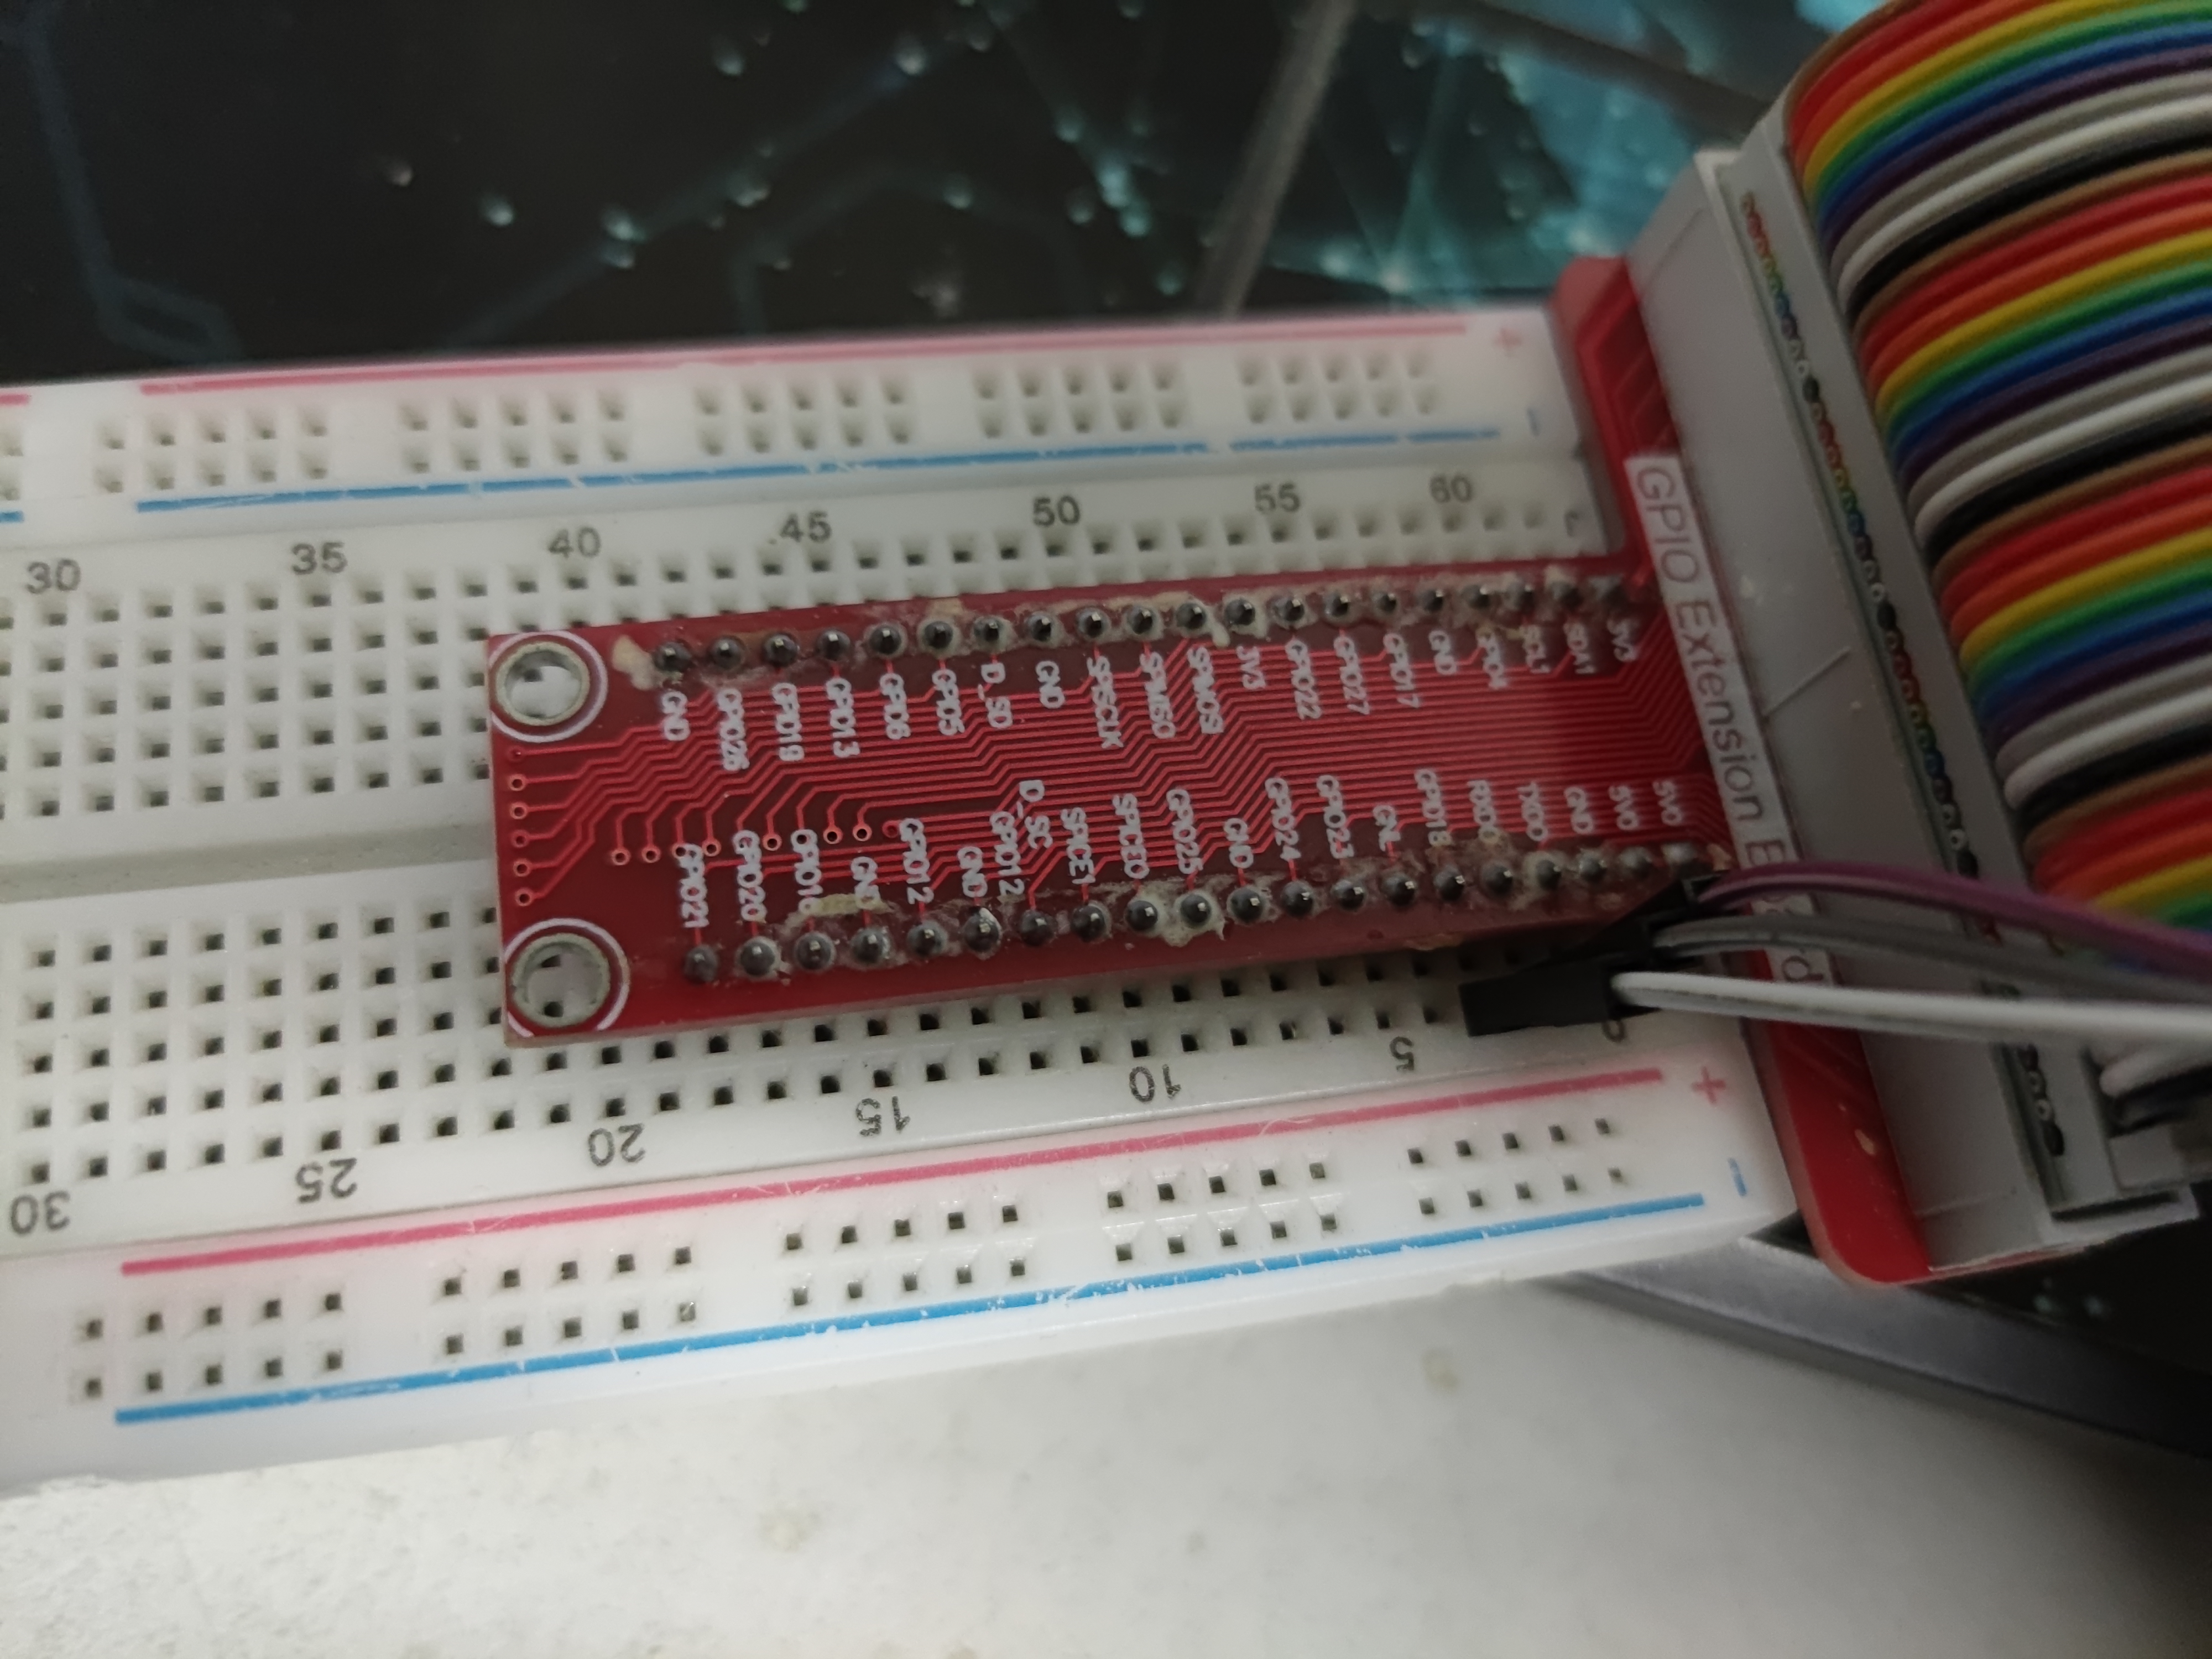
Then I used the extension cable to connect the cable, as shown below. The other end is connected to the usb device of the computer
Using the pyserial library, install
sudo apt-get install python-serial
Writing python code
import serial
import time
ser = serial.Serial("/dev/ttyS0", 9600)
def main():
    while True:
        cnt = ser.inWaiting()
        if cnt != 0:
            recv = ser.read(cnt)
            ser.write(recv)
        ser.flushInput()
        time.sleep(0.1)

if __name__ == '__main__':
    main()
Connect locally to your computer
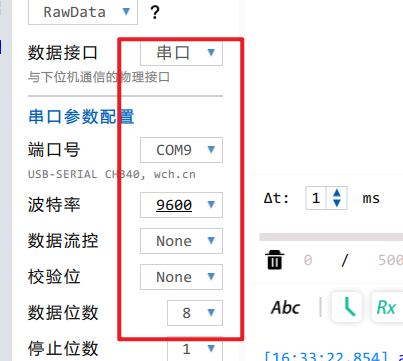
Input test. Here is an echo function written. It looks ok. This library is the same as the computer

The following tests how to use USB
Enter the command to view the USB device information, and then insert USB to view the USB information. The results are as follows:
lsusb

Enter the command to view the new serial port information
ls -l /dev/tty*

It's the same later. Just use the above code and change the next mouth
import serial
import time
ser = serial.Serial("/dev/ttyUSB0", 9600)
def main():
    while True:
        cnt = ser.inWaiting()
        if cnt != 0:
            recv = ser.read(cnt)
            ser.write(recv)
        ser.flushInput()
        time.sleep(0.1)

if __name__ == '__main__':
    main()
Everything is OK
Read file class
txt
The general requirements are as follows. The trajectory coordinate data of a moving object is recorded. Now we want to visually express it. The data examples are as follows
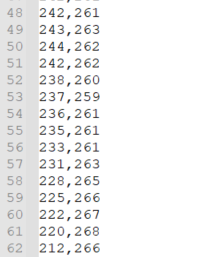
It can be seen that it is necessary to read the file and then split the string. The code is as follows. Here I have established two empty lists to store the required data. After traversing each line, first remove the newline character, and then use to separate it. Take the first one and add it to x one by one, and then take the second one and add it to y one by one. Be sure to close the file here
f = open("test.txt",'r')
x = []
y = []
for line in f:
    # print(line.split(',')[0])
    line= line.strip('\n')
    x.append(int(line.split(',')[0]))
    y.append(int(line.split(',')[1]))
f.close()
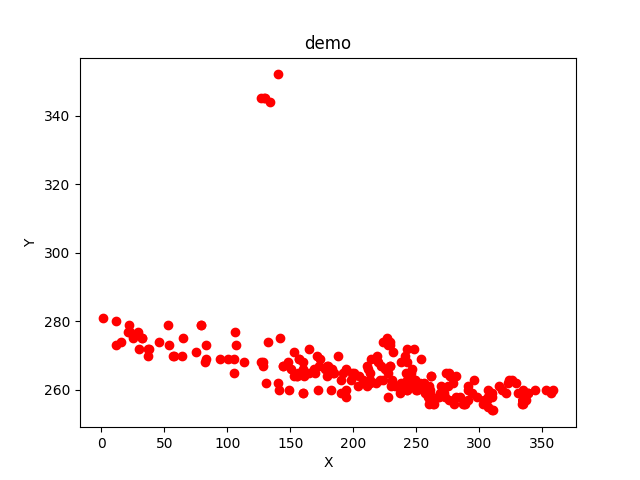
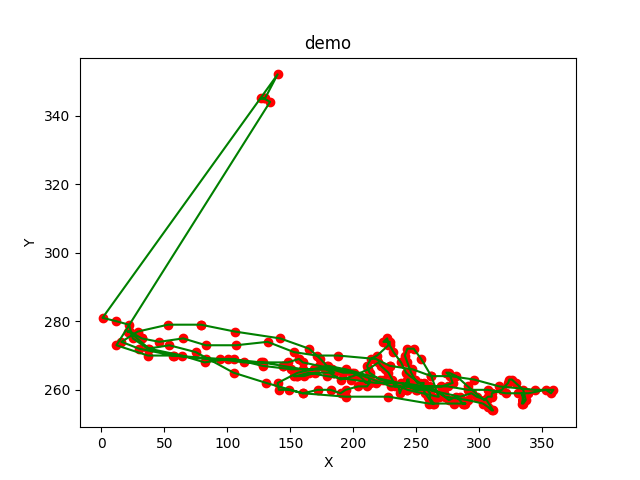
Then use the drawing function to draw the scatter diagram first, and then the connection diagram
plt.scatter(x,y,color="red")
plt.title("demo")
plt.xlabel("X")
plt.ylabel("Y")

plt.plot(x,y,color = "green")
plt.show()
As shown below
excle
To save the above data into excle, you first need a library. Be careful not to install the latest version. The latest version does not support xlsx files. It will report an error. I can use this version

Then there is the Reading Library below, which I have installed here

The following is the code part
import xlwt


f = open("test.txt",'r')
x = []
y = []
for line in f:
    # print(line.split(',')[0])
    line= line.strip('\n')
    x.append(int(line.split(',')[0]))
    y.append(int(line.split(',')[1]))
f.close()

workbook = xlwt.Workbook(encoding='utf-8')
ws = workbook.add_sheet("sheet1")

for i in range(len(x)):
    ws.write(i, 0, x[i])
for j in range(len(y)):
    ws.write(j, 1, y[j])
workbook.save('data.csv')
The results are as follows
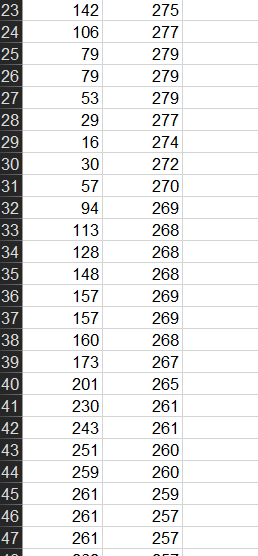
Basically no problem. It should be noted here that if the data length is too long, an error will be reported. He can only traverse 256 cells at a time
The error message is
column index (256) not an int in range(256)
The source code is here
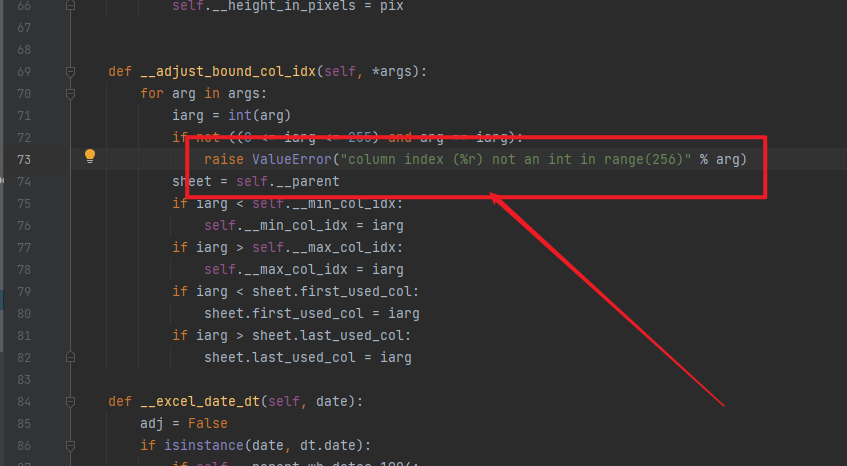 Here, we either execute it every 256 or save it in csv format, which is no problem. I use csv here. See the code for details!