With the development of economy and the progress of science and technology, the car has become a necessary means of transportation for every family. In addition, the prerequisite for marriage is to have a car and a house, which virtually aggravates the pressure of male compatriots. At this time, we need a car urgently. The second-hand car market has been very hot in recent years, increasing the ways for male compatriots to buy cars, Therefore, bloggers provide corresponding opinions for the majority of male compatriots through detailed visual analysis of second-hand cars in Jiangsu Province
1, Reptile part
Reptile Description:
1. The crawler is based on object-oriented code architecture
2. The data crawled by this crawler is stored in MongoDB database (the converted. xlsx file is provided)
3. There are detailed comments in the crawler code
4. The data crawled by crawlers take used cars in Jiangsu Province as an example
Code display
import re
from pymongo import MongoClient
import requests
from lxml import html

class CarHomeSpider(object):
    def __init__(self):
        self.start_url = 'http://www.che168.com/jiangsu/list/'
        self.headers = {
            'User-Agent': 'Mozilla/5.0 (Windows NT 10.0; WOW64) AppleWebKit/537.36 (KHTML, like Gecko) Chrome/89.0.4389.82 Safari/537.36'
        }
        self.url_temp = 'http://www.che168.com/jiangsu/{}/a0_0msdgscncgpi1ltocsp{}exx0/?pvareaid=102179#currengpostion'
        self.client = MongoClient()
        self.collection = self.client['test']['car_home']

    def get_url_list(self,sign,total_count):
        url_list = [self.url_temp.format(sign,i) for i in range(1,int(total_count)+1)]
        return url_list

    def parse(self,url):
        resp = requests.get(url,headers=self.headers)
        return resp.text

    def get_content_list(self,raw_html):
        resp_html = html.etree.HTML(raw_html)
        car_list = resp_html.xpath('//ul[@class="viewlist_ul"]/li')
        for car in car_list:
            item = {}
            # Get the title information of the car
            card_name = car.xpath('.//h4[@class="card-name"]/text()')
            card_name = card_name[0] if len(card_name)>0 else ''
            car_series = re.findall(r'(.*?) \d{4}paragraph',card_name)
            item['car_series'] = car_series[0].replace(' ','') if len(car_series)>0 else ''
            car_time_style = re.findall(r'.*? (\d{4})paragraph',card_name)
            item['car_time_style'] = car_time_style[0] if len(car_time_style)>0 else ''
            car_detail = re.findall(r'\d{4}paragraph (.*)',card_name)
            item['car_detail'] = car_detail[0].replace(' ','') if len(car_detail)>0 else ''

            # Get car details
            card_unit = car.xpath('.//p[@class="cards-unit"]/text()')
            card_unit = card_unit[0].split('/') if len(card_unit)>0 else ''
            item['car_run'] = card_unit[0]
            item['car_push'] = card_unit[1]
            item['car_place'] = card_unit[2]
            item['car_rank'] = card_unit[3]

            # Get the price of the car
            car_price = car.xpath('./@price')
            item['car_price'] = car_price[0] if len(car_price)>0 else ''
            print(item)
            self.save(item)

    def save(self,item):
        self.collection.insert(item)

    def run(self):
        # First, request the home page to obtain page classification data
        rest = self.parse(self.start_url)
        rest_html = html.etree.HTML(rest)
        # Here is the classification form according to the price, for example: below 30000, 30000-50000-80000, 80000-100000, 100000-150000, 150000-200000, 200000-300000, 300000-500000, and above 500000
        price_area_list = rest_html.xpath('//div[contains(@class,"condition-price")]//div[contains(@class,"screening-base")]/a')
        if price_area_list:
            for price_area in price_area_list:
                price_area_text = price_area.xpath('./text()')[0]
                price_area_link = 'http://www.che168.com'+price_area.xpath('./@href')[0]
                # Get the url of each category and make a request to get the total number of pages under each category
                rest_ = self.parse(price_area_link)
                rest_html_ = html.etree.HTML(rest_)
                total_count = rest_html_.xpath('//div[@id="listpagination"]/a[last()-1]/text()')[0]
                # Get the unique identification of each classification url
                sign = re.findall(r'jiangsu/(.*?)/#pvareaid',price_area_link)[0]
                # Generate the url addresses of all pages under each category
                url_list = self.get_url_list(sign,total_count)
                for url in url_list:
                    raw_html = self.parse(url)
                    self.get_content_list(raw_html)

if __name__ == '__main__':
    car_home = CarHomeSpider()
    car_home.run()
2, Data analysis and data visualization
Description of data analysis and data visualization:
1. This blog carries out data analysis and data visualization through the flash framework
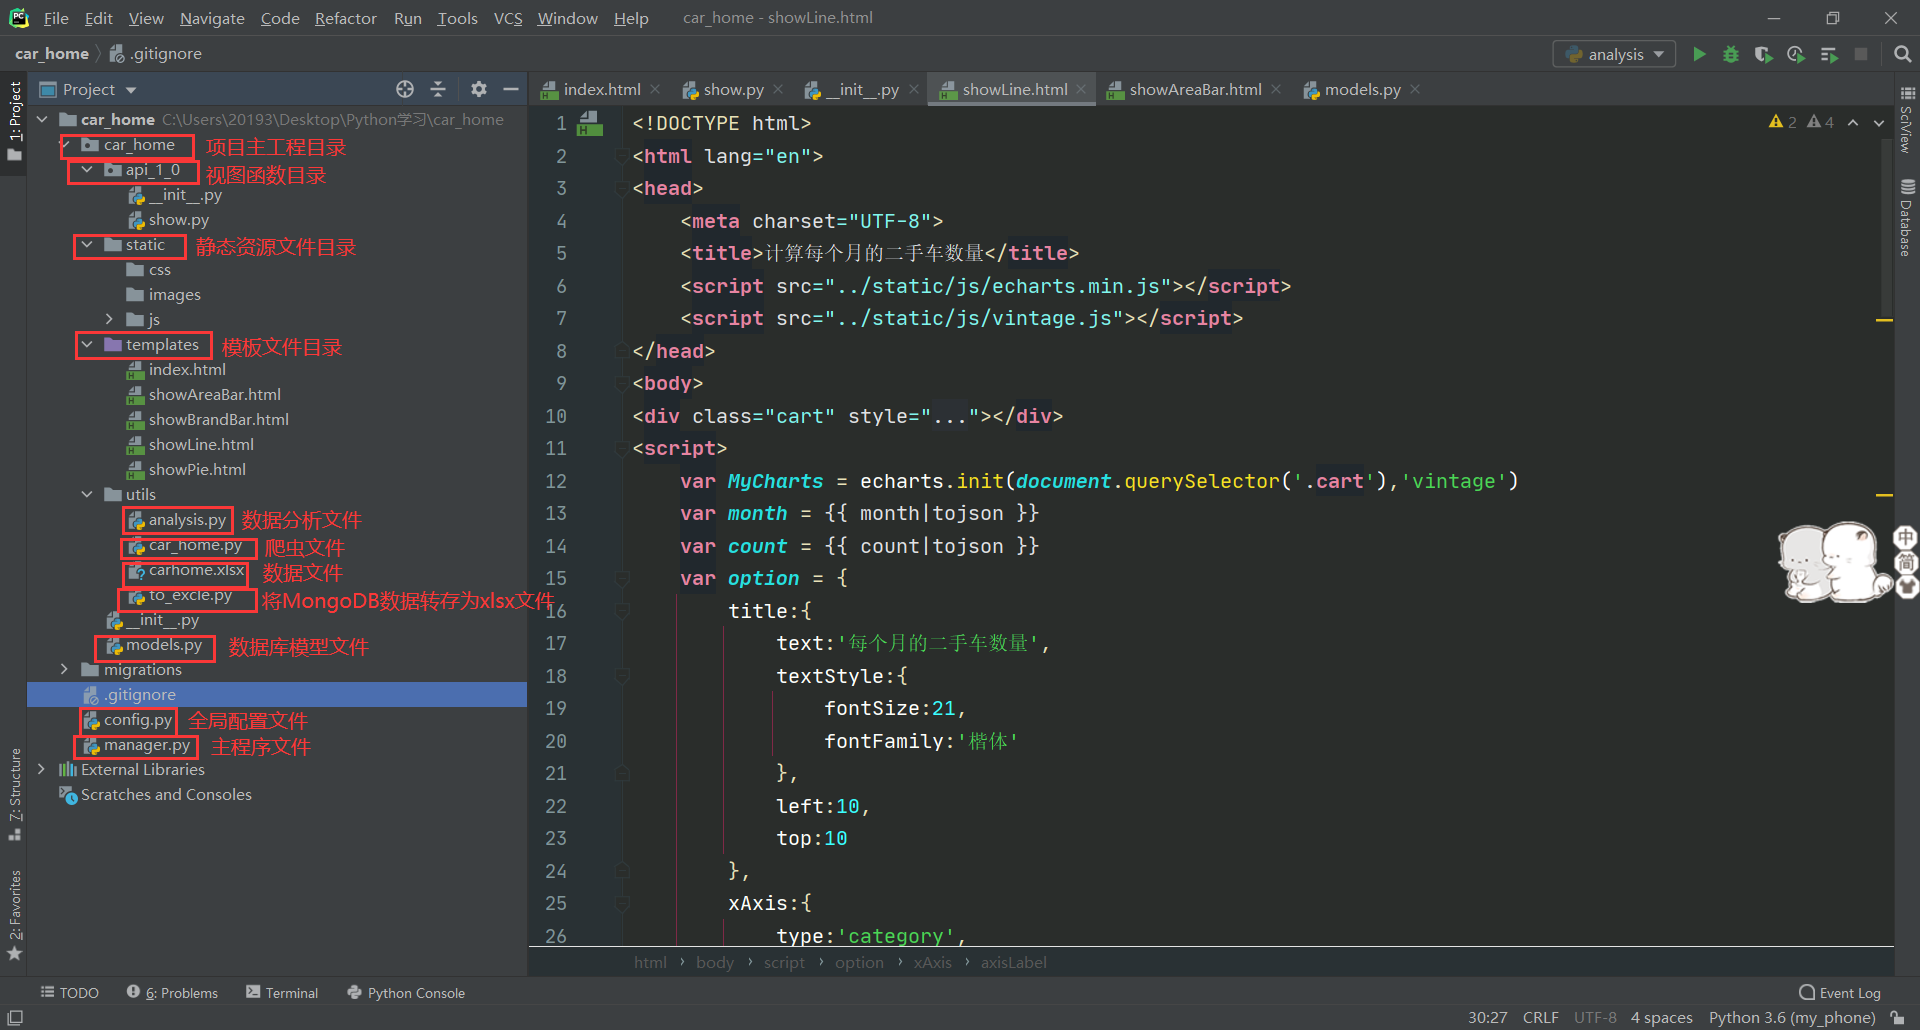
2. The architecture diagram of the project is
Code display
- Data analysis code display (analysis.py)
import re

from pymongo import MongoClient
import pandas as pd
import numpy as np
import pymysql

def pre_process(df):
    """
    Data preprocessing function
    :param df: dataFrame
    :return: df
    """

    # Remove the driving distance unit in 10000 kilometers from the data to facilitate subsequent calculation, such as 12000 kilometers
    df['car_run'] = df['car_run'].apply(lambda x:x.split('Ten thousand kilometers'))

    # Add data to car_ There are unlicensed data deleted in the push field
    df['car_push'] = df['car_push'].apply(lambda x:x if not x=="Unlicensed" else np.nan)

    # Delete data with NAN in the field
    df.dropna(inplace=True)

    return df


def car_brand_count_top10(df):
    """
    Calculate the top ten in the number of different brands
    :param df: dataFrame
    :return: df
    """
    # Classify according to the brand of the car
    grouped = df.groupby('car_series')['car_run'].count().reset_index().sort_values(by="car_run",ascending=False)[:10]
    data = [[i['car_series'],i['car_run']] for i in grouped.to_dict(orient="records")]
    print(data)
    return data

def car_use_year_count(df):
    """
    Calculate the service time of used cars
    :param df: dataFrame
    :return: df
    """
    # Deal with the sale time of the car
    date = pd.to_datetime(df['car_push'])
    date_value = pd.DatetimeIndex(date)
    df['car_push_year'] = date_value.year
    # Convert data type to int
    df['car_time_style'] = df['car_time_style'].astype(np.int)
    df['car_push_year'] = df['car_push_year'].astype(np.int)
    df['cae_use_year'] = df['car_push_year']-df['car_time_style']
    # Classify the service life of the vehicle
    grouped = df.groupby('cae_use_year')['car_series'].count().reset_index()
    # Delete the fields with negative service life and group them according to the service life into < one year, one year ~ three years > three years
    grouped = grouped.query('cae_use_year>=0')
    grouped.loc[:,'cae_use_year'] = grouped.loc[:,'cae_use_year'].apply(lambda x:"<a year" if x==0 else x )
    grouped.loc[:,'cae_use_year'] = grouped.loc[:,'cae_use_year'].apply(lambda x:"a year~three years" if not x =='<a year' and x>0 and x<3 else x )
    grouped.loc[:,'cae_use_year'] = grouped.loc[:,'cae_use_year'].apply(lambda x:">three years" if not x =='<a year' and not x=="a year~three years" and x>=3 else x )
    # Then they are grouped according to different service life
    grouped_use_year = grouped.groupby('cae_use_year')['car_series'].sum().reset_index()
    data = [[i['cae_use_year'],i['car_series']] for i in grouped_use_year.to_dict(orient="records")]
    print(data)
    return data

def car_place_count(df):
    """
    Number of used cars in different regions
    :param df: dataFrame
    :return: df
    """
    grouped =  df.groupby('car_place')['car_series'].count().reset_index()
    data = [[i['car_place'],i['car_series']] for i in grouped.to_dict(orient="records")]
    print(data)
    return data

def car_month_count(df):
    """
    Calculate the number of used cars per month
    :param df: dataFrame
    :return: df
    """
    # Deal with the sale time of the car
    date = pd.to_datetime(df['car_push'])
    date_value = pd.DatetimeIndex(date)
    month = date_value.month
    df['car_push_month'] = month

    # Group the months of car sale
    grouped = df.groupby('car_push_month')['car_series'].count().reset_index()
    data = [[i['car_push_month'],i['car_series']] for i in grouped.to_dict(orient="records")]
    print(data)
    return data

def save(cursor,sql,data):
    result = cursor.executemany(sql,data)
    if result:
        print('Insert successful')

if __name__ == '__main__':
    # 1 get data from MongoDB
    # Initialize MongoDB data connection
    # client = MongoClient()
    # collections = client['test']['car_home']
    # Get MongoDB data
    # cars = collections.find({},{'_id':0})

    # 2. Read xlsx file data (the data in MongoDB has been converted to xlsx format)
    cars = pd.read_excel('./carhome.xlsx',engine='openpyxl')

    # Convert data to dataFrame type
    df = pd.DataFrame(cars)
    print(df.info())
    print(df.head())

    # Preprocess data
    df = pre_process(df)

    # Calculate the top ten in the number of different brands
    data1 = car_brand_count_top10(df)

    # Calculate the service time of used cars
    data2 = car_use_year_count(df)

    # Calculate the number of used cars in different regions
    data3 = car_place_count(df)

    # Calculate the number of used cars per month
    data4 = car_month_count(df)

    # Create mysql connection
    conn = pymysql.connect(user='root',password='123456',host='localhost',port=3306,database='car_home',charset='utf8')
    try:
        with conn.cursor() as cursor:
            # Calculate the top ten in the number of different brands
            sql1 = 'insert into db_car_brand_top10(brand,count) values(%s,%s)'
            save(cursor,sql1,data1)

            # Calculate the service time of used cars
            sql2 = 'insert into db_car_area(area,count) values(%s,%s)'
            save(cursor,sql2,data2)

            # Calculate the number of used cars in different regions
            sql3 = 'insert into db_car_use_year(year_area,count) values(%s,%s)'
            save(cursor, sql3, data3)

            # Calculate the number of used cars per month
            sql4 = 'insert into db_car_month(month,count) values(%s,%s)'
            save(cursor,sql4,data4)

            conn.commit()
    except pymysql.MySQLError as error:
        print(error)
        conn.rollback()
- Data conversion file MongoDB to xlsx (to_excle.py)
import pandas as pd
import numpy as np
from pymongo import MongoClient

def export_excel(export):
    # Convert dictionary list to DataFrame
    df = pd.DataFrame(list(export))
    # Specifies the name of the generated Excel table
    file_path = pd.ExcelWriter('carhome.xlsx')
    # Replace empty cells
    df.fillna(np.nan, inplace=True)
    # output
    df.to_excel(file_path, encoding='utf-8', index=False)
    # Save form
    file_path.save()


if __name__ == '__main__':
    # Convert MongoDB data to xlsx file
    client = MongoClient()
    connection = client['test']['car_home']
    ret = connection.find({}, {'_id': 0})
    data_list = list(ret)
    export_excel(data_list)
- Database model file display (models.py)
from . import db


class BaseModel(object):
    id = db.Column(db.Integer, autoincrement=True, primary_key=True)
    count = db.Column(db.Integer)

# Calculate the top ten in the number of different brands
class CarBrandTop10(BaseModel,db.Model):
    __tablename__ = 'db_car_brand_top10'
    brand = db.Column(db.String(32))

# Calculate the service time of used cars
class CarUseYear(BaseModel,db.Model):
    __tablename__ = 'db_car_use_year'
    year_area = db.Column(db.String(32))

# Calculate the number of used cars in different regions
class CarArea(BaseModel,db.Model):
    __tablename__='db_car_area'
    area = db.Column(db.String(32))

# Number of used cars per month
class CarMonth(BaseModel,db.Model):
    __tablename__='db_car_month'
    month = db.Column(db.Integer)
- Configuration file code display (config.py)
# Basic configuration
class Config(object):
    SECRET_KEY = 'msqaidyq1314'
    SQLALCHEMY_DATABASE_URI = "mysql://root:123456@localhost:3306/car_home"
    SQLALCHEMY_TRACK_MODIFICATIONS = True


class DevelopmentConfig(Config):
    DEBUG = True

class ProductConfig(Config):
    pass

# Create configuration class mapping
config_map = {
    'develop':DevelopmentConfig,
    'product':ProductConfig
}
- Main project directory code display (api_1_0/_init_.py)
from flask import Flask
from flask_sqlalchemy import SQLAlchemy
import pymysql
from config import config_map
pymysql.install_as_MySQLdb()

db = SQLAlchemy()
def create_app(config_name='develop'):
    # Initialize app object
    app = Flask(__name__)
    config = config_map[config_name]
    app.config.from_object(config)

    # Load database
    db.init_app(app)

    # Registration blueprint
    from . import api_1_0
    app.register_blueprint(api_1_0.api,url_prefix="/show")

    return app
- Main program file code display (manager.py)
from car_home import create_app,db
from flask_migrate import Migrate,MigrateCommand
from flask_script import Manager
from flask import render_template

app = create_app()

manager = Manager(app)

Migrate(app,db)

manager.add_command('db',MigrateCommand)

@app.route('/')
def index():
    return render_template('index.html')

if __name__ == '__main__':
    manager.run()
- View file code display (api_1_0/views/_init_.py, show.py)
_init_.py
from flask import Blueprint
from car_home import models
api = Blueprint('api_1_0',__name__)

from . import show
show.py
from . import api
from car_home.models import CarArea,CarUseYear,CarBrandTop10,CarMonth
from flask import render_template
# Calculate the top ten in the number of different brands
@api.route('/showBrandBar')
def showBrandBar():
    car_brand_top10 = CarBrandTop10.query.all()
    brand = [i.brand for i in car_brand_top10]
    count = [i.count for i  in car_brand_top10]
    print(brand)
    print(count)
    return render_template('showBrandBar.html', **locals())


# Calculate the service time of used cars
@api.route('/showPie')
def showPie():
    car_use_year = CarUseYear.query.all()
    data = [{'name':i.year_area,'value':i.count} for i in car_use_year]
    return render_template('showPie.html',**locals())


# Calculate the number of used cars in different regions
@api.route('/showAreaBar')
def showAreaBar():
    car_area = CarArea.query.all()
    area = [i.area for i in car_area]
    count = [i.count for i in car_area]
    return render_template('showAreaBar.html',**locals())

# Calculate the number of used cars per month
@api.route('/showLine')
def showLine():
    car_month = CarMonth.query.all()
    month = [i.month for i in car_month]
    count = [i.count for i in car_month]
    return render_template('showLine.html',**locals())
- Homepage display (index.html)
The home page simply creates four hyperlinks to the corresponding charts
<!DOCTYPE html>
<html lang="en">
<head>
    <meta charset="UTF-8">
    <title>Visual analysis of automobile home</title>
    <style>
        ul{
            width: 800px;
            height: 600px;
            {#list-style: none;#}
            line-height: 60px;
            padding: 40px;
            margin: auto;
        }
        ul li{
            margin-bottom: 20px;
        }
    </style>
</head>
<body>
<ul>
    <li><a href="{{ url_for('api_1_0.showBrandBar') }}"><h3>Calculate the top ten in the number of different brands</h3></a></li>
    <li><a href="{{ url_for('api_1_0.showPie') }}"><h3>Calculate the service time of used cars</h3></a></li>
    <li><a href="{{ url_for('api_1_0.showAreaBar') }}"><h3>Calculate the number of used cars in different regions</h3></a></li>
    <li><a href="{{ url_for('api_1_0.showLine') }}"><h3>Calculate the number of used cars per month</h3></a></li>
</ul>
</body>
</html>

- Template file code display (showAreaBar.html, showBrandBar.html, showLine.html, showPie.html)
showPie.html
<!DOCTYPE html>
<html lang="en">
<head>
    <meta charset="UTF-8">
    <title>Calculate the number of used cars in different regions</title>
    <script src="../static/js/echarts.min.js"></script>
    <script src="../static/js/vintage.js"></script>
</head>
<body>
<div class="cart" style="width: 800px;height: 600px;margin: auto"></div>
<script>
    var MyCharts = echarts.init(document.querySelector('.cart'),'vintage')
    var data = {{ data|tojson }}
    var option = {
        title:{
            text:'Number of used cars in different regions',
            textStyle:{
                fontSize:21,
                fontFamily:'Regular script'
            },
            left:10,
            top:10
        },
        legend:{
            name:['region'],
            left:10,
            bottom:10,
            orient:'vertical'
        },
        tooltip:{
            trigger:'item',
            triggerOn:'mousemove',
            formatter:function (arg)
            {
                return 'Region:'+arg.name+"<br>"+"number:"+arg.value+"<br>"+"Proportion:"+arg.percent+"%"
            }
        },
        series:[
            {
                type:'pie',
                data:data,
                name:'Usage time',
                label:{
                    show:true
                },
                radius:['50%','80%'],
                {#roseType:'radius'#}
                itemStyle:{
                    borderWidth:2,
                    borderRadius:10,
                    borderColor:'#fff'
                },
                selectedMode:'multiple',
                selectedOffset:20
            }
        ]
    }
    MyCharts.setOption(option)
</script>
</body>
</html>
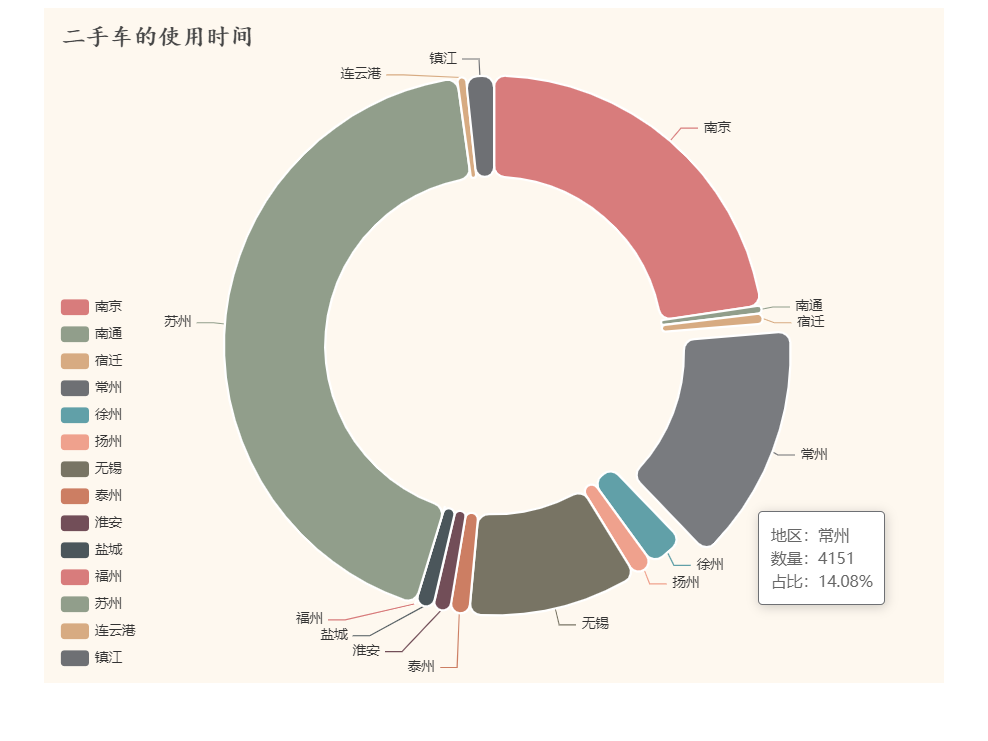
Conclusion: by observing the pie chart, it can be seen that Suzhou is the city with the most second-hand car sales in Jiangsu Province, followed by Nanjing. It can be concluded that the more economically developed cities are, the wider the second-hand car market is.
showBrandBar.html
<!DOCTYPE html>
<html lang="en">
<head>
    <meta charset="UTF-8">
    <title>Calculate the top ten in the number of different brands</title>
    <script src="../static/js/echarts.min.js"></script>
    <script src="../static/js/vintage.js"></script>
</head>
<body>
<div class="cart" style="height: 600px;width: 800px;margin: auto"></div>
<script>
    var MyCharts = echarts.init(document.querySelector('.cart'),'vintage')
    var brand = {{ brand|tojson }}
    var count = {{ count|tojson }}

    var option = {
        title:{
            text:'Top ten in the number of different brands',
            textStyle:{
                fontSize:21,
                fontFamily:'Regular script'
            },
            left:10,
            top:10
        },
        xAxis:{
            type:'category',
            data:brand,
            axisLabel:{
                interval:0,
                rotate:30,
                margin:20
            }
        },
        legend:{
            name:['Automobile brand']
        },
        yAxis:{
            type:'value',
            scale:true
        },
        tooltip:{
            trigger:'item',
            triggerOn: 'mousemove',
            formatter:function(arg)
            {
                return 'Brand:'+arg.name+'<br>'+'number:'+arg.value
            }
        },
        series:[
            {
                type:'bar',
                data:count,
                name:'Automobile brand',
                label:{
                    show:true,
                    position:'top',
                    rotate: true
                },
                showBackground:true,
                backgroundStyle: {
                    color:'rgba(180,180,180,0.2)'
                }
            }
        ]
    }
    MyCharts.setOption(option)

</script>
</body>
</html>
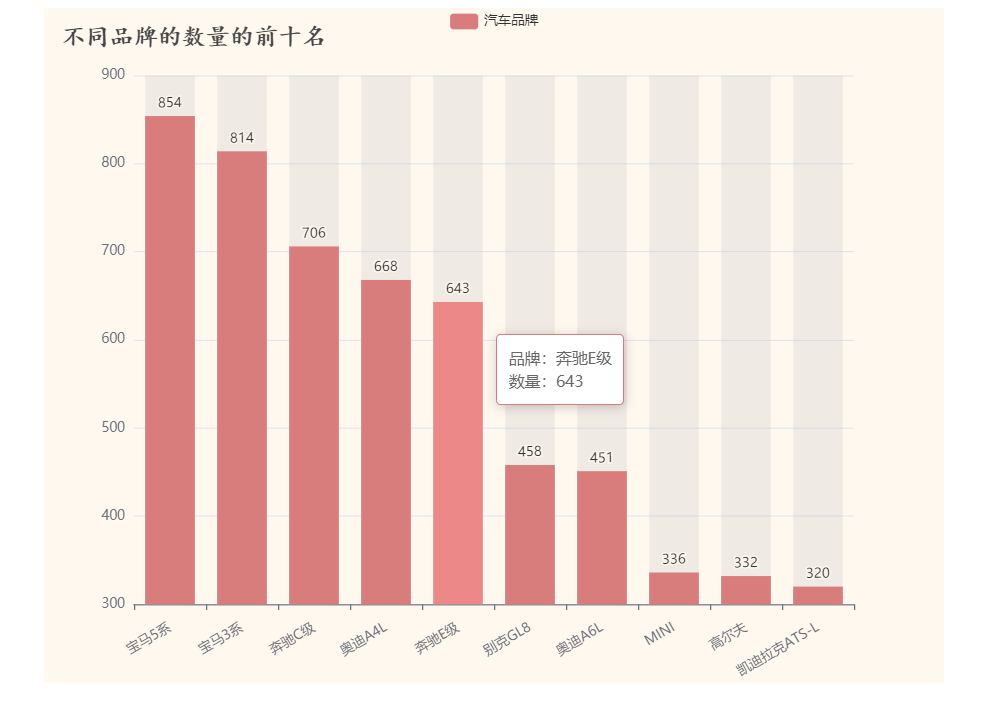
Conclusion: by observing the histogram, we can see that the used cars in Jiangsu Province are mainly BMW, Mercedes Benz and Audi, among which BMW used cars are sold the most, and BMW 5 series and BMW 3 series are in the first and second positions.
showLine.html
<!DOCTYPE html>
<html lang="en">
<head>
    <meta charset="UTF-8">
    <title>Calculate the number of used car releases per month</title>
    <script src="../static/js/echarts.min.js"></script>
    <script src="../static/js/vintage.js"></script>
</head>
<body>
<div class="cart" style="width: 800px;height: 600px;margin: auto"></div>
<script>
    var MyCharts = echarts.init(document.querySelector('.cart'),'vintage')
    var month = {{ month|tojson }}
    var count = {{ count|tojson }}
    var option = {
        title:{
            text:'Number of used car releases per month',
            textStyle:{
                fontSize:21,
                fontFamily:'Regular script'
            },
            left:10,
            top:10
        },
        xAxis:{
            type:'category',
            data:month,
            axisLabel:{
                interval:0,
                rotate:30,
                margin:20
            }
        },
        legend:{
            name:['quantity']
        },
        tooltip:{
            trigger:'axis',
            triggerOn:'mousemove',
            formatter:function(arg){
                return 'month:'+arg[0].name+'month'+"<br>"+'number:'+arg[0].value
            }
        },
        yAxis:{
            type:'value',
            scale:true
        },
        series:[
            {
                type:'line',
                name:'quantity',
                data:count,
                label:{
                    show:true
                },
                showBackground:true,
                backgroundStyle:{
                    color:'rgba(180,180,180,0.2)'
                },
                markPoint:{
                    data:[
                        {
                            name:'Maximum',
                            type:'max',
                            symbolSize:[40,40],
                            symbolOffset:[0,-20],
                            label:{
                                show: true,
                                formatter:function (arg)
                                {
                                    return arg.name
                                }
                            }
                        },
                        {
                            name:'minimum value',
                            type:'min',
                            symbolSize:[40,40],
                            symbolOffset:[0,-20],
                            label:{
                                show: true,
                                formatter:function (arg)
                                {
                                    return arg.name
                                }
                            }
                        }
                    ]
                },
                markLine:{
                    data:[
                        {
                            type:"average",
                            name:'average value',
                            label:{
                                show:true,
                                formatter:function(arg)
                                {
                                    return arg.name+':\n'+arg.value
                                }
                            }
                        }
                    ]
                }
            }
        ]
    }
    MyCharts.setOption(option)
</script>
</body>
</html>
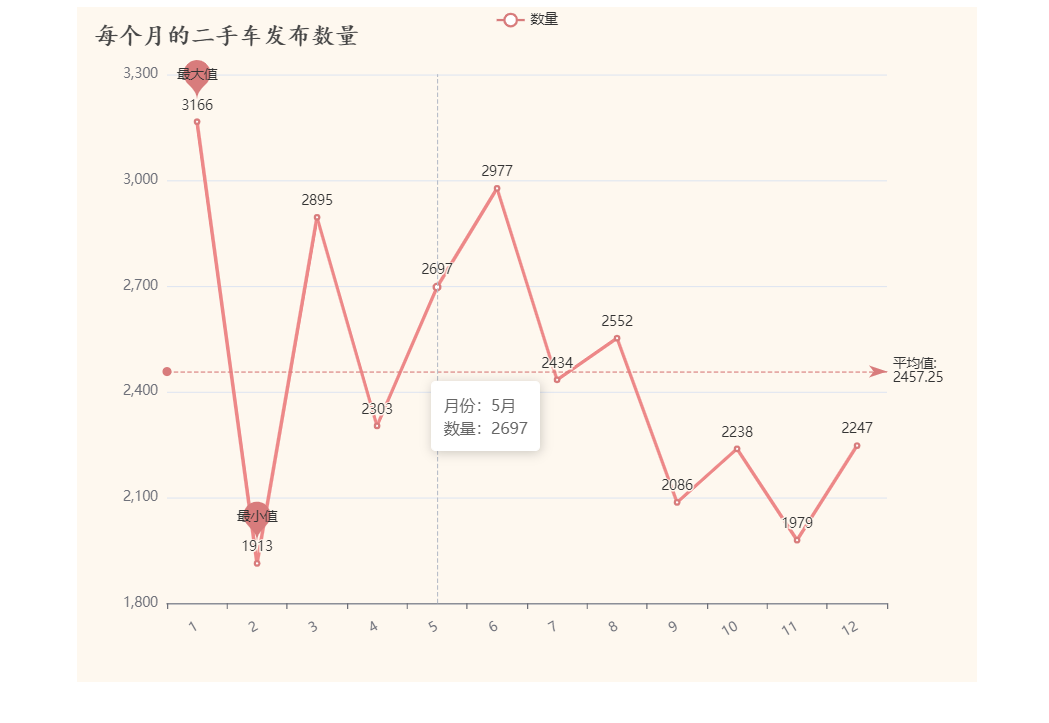
Conclusion: by observing the broken line chart, we can see that the number of used cars released in January is the most, the number of used cars released in February is the least, and most months are lower than the average release level.
showAreaBar.html
<!DOCTYPE html>
<html lang="en">
<head>
    <meta charset="UTF-8">
    <title>Calculate the service time of used cars</title>
    <script src="../static/js/echarts.min.js"></script>
    <script src="../static/js/vintage.js"></script>
</head>
<body>
<div class="cart" style="width: 800px;height: 600px;margin: auto"></div>

<script>
    var MyCharts = echarts.init(document.querySelector('.cart'),'vintage')
    var area = {{ area|tojson }}
    var count = {{ count|tojson }}

    var option = {
        title:{
            text:'Used car usage time',
            textStyle:{
                fontSize:21,
                fontFamily:'Regular script'
            }
        },
        xAxis:{
            type:'category',
            data:area,
            axisLabel:{
                interval:0,
                rotate:30,
                margin:10
            }
        },
        legend:{
            name:['Automobile brand']
        },
        yAxis:{
            type:'value',
            scale:true
        },
        tooltip:{
            tigger:'item',
            triggerOn:'mousemove',
            formatter:function(arg)
            {
                return 'Years:'+arg.name+"<br>"+'number:'+arg.value
            }
        },
        series:[
            {
                type:'bar',
                data:count,
                name:'Automobile brand',
                label:{
                    show:true,
                    position:'top',
                    rotate: 30,
                    distance:15
                },
                barWidth:'40%',
                showBackground:true,
                backgroundStyle: {
                    color:'rgba(180,180,180,0.2)'
                }
            }
        ]
    }
    MyCharts.setOption(option)

</script>
</body>
</html>
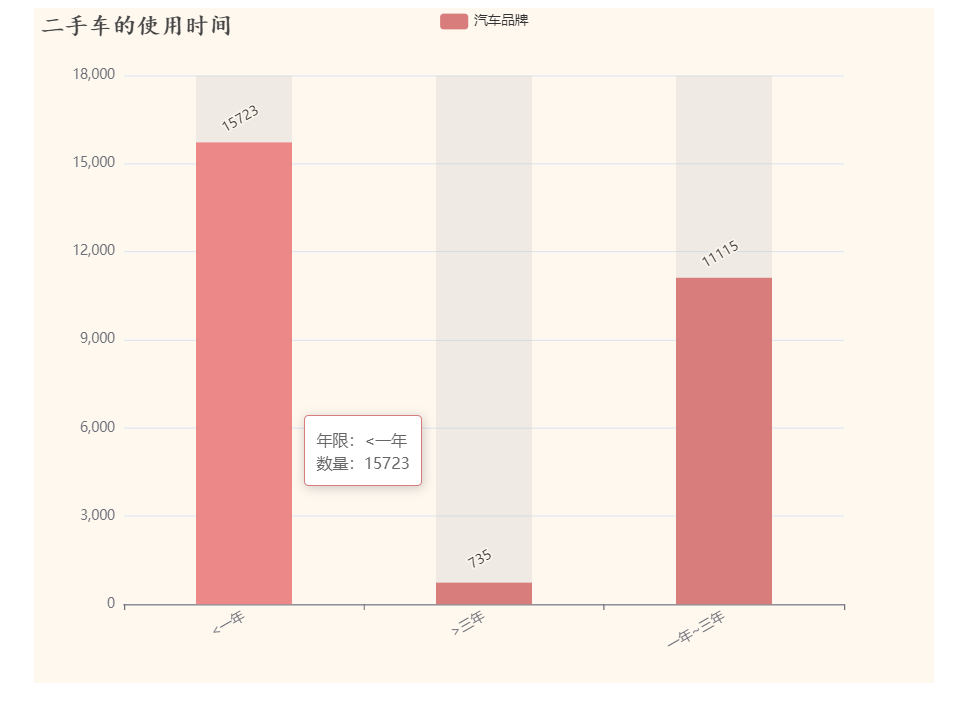
Conclusion: by observing the histogram, we can see that most of the second-hand cars in Jiangsu Province are used within one year, and the number of second-hand cars used for more than three years is less. When you find that you don't like the cars you buy, you should sell them early.
The following is the source code of the project. I hope it can help you. If you have any questions, please comment below
Flash project code link