1. Cat's Eye Movie Criticism Interface
http://maoyan.com/films/1217236
If we visit this directly, we can only see the hottest 10 short reviews on the web side. How can we get all the short reviews?
(1) Visit the link above, press F12, then click the icon on the picture, change the browsing mode (response design mode, Firefox shortcut Ctrl+Shift+M) to mobile mode, refresh the page.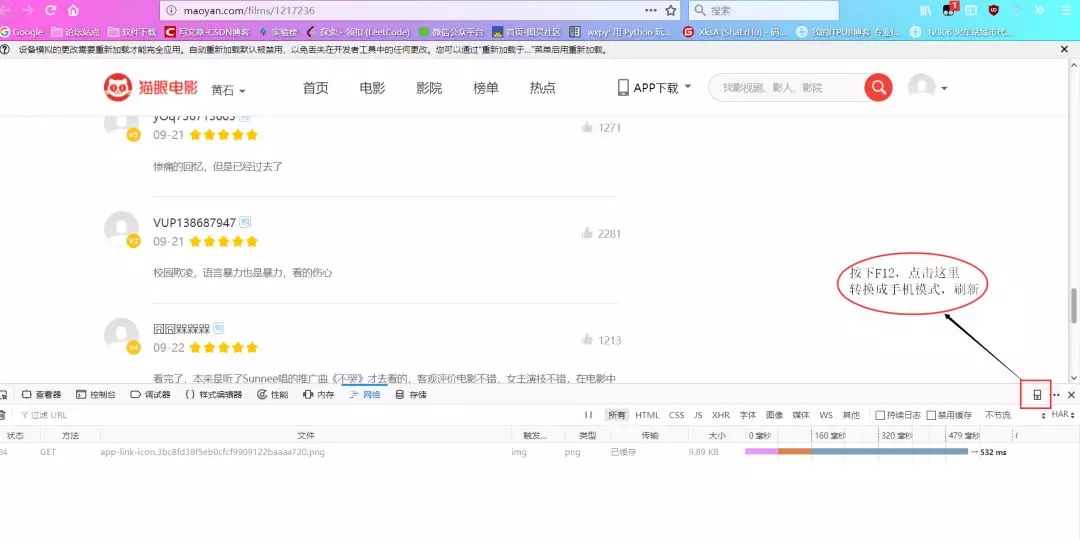
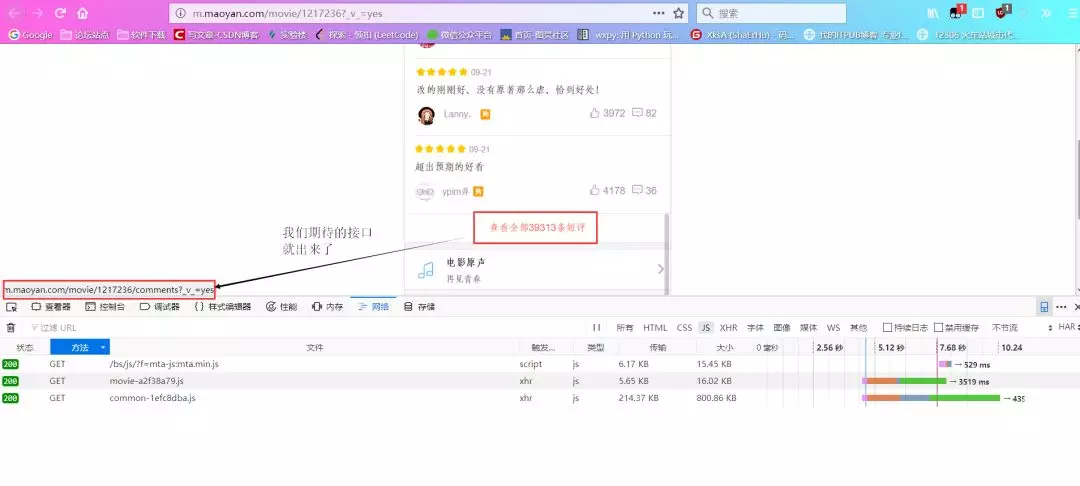
(2) Change to Google Browser and do the above operation under F12. After loading, pull down the short comment, and continue loading the page. Find the load bar containing offset and startTime, and find that its Response contains the data we want, in json format.
2. Get short reviews
(1) Simple analysis
Through the above analysis
Request URL: http://m.maoyan.com/mmdb/comments/movie/1217236.json?v=yes&offset=0&startTime=0%2021%3A09%3A31
Request Method: GET
After several slides, I found the following rules: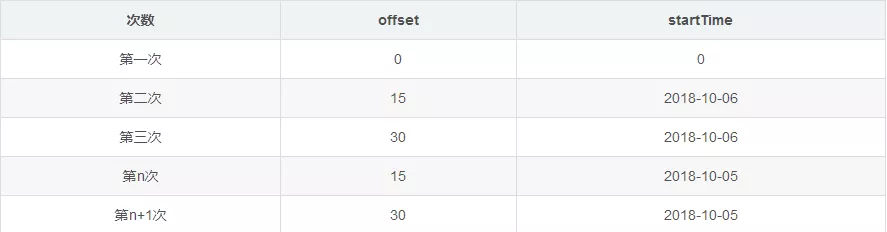
Analyzing the above data changes, we can roughly guess: offset indicates that the interface displays the starting position of comments, 15 comments per page, such as: 15, which shows 15-30 comments in the middle; startTime indicates the time of current comments, fixed format (2018-10-06).
In addition, the final% 2021%3A09%3A31 of the interface is unchanged.
(2) Code acquisition
import requests
from fake_useragent import UserAgent
import json
'''
//The python learning materials prepared by Xiaobian, plus group: 821460695 can be obtained free of charge! ____________
'''
headers = {
        "User-Agent": UserAgent(verify_ssl=False).random,
        "Host":"m.maoyan.com",
        "Referer":"http://m.maoyan.com/movie/1217236/comments?_v_=yes"
    }
# Cat's Eye Movie Short Comment Interface
offset = 0
# The film was released on September 21, 2018.
startTime = '2018-09-21'
comment_api = 'http://m.maoyan.com/mmdb/comments/movie/1217236.json?_v_=yes&offset={0}&startTime={1}%2021%3A09%3A31'.format(offset,startTime)
# Send get request
response_comment = requests.get(comment_api,headers = headers)
json_comment = response_comment.text
json_comment = json.loads(json_comment)
print(json_comment)
Return data: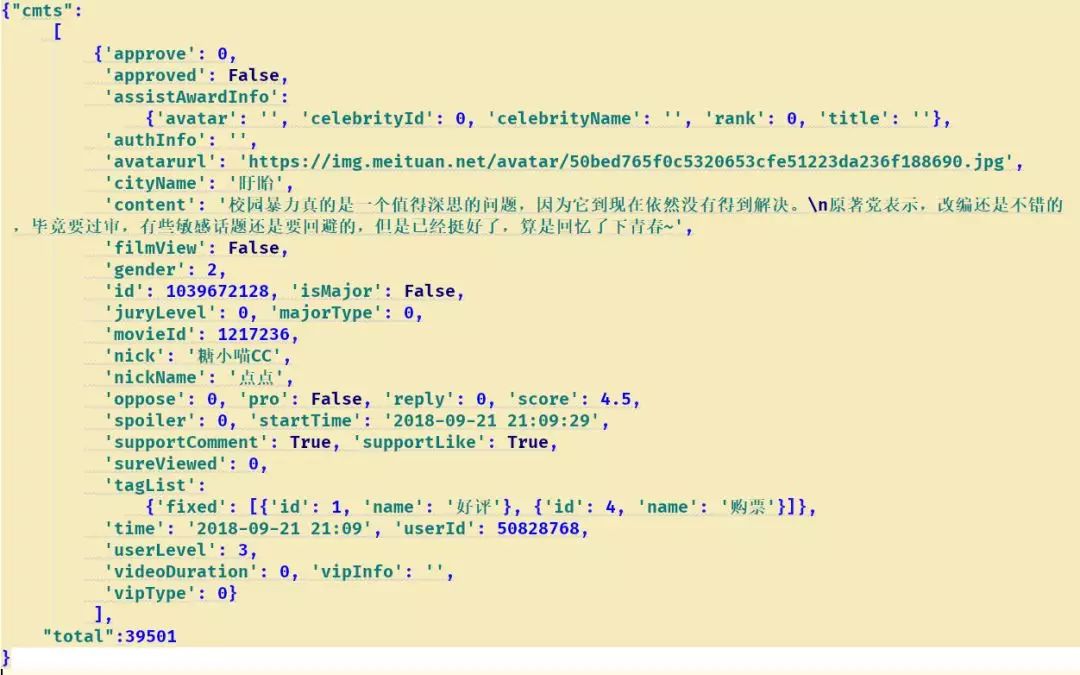
(3) Brief introduction of data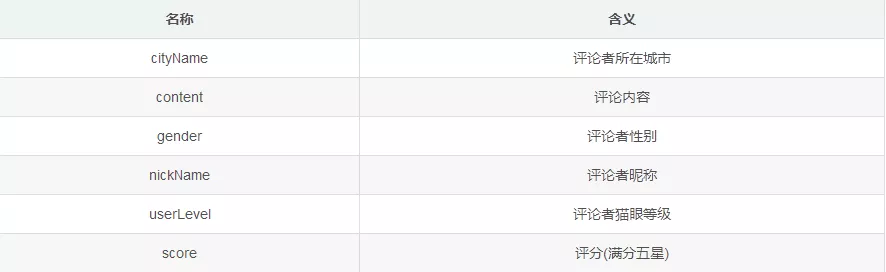
(4) Data extraction
# Get data and store it
def get_data(self,json_comment):
    json_response = json_comment["cmts"]  # list
    list_info = []
    for data in json_response:
        cityName = data["cityName"]
        content = data["content"]
        if "gender" in data:
            gender = data["gender"]
        else:
            gender = 0
        nickName = data["nickName"]
        userLevel = data["userLevel"]
        score = data["score"]
        list_one = [self.time,nickName,gender,cityName,userLevel,score,content]
        list_info.append(list_one)
    self.file_do(list_info)
3. Storage of data
# Storage file
def file_do(list_info):
    # Get file size
    file_size = os.path.getsize(r'G:\maoyan\maoyan.csv')
    if file_size == 0:
        # Header
        name = ['Commentary date', 'Commentator nickname', 'Gender', 'City where','Cat eye rating','score','Comment content']
        # Establishing DataFrame Objects
        file_test = pd.DataFrame(columns=name, data=list_info)
        # Data writing
        file_test.to_csv(r'G:\maoyan\maoyan.csv', encoding='gbk', index=False)
    else:
        with open(r'G:\maoyan\maoyan.csv', 'a+', newline='') as file_test:
            # Append to the back of the file
            writer = csv.writer(file_test)
            # write file
            writer.writerows(list_info)
data display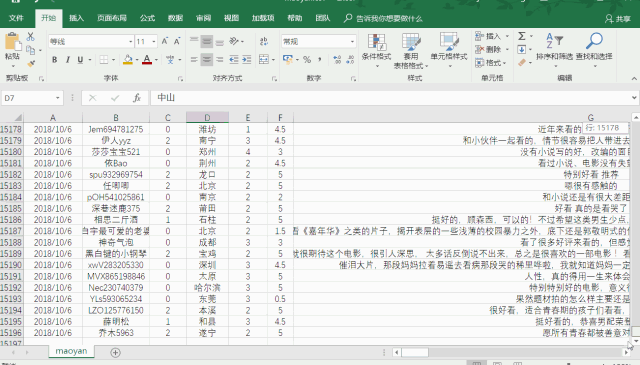
Visualization of Data Analysis
1. Extracting data
Code:
def read_csv():
    content = ''
    # Read file content
    with open(r'G:\maoyan\maoyan.csv', 'r', encoding='utf_8_sig', newline='') as file_test:
        # read file
        reader = csv.reader(file_test)
        i = 0
        for row in reader:
            if i != 0:
                time.append(row[0])
                nickName.append(row[1])
                gender.append(row[2])
                cityName.append(row[3])
                userLevel.append(row[4])
                score.append(row[5])
                content = content + row[6]
                # print(row)
            i = i + 1
        print('There are:' + str(i - 1) + 'Bar data')
        return content
Total: 15195 data
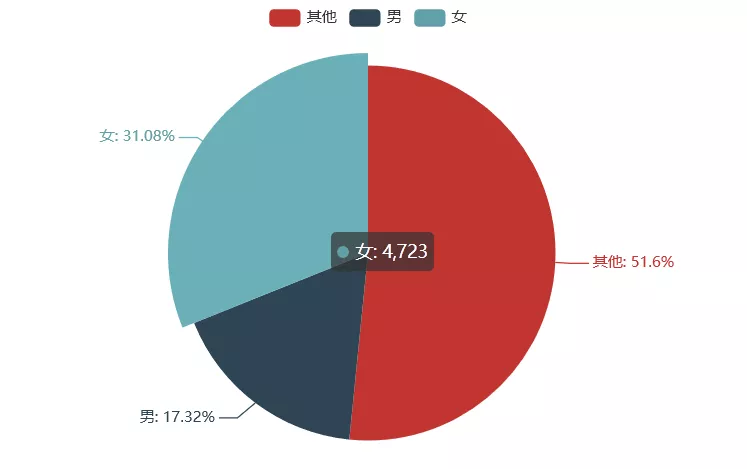
Visualization of Gender Distribution of Commentators
# Visualization of Gender Distribution of Commentators
def sex_distribution(gender):
    # print(gender)
    from pyecharts import Pie
    list_num = []
    list_num.append(gender.count('0')) # Unknown
    list_num.append(gender.count('1')) # male
    list_num.append(gender.count('2')) # female
    attr = ["Other","male","female"]
    pie = Pie("Gender pie chart")
    pie.add("", attr, list_num, is_label_show=True)
    pie.render("H:\PyCoding\spider_maoyan\picture\sex_pie.html")
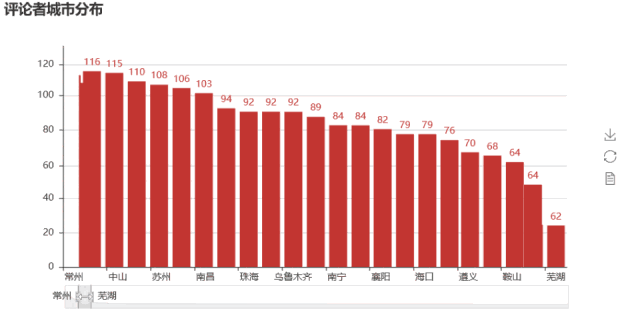
Visualization of the Distribution of Commentators'Cities
# Visualization of the Distribution of Commentators'Cities
def city_distribution(cityName):
city_list = list(set(cityName))
city_dict = {city_list[i]:0 for i in range(len(city_list))}
for i in range(len(city_list)):
city_dict[city_list[i]] = cityName.count(city_list[i])
# Sort by number (dictionary key value)
sort_dict = sorted(city_dict.items(), key=lambda d: d[1], reverse=True)
city_name = []
city_num = []
for i in range(len(sort_dict)):
city_name.append(sort_dict[i][0])
city_num.append(sort_dict[i][1])
import random
from pyecharts import Bar
bar = Bar("Commentator Urban Distribution")
bar.add("", city_name, city_num, is_label_show=True, is_datazoom_show=True)
bar.render("H:\PyCoding\spider_maoyan\picture\city_bar.html")
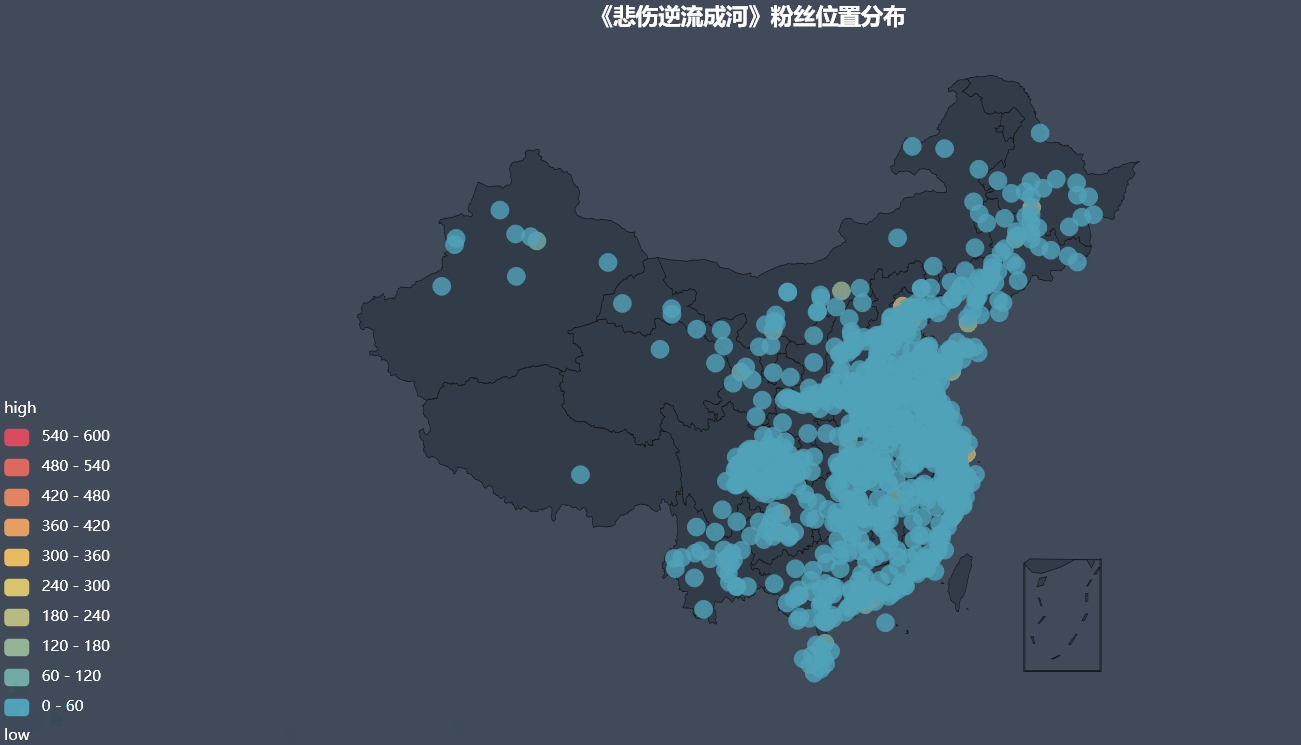
# Map visualization
def render_city(cities):
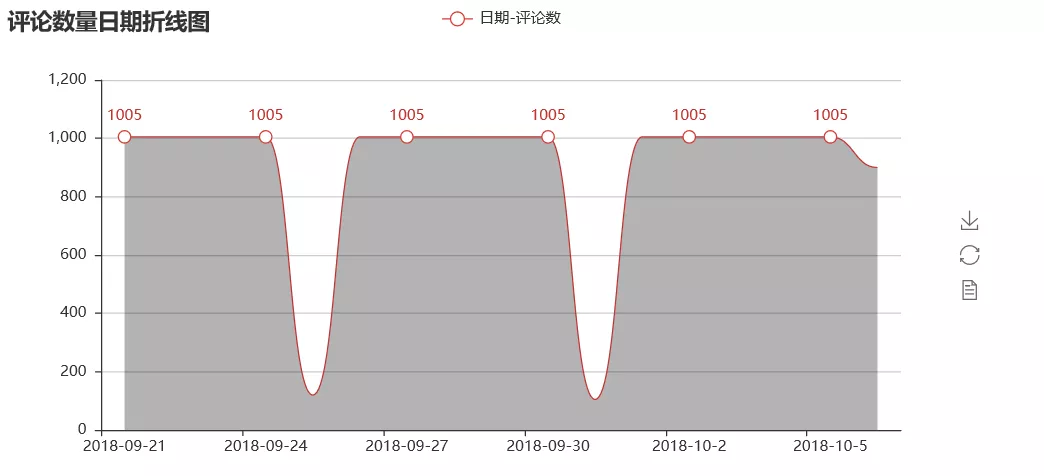
Visual Analysis of Total Daily Comments
def time_num_visualization(time):
    from pyecharts import Line
    time_list = list(set(time))
    time_dict = {time_list[i]: 0 for i in range(len(time_list))}
    time_num = []
    for i in range(len(time_list)):
        time_dict[time_list[i]] = time.count(time_list[i])
    # Sort by number (dictionary key value)
    sort_dict = sorted(time_dict.items(), key=lambda d: d[0], reverse=False)
    time_name = []
    time_num = []
    print(sort_dict)
    for i in range(len(sort_dict)):
        time_name.append(sort_dict[i][0])
        time_num.append(sort_dict[i][1])

    line = Line("Reviews Quantity Date Breakdown")
    line.add(
        "date-Comment number",
        time_name,
        time_num,
        is_fill=True,
        area_color="#000",
        area_opacity=0.3,
        is_smooth=True,
    )
    line.render("H:\PyCoding\spider_maoyan\picture\c_num_line.html")
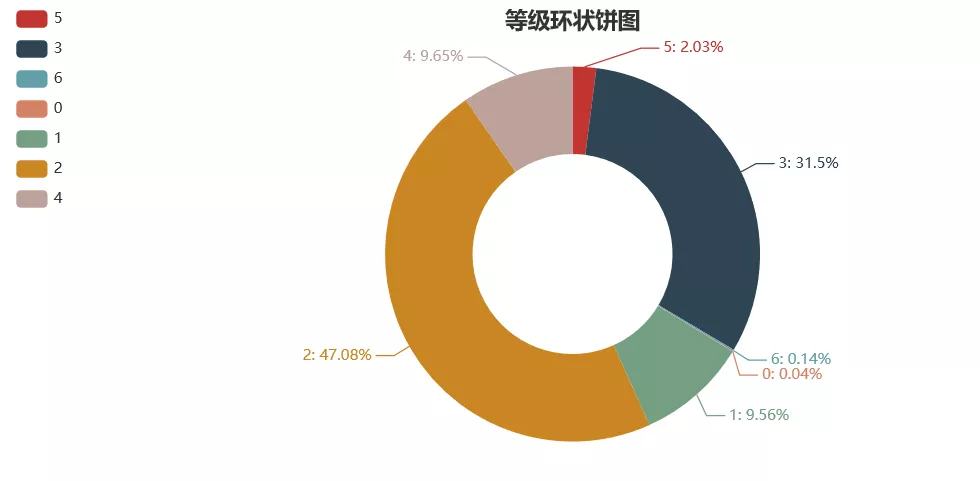
Visualization of Cat's Eye Grading and Scoring
def level_score_visualization(userLevel,score):
from pyecharts import Pie
userLevel_list = list(set(userLevel))
userLevel_num = []
for i in range(len(userLevel_list)):
userLevel_num.append(userLevel.count(userLevel_list[i]))
score_list = list(set(score))
score_num = []
for i in range(len(score_list)):
score_num.append(score.count(score_list[i]))
pie01 = Pie("Hierarchical ring pie chart", title_pos='center', width=900)
pie01.add(
"Grade",
userLevel_list,
userLevel_num,
radius=[40, 75],
label_text_color=None,
is_label_show=True,
legend_orient="vertical",
legend_pos="left",
)
pie01.render("H:\PyCoding\spider_maoyan\picture\level_pie.html")
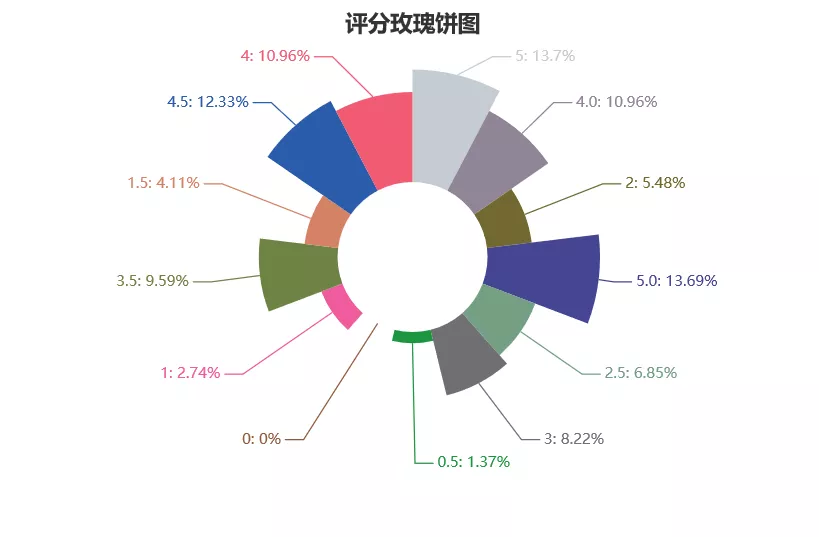
pie02 = Pie("Scoring rose pie chart", title_pos='center', width=900)
pie02.add(
"score",
score_list,
score_num,
center=[50, 50],
is_random=True,
radius=[30, 75],
rosetype="area",
is_legend_show=False,
is_label_show=True,
)
pie02.render("H:\PyCoding\spider_maoyan\picture\score_pie.html")