
Author: Han Xinzi@ShowMeAI
Tutorial address: http://www.showmeai.tech/tutorials/33
Article address: http://www.showmeai.tech/article-detail/146
Notice: All Rights Reserved. Please contact the platform and the author for reprint and indicate the source

When we mention python data analysis, pandas will be used for operation in most cases. This is the introduction of pandas series, which briefly introduces pandas. The whole series covers the following contents:
- Illustrated Pandas core operating functions
- Graphic Pandas data transformation advanced function
- Pandas data grouping and operation
This chapter is "illustrated Pandas core operation function encyclopedia", which explains the core data structures of Pandas for data operation and processing: Series, DataFrame and Index.
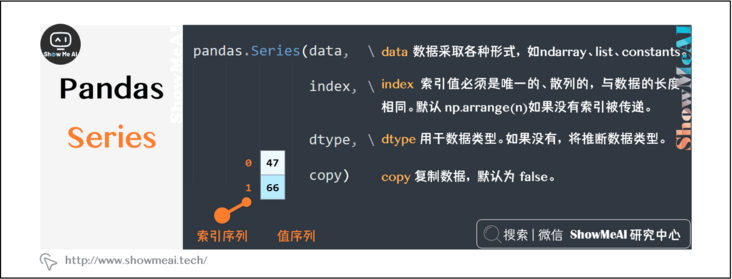
1, Pandas Series
Series is a one-dimensional array object, which contains a value sequence and a corresponding index sequence. The one-dimensional array in Numpy also has an implicitly defined integer index, which can be used to obtain the element value, while series is associated with the element with an explicitly defined index.
Explicit index enables Series objects to have stronger capabilities. The index can be integer or other types (such as string). The index can be repeated without continuity, and the degree of freedom is very high.
pandas.Series(data, index, dtype, copy)
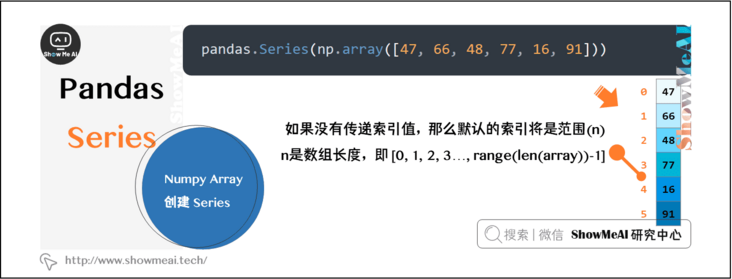
1.1 creating Series from numpy array
If the data is ndarray, the index passed must have the same length. If no index value is passed, the default index will be range (n), where n is the length of the array, i.e. [0,1,2,3..., range(len(array))-1].
pandas.Series(np.array([47, 66, 48, 77, 16, 91]))
1.2 create Series from dictionary
A dictionary (dict) can be passed as input. If no index is specified, the dictionary keys are obtained in sort order to construct the index. If the index is passed, the value in the data corresponding to the label in the index will be pulled out.
pandas.Series({'a':47, 'b':66, 'c':48, 'd':77, 'e':16, 'f':91,})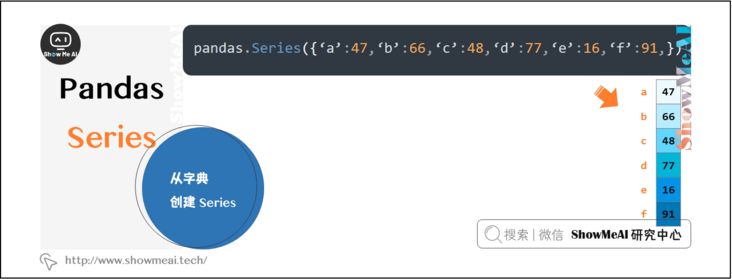
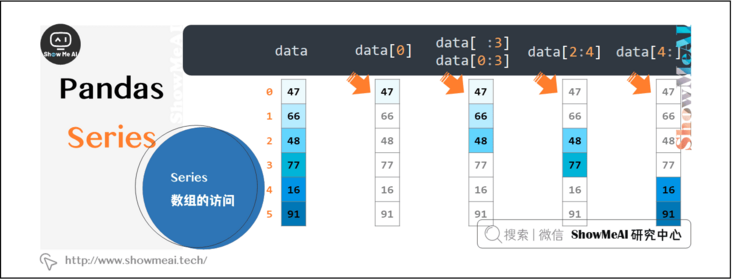
1.3 access to series data
The Series data can be accessed in various ways, and the data in the Series can be accessed similar to the data in ndarray in numpy.
data
data[0]
data[ :3]
data[0:3]
data[2:4]
data[4:]
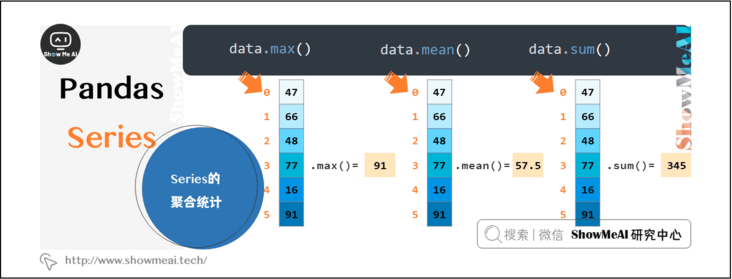
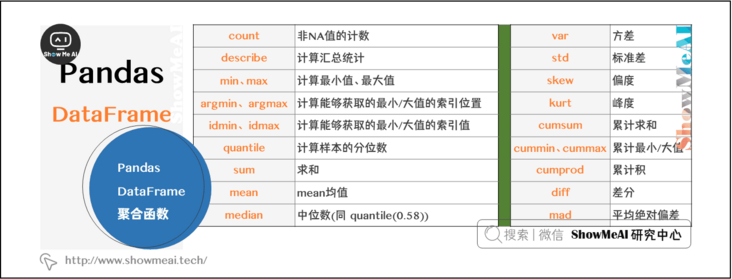
1.4 aggregation statistics of series
Series has many aggregation functions, which can easily count the maximum, sum, average, etc
2, Dataframe
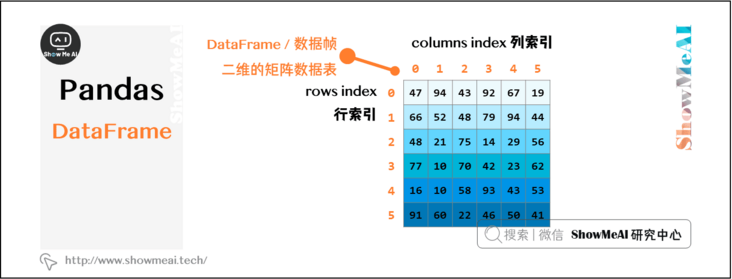
DataFrame is the most frequently used core data structure in Pandas. It represents a two-dimensional matrix data table, similar to the structure of relational database. Each column can have different value types, such as numeric value, string, Boolean value and so on.
Dataframe has both row index and column index. It can be regarded as a dictionary of Series sharing the same index. Its column types may be different. We can also think of dataframe as a spreadsheet or SQL table.
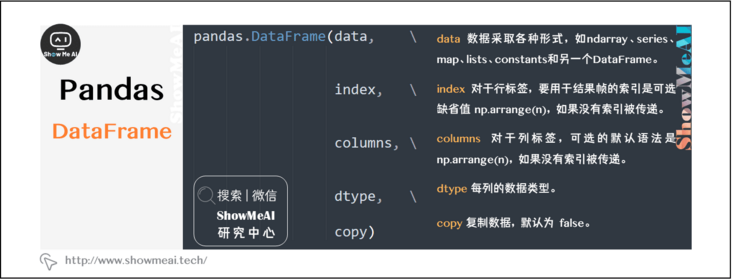
pandas.DataFrame(data, index, columns, dtype, copy)
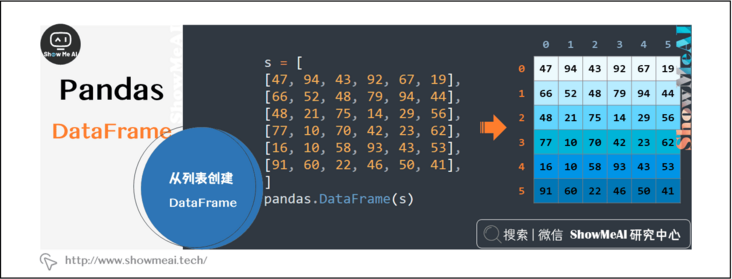
2.1 create DataFrame from list
It is convenient to create a DataFrame from the list. The default row and column index starts from 0.
s = [
[47, 94, 43, 92, 67, 19],
[66, 52, 48, 79, 94, 44],
[48, 21, 75, 14, 29, 56],
[77, 10, 70, 42, 23, 62],
[16, 10, 58, 93, 43, 53],
[91, 60, 22, 46, 50, 41],
]
pandas.DataFrame(s)
2.2 creating DataFrame from dictionary
Create a DataFrame from the dictionary, and automatically index the columns according to the dictionary, and the row index starts from 0.
s = [
'a':[47, 66, 48, 77, 16, 91],
'b':[94, 52, 21, 10, 10, 60],
'c':[43, 48, 75, 70, 58, 22],
'd':[92, 79, 14, 42, 93, 46],
'e':[67, 94, 29, 23, 43, 50],
'f':[19, 44, 56, 62, 55, 41],
]
pandas.DataFrame(s, columns=['a','b','c','d','e','f'))

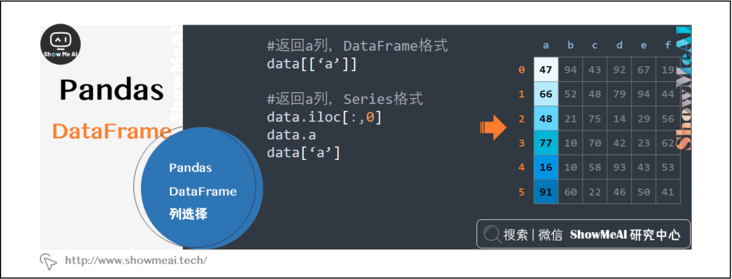
2.3 pandas Dataframe column selection
When I first learned Pandas, row selection and column selection are very easy to be confused. Here I will sort out the commonly used column selection.
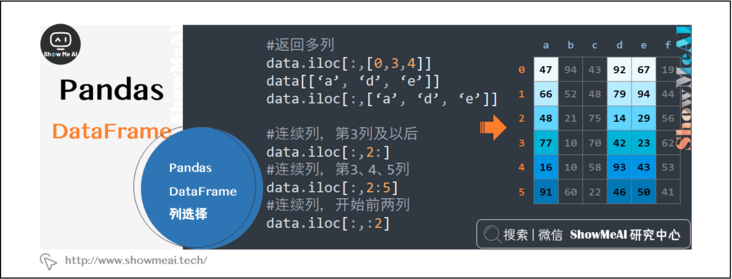
data[['a']]      # Return column a, DataFrame format
data.iloc[:,0]   # Return column a, Series format
data.a           # Return column a, Series format
data['a']        # Return column a, Series format

data.iloc[:,[0,3,4]]
data[['a', 'd', 'e']]
data.iloc[:,['a', 'd', 'e']]
data.iloc[:,2:]    # Column 3 and beyond
data.iloc[:,2:5]   # Columns 3, 4 and 5
data.iloc[:,:2]    # Start two columns
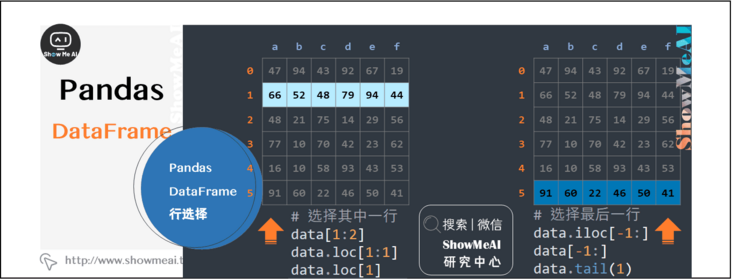
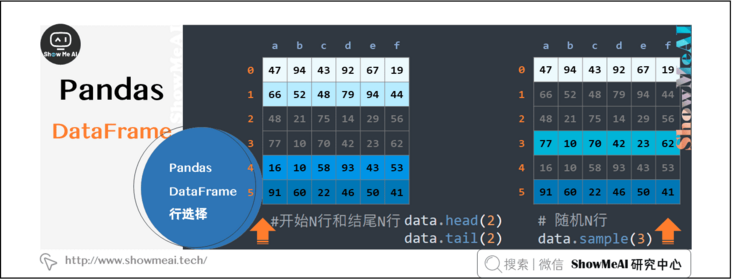
2.4 pandas Dataframe row selection
Sort out a variety of line selection methods, there is always one for you.
data[1:2]
data.loc[1:1]
data.loc[1] #Returns the Series format

data.iloc[-1:]
data[-1:]
data.tail(1)
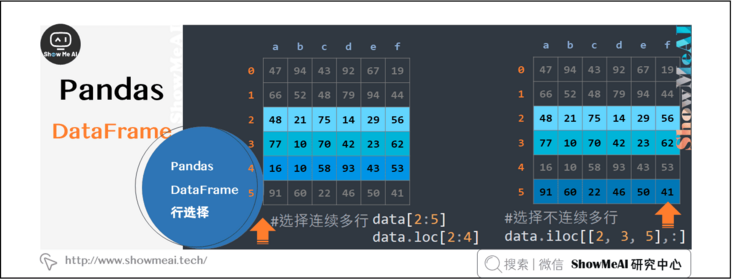
data[2:5]
data.loc[2:4]

data.iloc[[2, 3, 5],:]
data.head(2)
data.tail(2)


data.sample(3)
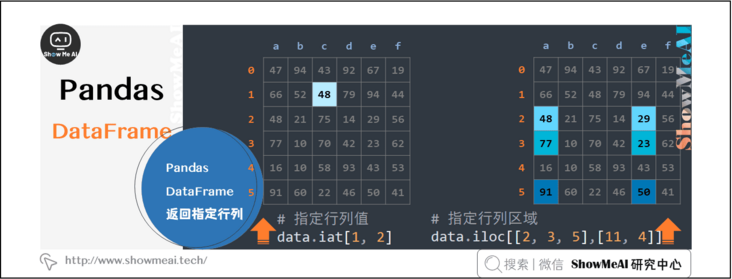
2.5 pandas Dataframe returns the specified row and column
The DataFrame of pandas is very convenient to extract the data in the data frame.
data.iat[1, 2]

data.iloc[[2, 3, 5],[11, 4]]
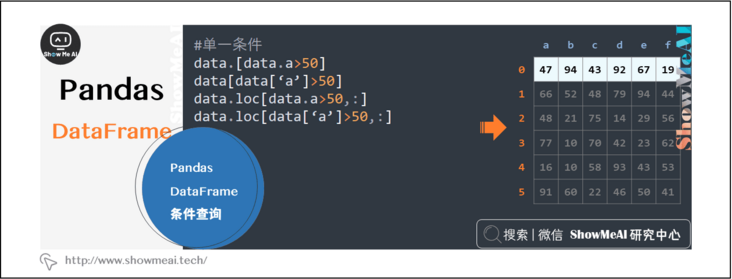
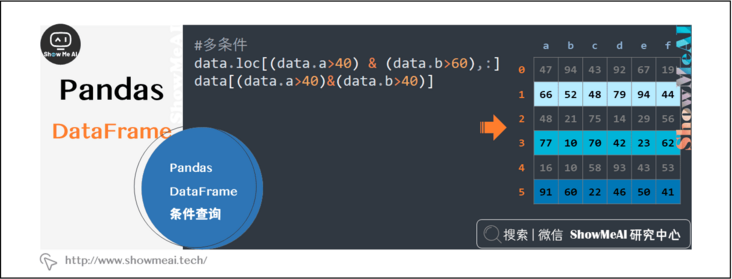
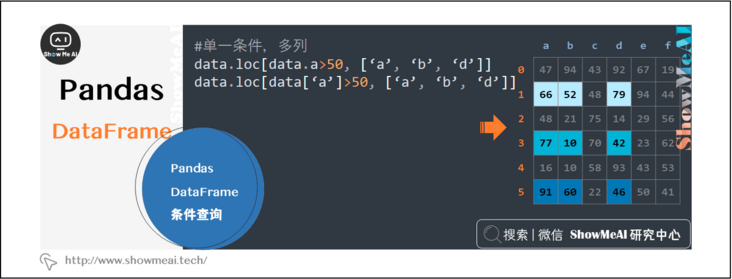
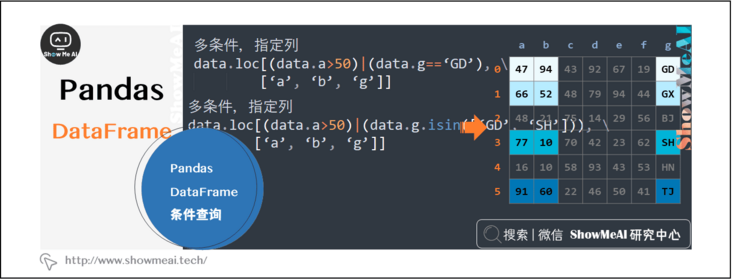
2.6 pandas Dataframe condition query
Select lines for various types of numeric type, text type, single condition and multi condition
data.[data.a>50]
data[data['a']>50]
data.loc[data.a>50,:]
data.loc[data['a']>50,:]
data.loc[(data.a>40) & (data.b>60),:]
data[(data.a>40)&(data.b>40)]
data.loc[data.a>50, ['a', 'b', 'd']]
data.loc[data['a']>50, ['a', 'b', 'd']]
data.loc[(data.a>50)|(data.g=='GD'),['a', 'b', 'g']]
data.loc[(data.a>50)|(data.g.isin(['GD', 'SH'])),['a', 'b', 'g']]
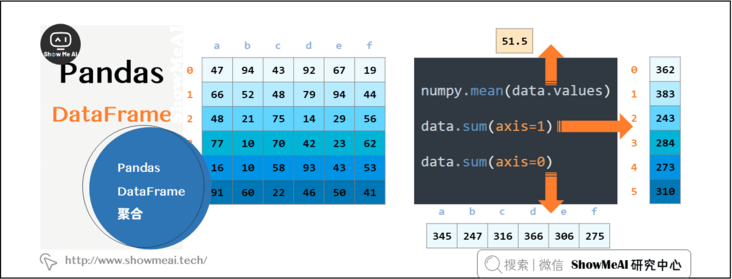
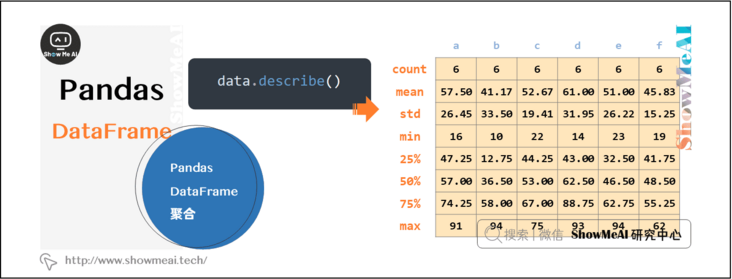
2.7 pandas Dataframe aggregation
You can aggregate data by rows and columns, or you can use the description built in pandas to perform simple and comprehensive data aggregation analysis.
data.sum(axis=1)
numpy.mean(data.values)
data.sum(axis=0)
data.describe()
2.8 aggregation functions in pandas dataframe
data.function(axis=0)  # Calculated by column
data.function(axis=1)  # Calculated by row
2.9 pandas Dataframe grouping statistics
You can perform multiple operations according to the specified multiple columns for summary statistics.
df.groupby('g').sum
df.groupby('g')(['d']).agg([numpy.sum, numpy.mean, numpy.std])
df.groupby(['g', 'h']).mean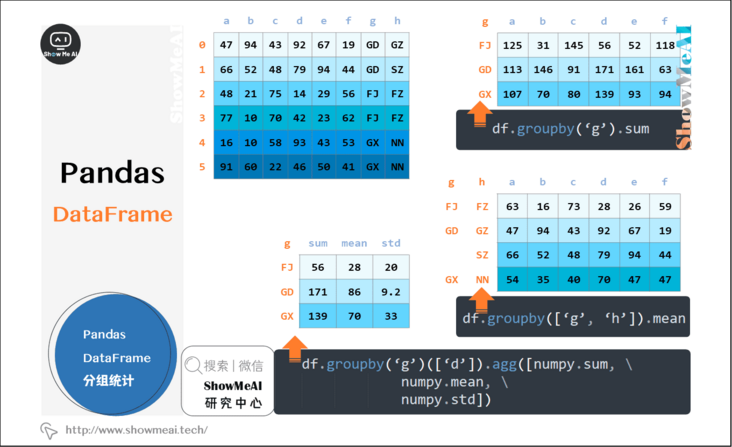
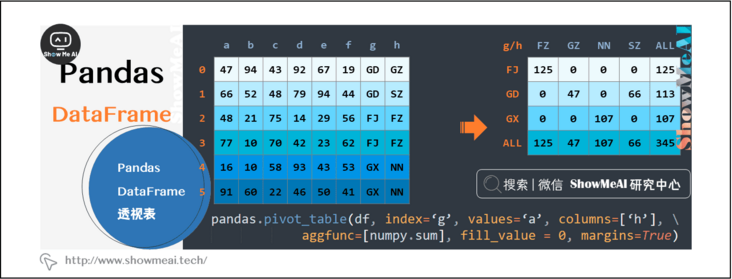
2.10 pandas Dataframe PivotTable
Pivot table is a powerful operation of pandas. A large number of parameters can fully meet your personalized needs.
pandas.pivot_table(df, index='g', values='a', columns=['h'], aggfunc=[numpy.sum], fill_value = 0, margins=True)
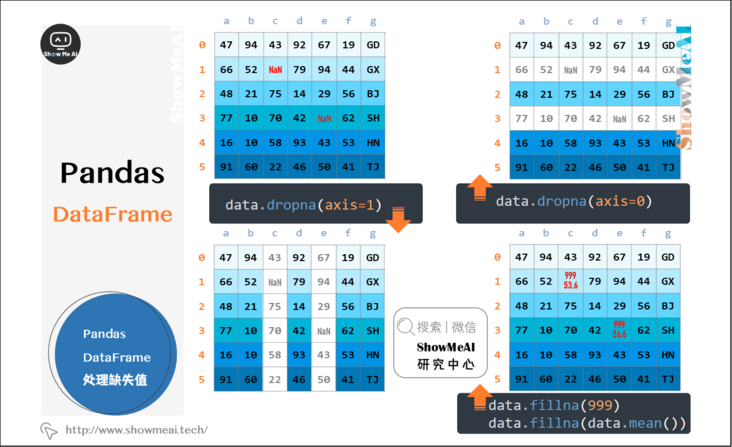
2.11 pandas Dataframe processing missing values
pandas has many ways to deal with missing values to meet various needs.
data.dropna(axis=0)

data.dropna(axis=1)

data.dropna(axis=0)
2.12 finding and replacing pandas dataframe
pandas provides simple search and replace functions. If you want complex search and replace, you can use map(), apply(), and applymap()
data.replace('GD', 'GDS')

df.loc[df.a>50, 'a']=888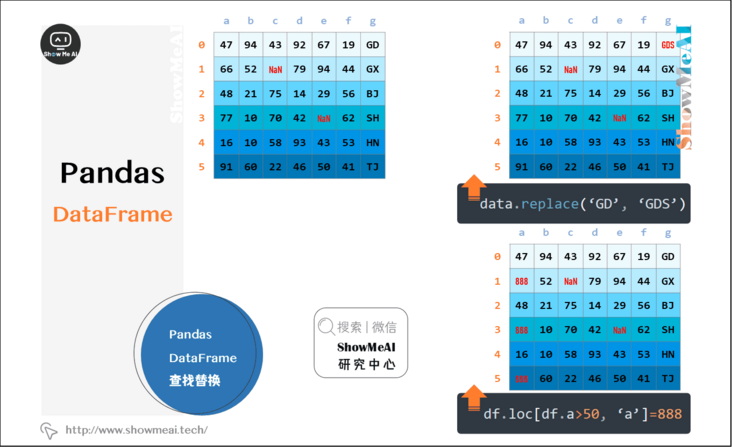
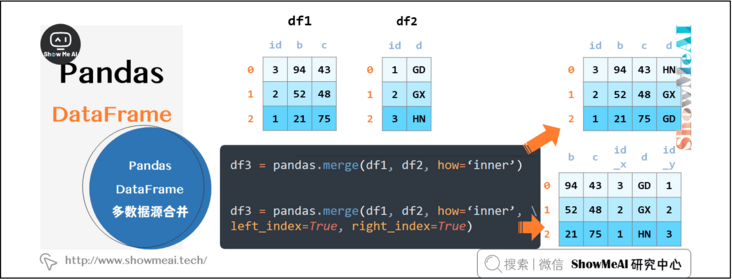
2.13 pandas Dataframe multi data source merging
When merging two dataframes, pandas will automatically align according to the index. You can specify the alignment of the two dataframes, such as inner connection, outer connection, or the aligned index column.
df3 = pandas.merge(df1, df2, how='inner')

df3 = pandas.merge(df1, df2, how='inner', left_index=True, right_index=True)
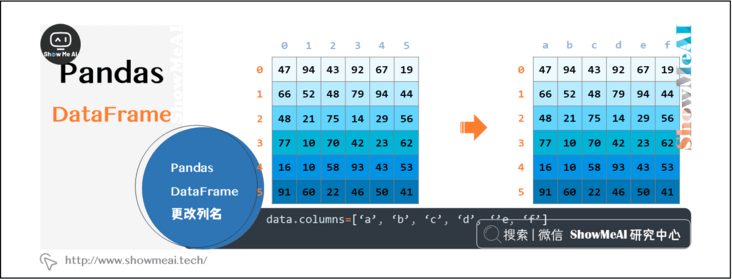
2.14 pandas Dataframe changing column names
pandas needs to modify the column name of Dataframe as follows:
data.columns=['a', 'b', 'c', 'd', ''e, 'f']
2.15 apply transform function of pandas dataframe
This is a powerful function of pandas, which can perform single value operation for each record without manual write loop processing.
df['i']=df.apply(compute, axis=1) # A + b > 100 returns 1, otherwise it returns 0 and is stored in a new column
df['i']=df.apply(compute2, axis=1) # g includes GD and FJ. If e is less than 50, it returns 1. Otherwise, it returns 0
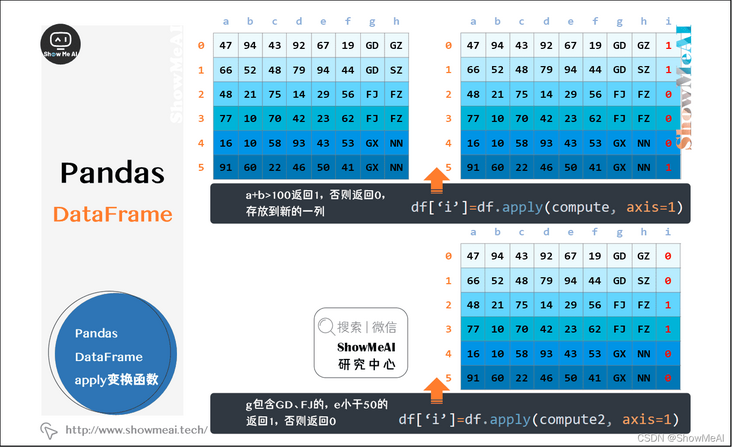
def compute(arr):
   a = arr['a']
   b = arr['b']
   if a+b>100:
       return 1
   else:
       return 0
def compute2(arr):
a = arr['e']
b = arr['g']
if (g in ['GD','FJ']) and (e<50):
return 1
else:
return 0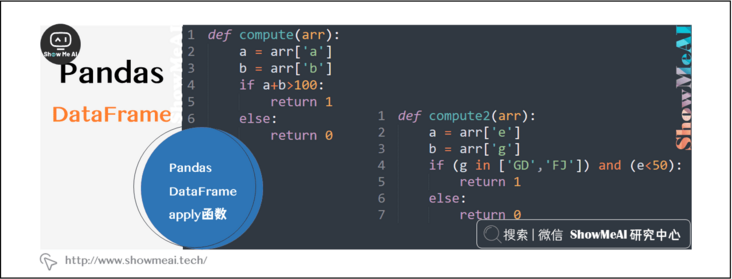
Data and code download
The code of this tutorial series can be downloaded from the github corresponding to ShowMeAI, which can be run in the local python environment. Babies who can surf the Internet scientifically can also directly learn through one click operation and interactive operation with the help of Google Lab!
The quick look-up tables involved in this series of tutorials can be downloaded and obtained at the following address:
- Pandas quick reference table
- NumPy quick look-up table
- Matplotlib quick reference table
- Seaborn checklist
Extended references
ShowMeAI related articles recommended
- Introduction to data analysis
- Data analysis thinking
- Mathematical basis of data analysis
- Business cognition and data
- Data cleaning and preprocessing
- Business analysis and data mining
- Data analysis tool map
- Introduction to statistics and data science computing tool library Numpy
- Numpy and 1D array operations
- Numpy and 2D array operation
- Numpy and high dimensional array operation
- Introduction to Pandas data analysis tool library
- Illustrated Pandas core operating functions
- Graphic Pandas data transformation advanced function
- Pandas data grouping and operation
- Principles and methods of data visualization
- Data visualization based on Pandas
- seaborn tool and data visualization
ShowMeAI series tutorial recommendations
- Illustrated Python Programming: a series of tutorials from getting started to mastering
- Graphic data analysis: a series of tutorials from introduction to mastery
- Fundamentals of graphic AI Mathematics: a series of tutorials from introduction to mastery
- Illustrated big data technology: a series of tutorials from introduction to mastery