python draws 2091 ncov epidemic map
In the first two phases, we have done the work of obtaining real-time tracking data of epidemic situation and building logistic model with confirmed data
python obtains real-time tracking data of 2019-nCoV epidemic
Establishing logistic prediction model
This issue will show you how to use python's basemap module to draw the following epidemic map
Preparation
1. Download pyproj and basemap
Since you need to use basemap, at least ensure that you have installed this module, and basemap depends on the pyproj module. Therefore, you need to install the pyproj module and basemap module first. These two modules are not small, and the basemap is as high as 116M http://www.lfd.uci.edu/~gohlke/pythonlibs/ Download the local installation. For example, my windows 10, 64 bit operating system and python 3.7 download the following two files
pyproj‑1.9.6‑cp37‑cp37m‑win_amd64.whl
basemap‑1.2.1‑cp37‑cp37m‑win_amd64.whl
Then drag and drop the installation through the Anaconda prompt command line.
2. Download shape file
Can arrive https://gadm.org/download_country_v3.html This website downloads Chinese shape files. What's disgusting is that the map given by this website doesn't even include Taiwan Province. This is unacceptable for every patriot. If you find more suitable resources later, you must change them.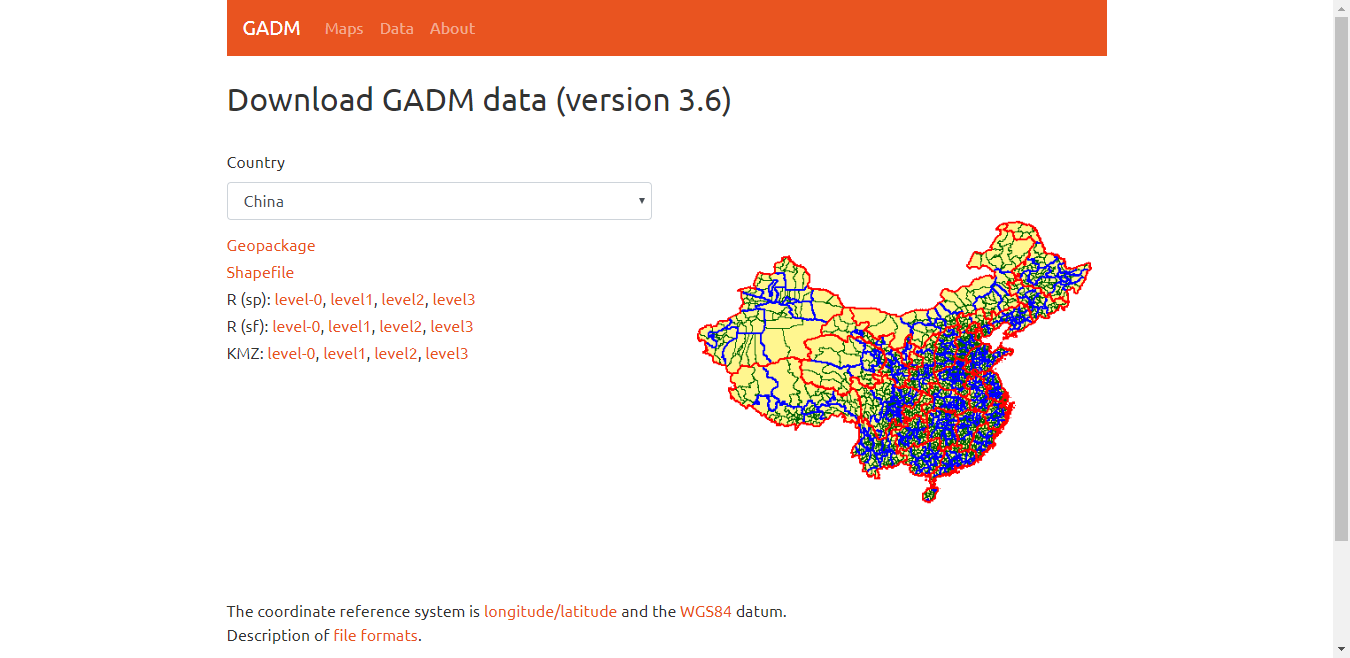
3. Let's focus on the parameter meaning and call of the key function class
basemap
The specific call method is
map=Basemap(llcrnrlon, llcrnrlat, urcrnrlon, urcrnrlat, projection, resolution, ax)
among
- Four parameters, llcrnrlon, llcrnrlat, urcrnrlon, and urcrnrlat, represent the lower bound of longitude, the lower bound of latitude, the upper bound of longitude, and the upper bound of latitude, which are used to limit the scope of display map. For example, in China, the longitude range is 73 ° 33 ′ E to 135 ° 05 ′ E, and the latitude range is 3 ° 51 ′ N to 53 ° 33 ′ N, which can be written as
map=Basemap(llcrnrlon=70, llcrnrlat=3, urcrnrlon=140, urcrnrlat=54, **kwargs)
- Project represents the projection mode of the map. If you have used ArcGIS, you will know that there is no spatial reference when importing the shape file without setting the project parameter. Common project parameters are
'cyl' #The default value, which stands for the abbreviation of cylindric equidistance projection, also known as equidistant cylindrical projection
'ortho' #orthognal means orthogonal projection
'merc' #Famous Mercator projection
Here we use Mercator projection method to write
map=Basemap(llcrnrlon=70, llcrnrlat=3, urcrnrlon=140, urcrnrlat=54, projection='merc', **kwargs)
- Resolution is used to set the detail level of the boundary, that is, the resolution. i f the boundary is not used, it can be "c" (thick), "l" (low), "i" (medium), "h" (high), "F" (full). Here we write a full
map=Basemap(llcrnrlon=70, llcrnrlat=3, urcrnrlon=140, urcrnrlat=54, projection='merc', resolution='f', **kwargs)
- Ax refers to the sequence number covering the graph axis, that is, ax = fig.add_plot(), for example, if I have only one subgraph here, then I will write it out
ax=fig.add_subplot(1, 1, 1)
...
map= Basemap(llcrnrlon=70, llcrnrlat=3, urcrnrlon=140, urcrnrlat=54, projection='merc', resolution='f', ax=ax)
readshapefile
The basic call mode is
readshapefile(self, shapefile, name, drawbounds=True, zorder=None, linewidth=0.5, color='k', antialiased=1, ax=None, default_encoding='utf-8')
- The shapefile parameter is required to indicate the path strength and name of the vector shape file. For example, the decompression column of the shape file I downloaded is as follows

There are four types, i.e. particles with accurate data, 0 for countries, 1 for provinces, 2 for prefecture level cities, 3 for districts and counties. We only need to be accurate to prefecture level cities here, so the file name is gadm36 ﹣ CHN \ gadm36 ﹣ CHN ﹣ 2. At the same time, the function will default that. shp,. sbf, and. shx files exist at the same time with the same file name, but with different suffixes. - name indicates the way of reading, so that it can be called later.
Other defaults are OK. Write them out
map.readshapefile(r'D:\Python project\2019-nCoV Epidemic map\gadm36_CHN\gadm36_CHN_2', 'comarques', drawbounds=False)
The map here is the above Basemap object. When you know these parameters, you can continuously change the parameter values in it and draw a picture of different effects.
Complete code
With the above preparations, I'll write the code below
# -*- coding: utf-8 -*-
"""
Created on Fri Feb  7 17:06:31 2020
project name:2019-nCoV Map
@author: Handsome de Three uncle
"""
import pandas as pd #Import data analysis module
import matplotlib.pyplot as plt #pyplot class of import drawing module
plt.rcParams['font.sans-serif']='SimHei' #Chinese in drawing
plt.rcParams['axes.unicode_minus']=False #Negative sign in drawing
import matplotlib #Import drawing module
from mpl_toolkits.basemap import Basemap #Import basemap class
from matplotlib.patches import Polygon
#from matplotlib.collections import PatchCollection #Choose a map and color it
data=pd.read_csv("20200209 Cases in cities across the country.csv") #Read data
city=data['city_name'] #Name of the city with the epidemic
confirm=data['total_confirm'] #Total number of confirmed cases
data_dict={city[i]:confirm[i] for i in range(len(city))} #Construct into dictionary data format for drawing and calling later

fig=plt.figure(figsize=(8, 5)) #Set canvas size
ax=fig.add_subplot(1,1,1)
map=Basemap(llcrnrlon=70, llcrnrlat=3, urcrnrlon=140, urcrnrlat=54, projection='merc', resolution='f') #Map initialization
map.drawcoastlines(linewidth=0.5) #Coastline
map.readshapefile(r'D:\Python project\2019-nCoV Epidemic map\gadm36_CHN\gadm36_CHN_2', 'comarques', drawbounds=True)#Load administrative division file
comar=map.comarques #Latitude and longitude data
comar_info=map.comarques_info #Essential information
#print(comar_info[0]) #Test the first COMAR? Info
for info, shape in zip(comar_info, comar): #Package into tuples
    city_name=info["NL_NAME_2"] #2357 cities
    for key in data_dict.keys(): #334 cities
        if key in city_name:
            #print(data_dict[key])  #Test the health value
            if data_dict[key]==0:
                color='#f0f0f0'
            elif data_dict[key]<10:
                color='#ffaa85'
            elif data_dict[key]<100:
                color='#ff7b69'
            elif data_dict[key]<1000:
                color='#bf2121'
            else:
                color='#7f1818'
    poly=Polygon(shape, facecolor=color, edgecolor=color)
    ax.add_patch(poly)

handles = [ matplotlib.patches.Patch(color='#ffaa85', alpha=1, linewidth=0),
            matplotlib.patches.Patch(color='#ff7b69', alpha=1, linewidth=0),
            matplotlib.patches.Patch(color='#bf2121', alpha=1, linewidth=0),
            matplotlib.patches.Patch(color='#7f1818', alpha=1, linewidth=0),] #Legend settings
labels = [ '1-9 people', '10-99 people', '100-999 people', '>1000 people'] #Legend
ax.legend(handles, labels, bbox_to_anchor=(0.5, -0.11), loc='lower center', ncol=4) #, prop=font
ax.set_title("2019-nCoV Epidemic map")
plt.show()
Code interpretation
If you can't write code or just want data, or as long as the shape files in it can focus on the "three line science creation" WeChat public number, leave a mailbox and data name, I'll send it to you.
Reference
1,https://zhuanlan.zhihu.com/p/37336863
2,python obtains real-time tracking data of 2019-nCoV epidemic
3,python's implementation of 2019-nCoV epidemic diagnosis data fitting and prediction
4,basemap Chinese Manual
5,English course of basemap
6,https://mp.weixin.qq.com/s/NVUn0gVK9AiEm1II8c3g4g

