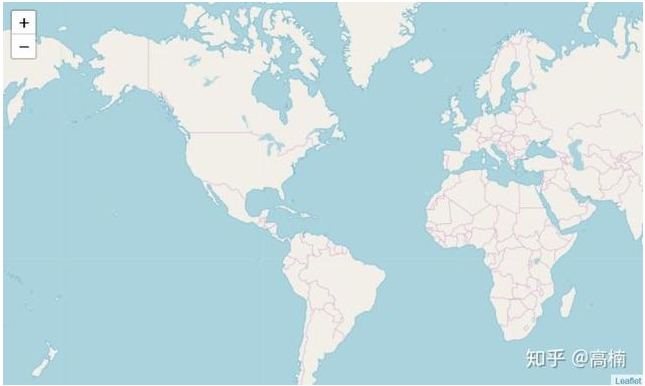
Import packages to create a world map
import folium
import pandas as pd
# define the world map
world_map = folium.Map()
# display world map
world_map
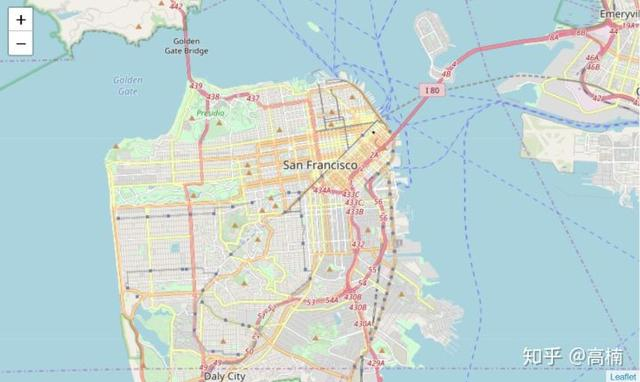
2. input latitude and longitude, scale, here we take (37.7749 degrees N, 122.4194 degree W) as an example.
//If you are interested in python, I have a Python learning base, which has a lot of learning materials, interested.+Q Group:688244617

# San Francisco latitude and longitude values
latitude = 37.77
longitude = -122.42
# Create map and display it
san_map = folium.Map(location=[latitude, longitude], zoom_start=12)
# Display the map of San Francisco
san_map
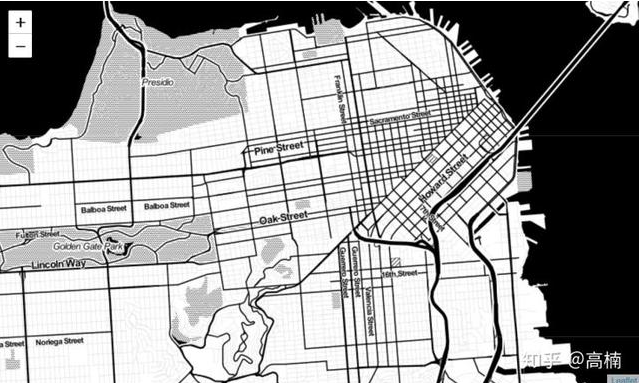
Change the map display, default to the'OpenStreetMap'style, we can also choose'Stamen Terrain','Stamen Toner' and so on.
# Create map and display it
san_map = folium.Map(location=[latitude, longitude], zoom_start=12,tiles='Stamen Toner')
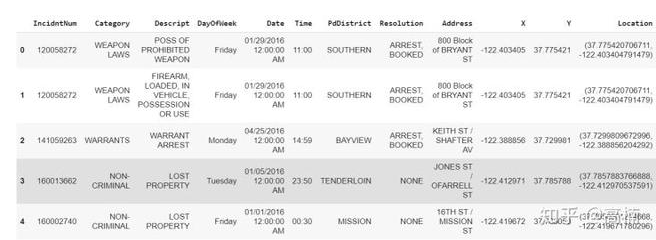
3. read data set (crime data set)
# Read Dataset
cdata = pd.read_csv('https://cocl.us/sanfran_crime_dataset')
cdata.head()
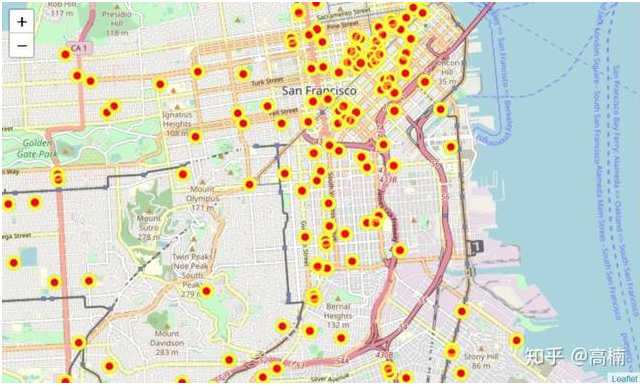
4. Display the top 200 crime data on the map
# get the first 200 crimes in the cdata
limit = 200
data = cdata.iloc[0:limit, :]
# Instantiate a feature group for the incidents in the dataframe
incidents = folium.map.FeatureGroup()
# Loop through the 200 crimes and add each to the incidents feature group
for lat, lng, in zip(cdata.Y, data.X):
 incidents.add_child(
 folium.CircleMarker(
 [lat, lng],
 radius=7, # define how big you want the circle markers to be
 color='yellow',
 fill=True,
 fill_color='red',
 fill_opacity=0.4
 )
 )
# Add incidents to map
san_map = folium.Map(location=[latitude, longitude], zoom_start=12)
san_map.add_child(incidents)
5. Add Geographical Labels
# add pop-up text to each marker on the map
latitudes = list(data.Y)
longitudes = list(data.X)
labels = list(data.Category)
for lat, lng, label in zip(latitudes, longitudes, labels):
 folium.Marker([lat, lng], popup=label).add_to(san_map)

# add incidents to map
san_map.add_child(incidents)

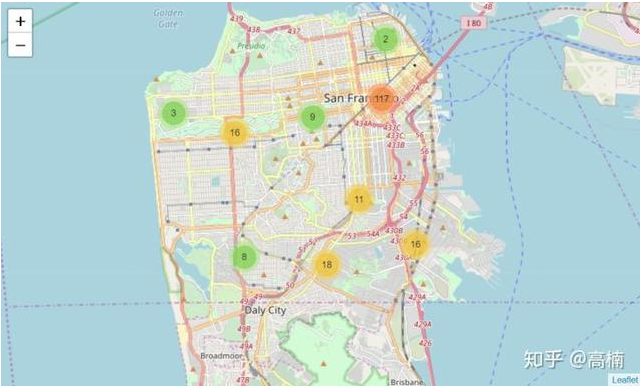
6. Statistics of the total number of regional crimes
from folium import plugins
# let's start again with a clean copy of the map of San Francisco
san_map = folium.Map(location = [latitude, longitude], zoom_start = 12)
# instantiate a mark cluster object for the incidents in the dataframe
incidents = plugins.MarkerCluster().add_to(san_map)
# loop through the dataframe and add each data point to the mark cluster
for lat, lng, label, in zip(data.Y, data.X, cdata.Category):
 folium.Marker(
 location=[lat, lng],
 icon=None,
 popup=label,
 ).add_to(incidents)
# add incidents to map
san_map.add_child(incidents)
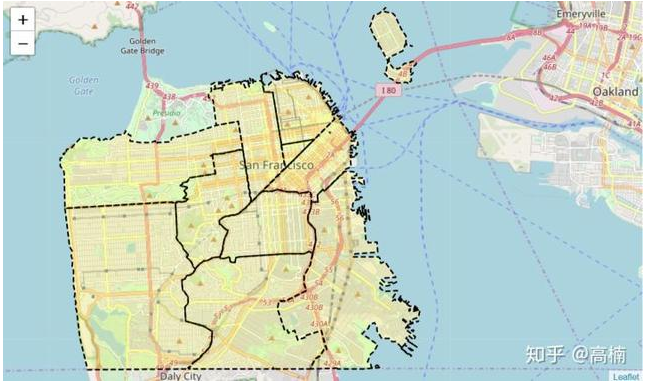
7. read the geojson file to visualize 10 different Neighborhood boundaries.
import json
import requests
url = 'https://cocl.us/sanfran_geojson'
san_geo = f'{url}'
san_map = folium.Map(location=[37.77, -122.4], zoom_start=12)
folium.GeoJson(
 san_geo,
 style_function=lambda feature: {
 'fillColor': '#ffff00',
 'color': 'black',
 'weight': 2,
 'dashArray': '5, 5'
 }
).add_to(san_map)
#display map
san_map
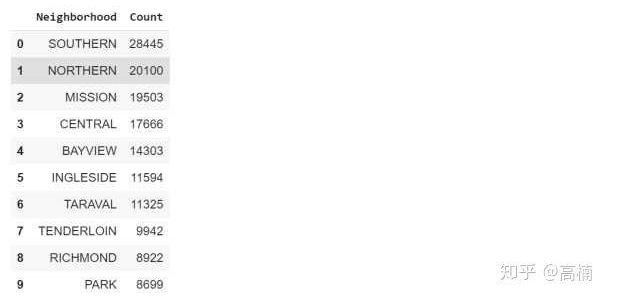
8. Statistics on the number of criminal incidents in each region
# Count crime numbers in each neighborhood
disdata = pd.DataFrame(cdata['PdDistrict'].value_counts())
disdata.reset_index(inplace=True)
disdata.rename(columns={'index':'Neighborhood','PdDistrict':'Count'},inplace=True)
disdata
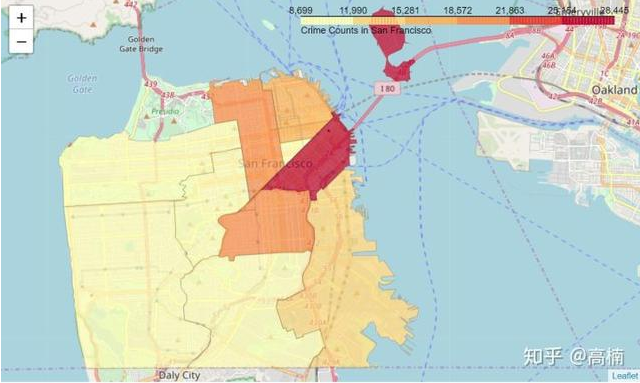
9. Create Choropleth Map (shades of color represent the number of criminal incidents in each district)
m = folium.Map(location=[37.77, -122.4], zoom_start=12)
folium.Choropleth(
 geo_data=san_geo,
 data=disdata,
 columns=['Neighborhood','Count'],
 key_on='feature.properties.DISTRICT',
 #fill_color='red',
 fill_color='YlOrRd',
 fill_opacity=0.7,
 line_opacity=0.2,
 highlight=True,
 legend_name='Crime Counts in San Francisco'
).add_to(m)
m
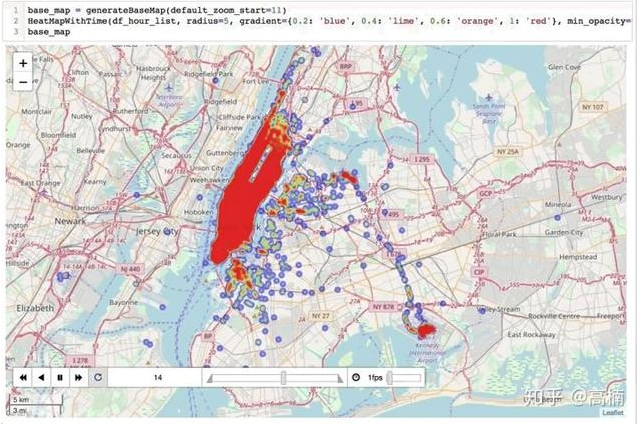
10. Creating Thermal Diagrams
# let's start again with a clean copy of the map of San Francisco
san_map = folium.Map(location = [latitude, longitude], zoom_start = 12)
# Convert data format
heatdata = data[['Y','X']].values.tolist()
# add incidents to map
HeatMap(heatdata).add_to(san_map)
san_map
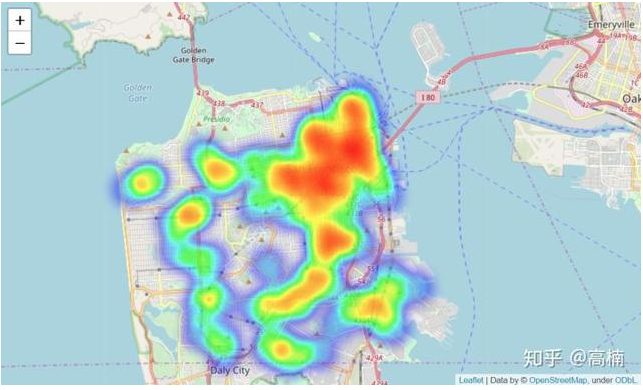
The effect is shown in the following figure.