Matplotlib is an amazing visualization Library in Python for two-dimensional diagrams of arrays. Matplotlib is a multi platform data visualization Library Based on NumPy array, which is designed to be used with a wider SciPy stack.
matplotlib.colors.Normalize
The matplotlib.colors.Normalize class belongs to the matplotlib.colors module. The matplotlib.colors module is used to convert color or digital parameters to RGBA or RGB. This module is used to map numbers to colors or convert color specifications with a one-dimensional color array (also known as colormap).
The matplotlib.colors.Normalize class is used to normalize data to an interval of [0.0, 1.0].
Usage:
class matplotlib.colors.Normalize(vmin=None, vmax=None, clip=False)
If vmin or vmax is not set, it initializes from the minimum and maximum values of the first input processed, respectively. In other words__ call __(Data) call autoscale_None(Data). If the value of clip is set to True and the given value is out of range, it will return 0 or 1, whichever is closest. Returns 0 if vmax == vmin. It works with scalars or arrays containing mask arrays. If clip is True, the mask value is set to 1, otherwise they remain masked.
method:
- autoscale(self, A): this method sets vmin to the minimum value of a and vmax to the maximum value of A.
- autoscale_None(self, A): this method automatically scales only vmin and vmax with no value.
- inverse(self, value): it exchanges the values of vmin and vmax.
- static process_value(value): the value parameter in this method can be a scalar or a sequence. It is used to homogenize input values for effective and simple standardization. This method returns a mask array of matching values. All floating-point data types are preserved, and integer data types with two or fewer bytes are converted to np.float32, while data of larger byte types are converted to np.float64. This is done to speed up large arrays by using in place operations to keep the float32 value as much as possible.
- scaled(self): it returns a Boolean value to check whether vmin or vmax is set.
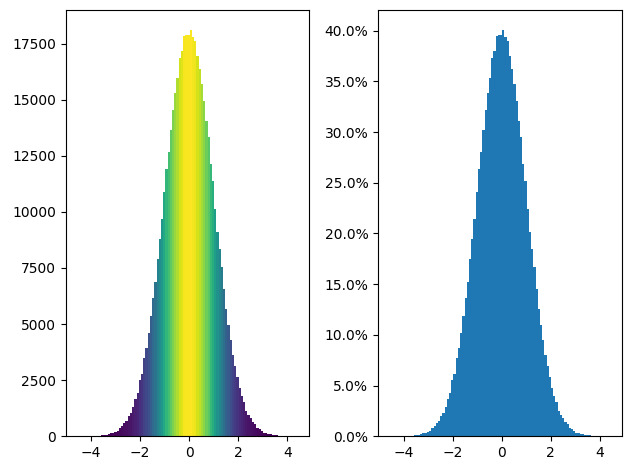
Example 1:
import matplotlib.pyplot as plt
import numpy as np
from matplotlib import colors
from matplotlib.ticker import PercentFormatter

# set a  random state for
# reproducibility
np.random.seed(19687581)

total_points = 500000
total_bins = 100

# Centering at a = 0 and b = 5
# generate normal distributions
a = np.random.randn(total_points)
b = .4 * a + np.random.randn(500000) + 5

figure, axes = plt.subplots(1, 2,
                            tight_layout = True)

# C is the count in each bin
C, bins, patches = axes[0].hist(a,
                                bins = total_bins)

# We'll color code by height,
# but you could use any scalar
fracs = C / C.max()

# Normalize of  the data to 0..1
# for covering the full range of
# the colormap
norm = colors.Normalize(fracs.min(), fracs.max())

# looping through the objects and
# setting the color of each accordingly
for thisfrac, thispatch in zip(fracs, patches):
    color = plt.cm.viridis(norm(thisfrac))
    thispatch.set_facecolor(color)

# normalize the inputs by C
axes[1].hist(a, bins = total_bins, density = True)

# formating the y-axis for displaying
# percentage
axes[1].yaxis.set_major_formatter(PercentFormatter(xmax = 1))
Output:
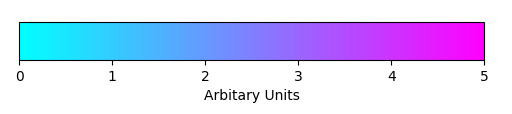
Example 2:
import matplotlib.pyplot as plt
import matplotlib as mpl

figure, axes = plt.subplots(figsize =(6, 1))
figure.subplots_adjust(bottom = 0.5)

color_map = mpl.cm.cool
normlizer = mpl.colors.Normalize(vmin = 0, vmax = 5)

figure.colorbar(mpl.cm.ScalarMappable(norm = normlizer,
               cmap = color_map),
               cax = axes, orientation ='horizontal',
               label ='Arbitary Units')
Output: