Types and introduction of K-means algorithm
Unsupervised learning clustering algorithm;
Clustering algorithm is an unsupervised algorithm, and K-means is a clustering algorithm;
Definition of K-means algorithm
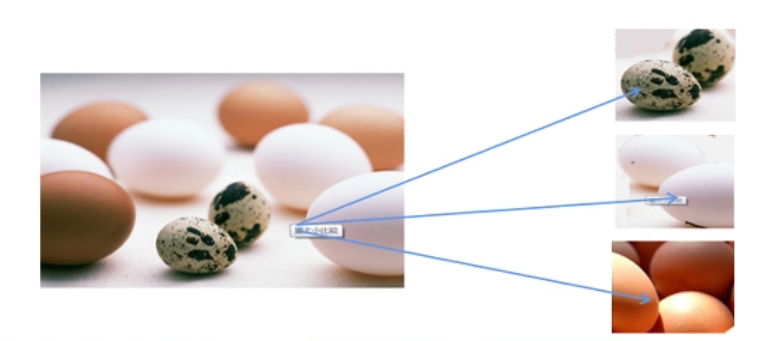
The so-called clustering problem is to give an element set D, in which each element has n observable attributes, and use some algorithm to divide d into K subsets. It is required that the similarity between elements in each subset should be as high as possible, while the similarity between elements in different subsets should be as low as possible. Each subset is called a cluster. Clustering purpose: intra class similarity and inter class difference
Clustering algorithm is different from classification algorithm. Classification is example learning, which requires to clarify each category before classification and assert that each element is mapped to a category. Clustering is observational learning, which can not know the category or even give the number of categories before clustering. It is a kind of unsupervised learning
Application scenario of K-means algorithm
In business, clustering can help market analysts find different customer groups from the customer base, and describe the characteristics of different consumer groups with different purchase patterns
Principle of K-means algorithm
- K elements are randomly selected from dataset D as the centers (centroids) of K cluster classes
- Calculate the similarity between the remaining elements and k cluster centers (the closer the calculation distance is, the higher the similarity is), and classify them as the most similar cluster
- According to the clustering results, the clustering center is re divided. The calculation method is to take the arithmetic mean of each dimension of all elements in the cluster.
- Repeat steps 2-3 until the stop conditions are met
The stop condition is: 1 The clustering results hardly change; 2. Reach a certain number of iterations
Characteristics of K-means algorithm
- Custom K value required
- If the data has dimensional influence, data standardization is required
- Affected by outliers (if there are outliers, they usually form their own category)
- It will converge to the local optimum (the cluster center is randomly initialized, so the result cannot reach the global optimum)
Measure the clustering effect: observe the sum of the distance from each sample to their clustering center
Before K-means algorithm, consider whether there are outliers and whether standardization is required
K-means API
def __init__(self, n_clusters=8, init='k-means++', n_init=10,
             max_iter=300, tol=1e-4, precompute_distances='auto',
             verbose=0, random_state=None, copy_x=True,
             n_jobs=None, algorithm='auto'):

parameter n_clusters ---K The minimum value is 2
 parameter init Method of cluster center initialization  k-means++
parameter max_iter Maximum number of iterations if it cannot converge later (convergence) convergence) turn up max_iter
 parameter random_state Random seed
How K-means selects the optimal K value
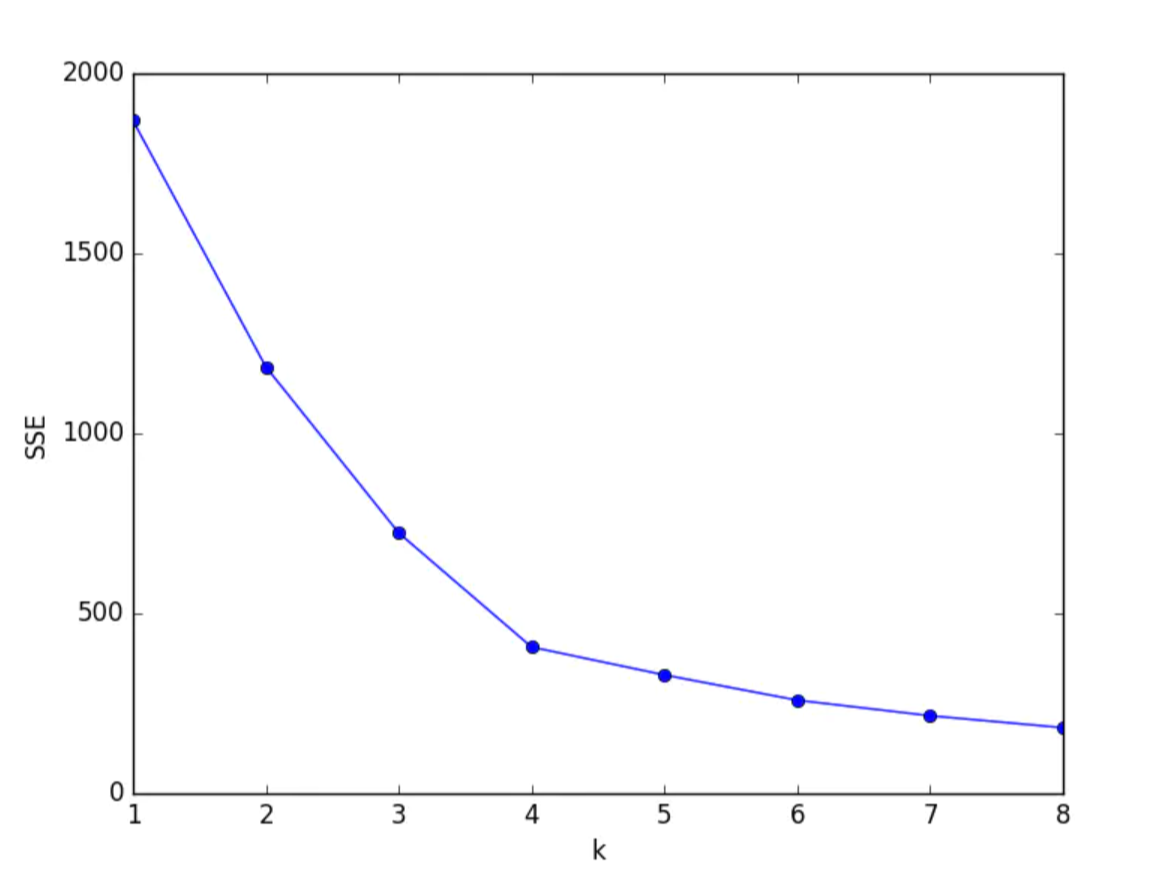
Elbow method
- First set some K values and calculate SSE (sum of squares of errors) of different K values. SSE range [-- inf, 0]
SSE calculation method: sum of distances from all samples to their respective cluster centers - When drawing an image, it is better to select the K value of the inflection point of the image. Because the image is similar to the elbow, it is called the elbow method. Select the inflection point of the elbow. The elbow method selects a relatively good point, which is equivalent to a compromise effect, so that the prediction result will not be too bad and prevent the occurrence of over fitting phenomenon.
Obtain the optimal contour coefficient
- Set some column K values and count the contour coefficient (silhouette_score) of different K values, with a range of [- 1, 1]
Similarities and differences between Kmeans and KNN
Same:
- All have a K value
- Both use distance to measure (characterize) similarity
Different:
- K in KNN represents the number of nearest points around the selected test point
- K in Kmeans stands for clustering data into k classes
- KNN is a supervised learning classification and regression algorithm
- K-mean unsupervised clustering algorithm
Using sklearn to implement K-means algorithm
from sklearn.cluster import KMeans
from sklearn.preprocessing import MaxAbsScaler  # Decimal calibration standardization
from sklearn.preprocessing import MinMaxScaler  # Deviation standardization
from sklearn.preprocessing import StandardScaler  # Standardization of standard deviation
# Evaluation index - contour coefficient
from sklearn.metrics import silhouetee_score

# Due to the clustering algorithm, the data may have dimensions and need to be standardized before using the algorithm
# instantiation
sca = MaxAbsScaler()
sca = MinMaxScaler()
sca = StandardScaler()
# fitting
sca.fit( Training set features )
# Processing data
X_train = sca.transform( Training set features )


# instantiation
km = KMeans()
# Parameters:
# n_clusters=3, which means k=3, that is, three random cluster centers, and the minimum value is 2
# init, cluster center initialization method, default k-means++
# max_iter, the maximum number of iterations. The default is 300. If you can't converge later, you can try to increase the number of iterations
# random_state=1, random seed. The default is None

# fitting
km.fit( Training set features )

# View cluster center
print('Cluster center:', km.cluster_centers_)

# View forecast results
# The training set can be imported directly or the user-defined two-dimensional array can be imported
y_pred = km.predict( Training set features )
print('Category of the entire data:', y_pred)

# Check SSE --- sum of squares of errors
# The default is reverse operation. In most cases, the negative value [- inf, 0] is obtained
# The smaller the absolute value, the better
score = km.score(X_train, y_pred)
print('SSE', score)

# Evaluation index - contour coefficient (- 1, 1), the larger the better
print('Profile factor:', silhouetee_score(X_train, y_pred))