pyecharts module
brief introduction
Echarts is an open-source data visualization by Baidu, with good interactivity and exquisite chart design, it has been recognized by many developers. Python is a expressive language, which is suitable for data processing. When data analysis meets data visualization, pyechart is born.
If you want to master pyecharts, you can read pyecharts Chinese document , the chart types and configuration items in it are very detailed, I can't elaborate more
Installing pyecharts
The command to install is also very simple:
pip install pyecharts
Installation successful: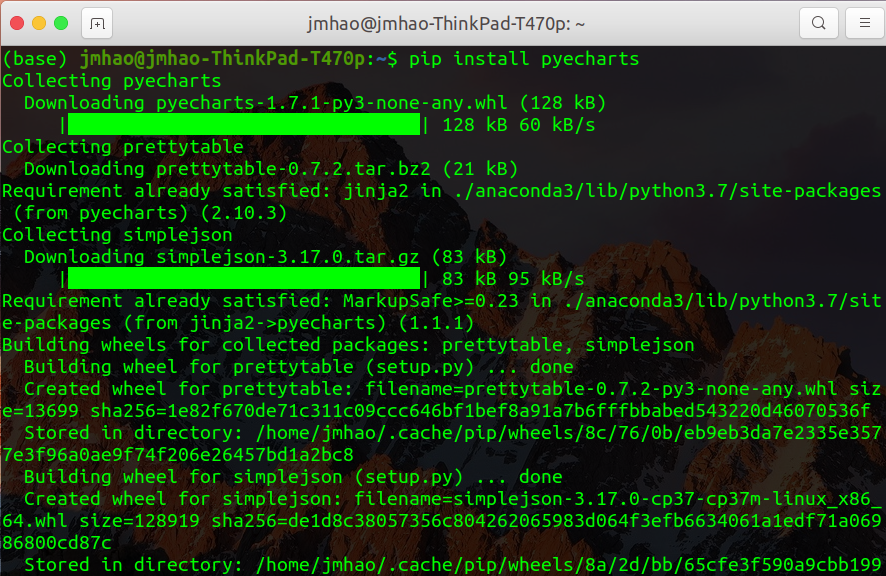
Test the pyecharts module
We can try to run a few small examples given in the official documents to test whether the pyecharts module is installed successfully
Open the editor, enter and run the following code:
from pyecharts.charts import Bar
from pyecharts import options as opts
# Built in theme types can be found in pyecharts.globals.ThemeType
from pyecharts.globals import ThemeType

bar = (
    Bar(init_opts=opts.InitOpts(theme=ThemeType.LIGHT))
    .add_xaxis(["shirt", "cardigan", "Chiffon shirt", "trousers", "high-heeled shoes", "Socks"])
    .add_yaxis("business A", [5, 20, 36, 10, 75, 90])
    .add_yaxis("business B", [15, 6, 45, 20, 35, 66])
    .set_global_opts(title_opts=opts.TitleOpts(title="Main title", subtitle="Subtitle"))
)
bar.render()   #Save as html file
If a file named render.html is generated in the current directory at this time
Open this file and see the following picture to prove the success of module installation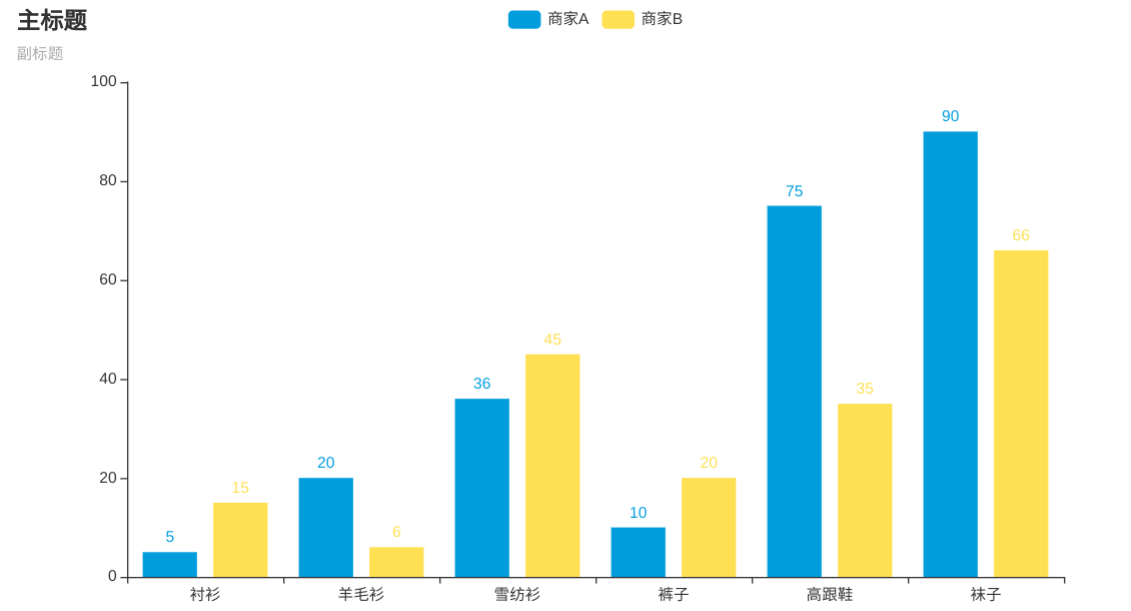
pyecharts Combat: novel coronavirus pneumonia map
requirement analysis
If we want to make a map of the global epidemic (air quality map, population distribution map is the same), the first thing we need is the epidemic data of each country, such as the number of people, the number of cures, the number of growth... So how can we get this information?
Request data
We found that the latest epidemic information will be published on many app s and web pages. The data source I selected is Tencent map.
Open first Epidemic information page of Tencent map , information about the outbreak can be found on this page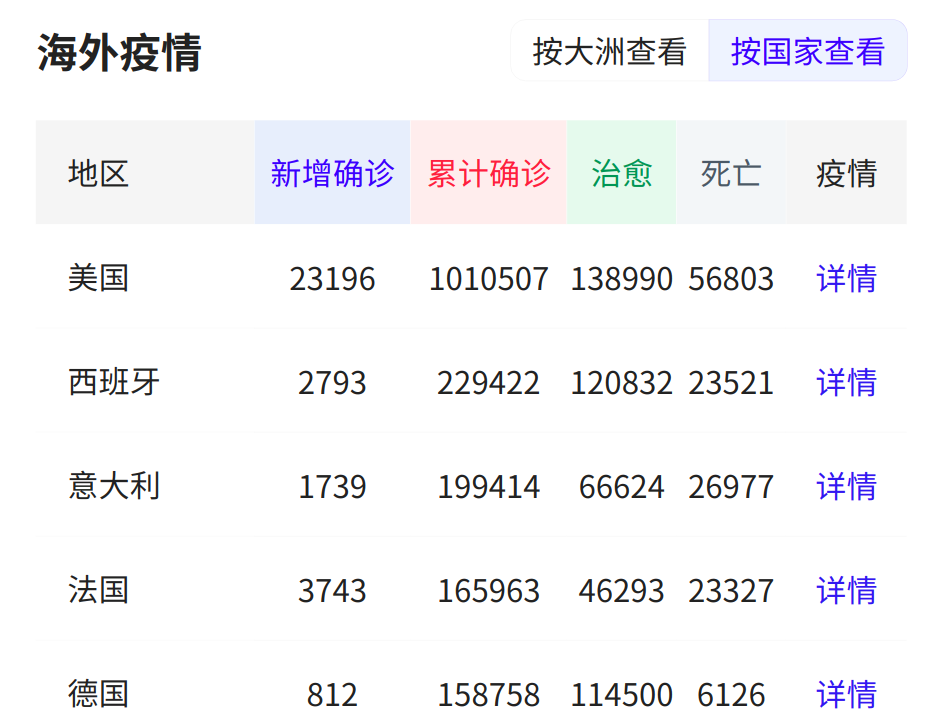
There are many ways to get this information, which can be extracted by expressions or packet analysis. One of my favorite methods is packet analysis.
Right click "check", click the "network" tab and refresh the interface. You can see that a lot of data packages are loaded, and find a list data package that most looks like a list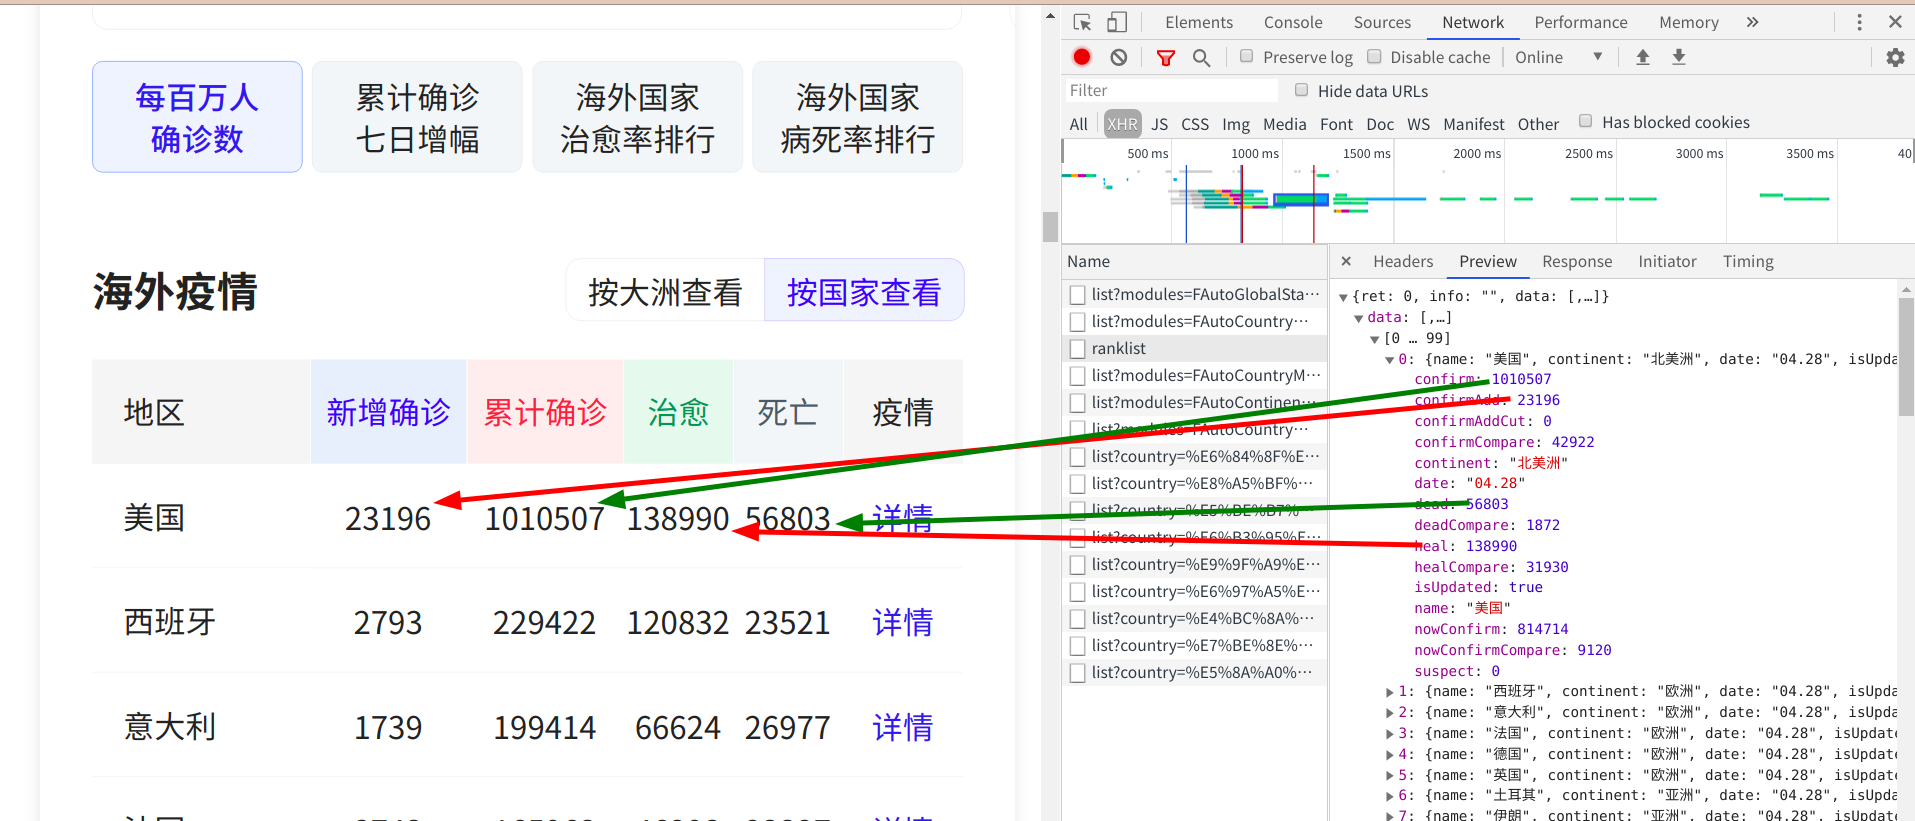
At this time, it is found that this list packet is the data list we want to extract. Each key value pair in it represents the corresponding data. After extracting these key value pairs, we can get all the data information. Back to the headers again, the corresponding URL under the tab is the URL we are about to request. Here we need to note that the corresponding request of this URL is po St instead of get we often use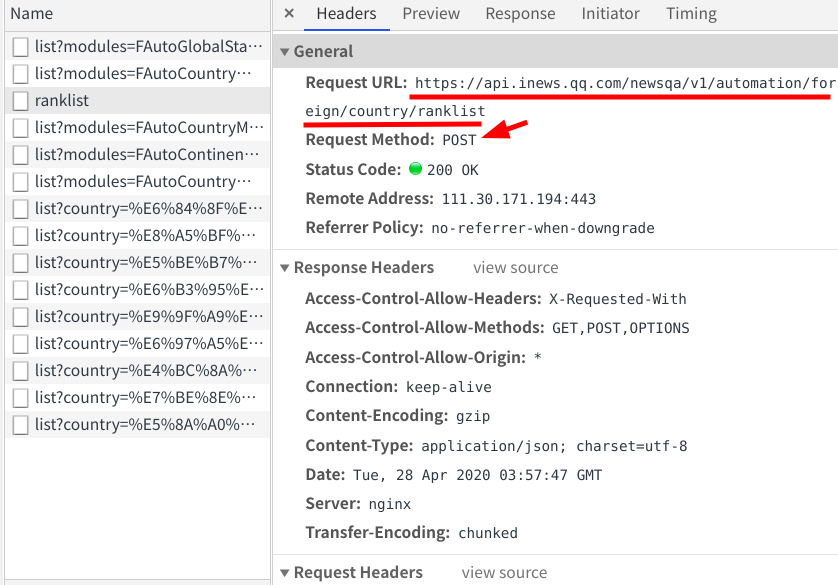
Request data from web page:
import requests

url = 'https://api.inews.qq.com/newsqa/v1/automation/foreign/country/ranklist'
response = requests.post(url).text
print(response)
You can see that there is no anti crawler on this page, so you can easily get data
Extract data
The data format we just requested is character format, which can't be extracted directly by us. We have to convert the data in character format to dictionary format before we can start the next step of extraction
resp = json.loads(response) #Use the resp variable to receive data in dictionary format
After the variables are converted into dictionary format, we should start to extract the data. To extract the data of json type, we can use the method of extracting the list elements. That is, we first traverse the list to extract the information of each country, and then extract the data we want from these pieces of information
Extract data:
import json

resp = json.loads(response)   #Use the resp variable to receive data in dictionary format
for data in resp['data']:  #Traverse to extract epidemic data of each country
    name = data['name']   #Country name
    confirm = data['confirm']   #Number of outbreaks in the country
    print(name,confirm)
Print data: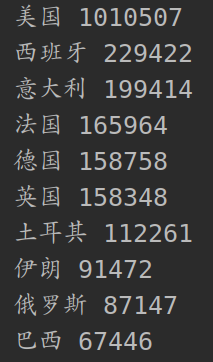
Processing data
After getting the information of the country and the number of people, we need to store the data in the dictionary to transfer it into the chart, which requires us to manually convert the data and store it in the dictionary
map_version = {}  #Define an empty dictionary
for data in resp['data']:  #Traverse to extract epidemic data of each country
    name = data['name']   #Country name
    confirm = data['confirm']   #Number of outbreaks in the country
    map_version[name] = int(confirm)  #Pass the country and number of people into the dictionary as key value pairs
Output Dictionary:
At this time, the printed dictionary is in the standard dictionary format, but this format is not what pyecharts requires, so a line of code is needed for conversion
element = list(map_version.items())
You can then output the standard format of the incoming data:
Making visual maps
After crawling, transforming and sorting out the data, all the preparatory work has been completed. Let's call the data to realize data visualization
Write a preliminary framework to receive the content
from pyecharts.charts import Map,Geo

map = Map().add(series_name="World epidemic distribution map",  #Name
                data_pair=element,   #incoming data
                maptype='world',   #Map type
                )
map.render('map.html')  #Name and save
Run the code and find a map.html file under the current folder. Double click to run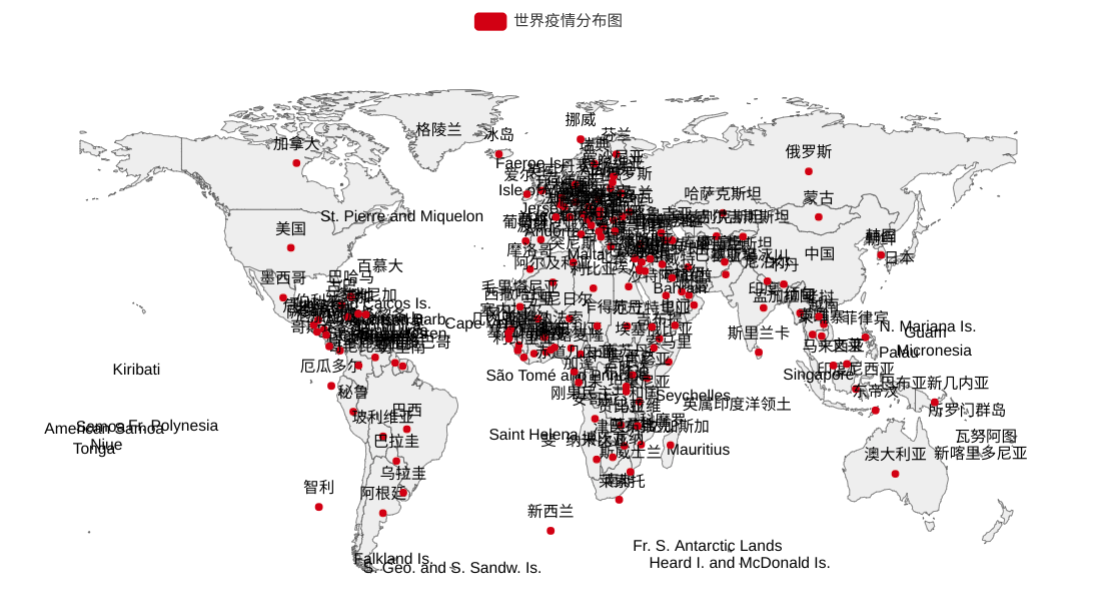
After seeing this chart, I found that the code was running smoothly, but the data was not transferred to the map. This is because the default country name in the world map of pyecharts is English, so we need to pass in a dictionary to replace these English words
Set up visualization map
After the map is generated, the next step is to ensure the correctness and beauty of the map, so we need to set up the world map
Too many country names are displayed on the map, which affects readability, so it is set to not display country names
from pyecharts import options

map.set_series_opts(label_opts=options.LabelOpts(is_show=False))  #Do not display country name
Add different colors to the map according to the number of people infected
#Set global configuration item
map.set_global_opts(visualmap_opts=options.VisualMapOpts(max_=1100000,is_piecewise=True,pieces=[
                 {"min": 500000},
                 {"min": 200000, "max": 499999},
                 {"min": 100000, "max": 199999},
                 {"min": 50000, "max": 99999},
                 {"min": 10000, "max": 49999},
                 {"max": 9999},]))
The dot representing the capital of the country is not beautiful. Remove the red dot:
map = Map().add(
                                    is_map_symbol_show=False,  #Don't show Tags
                                    )
Set the background color and name the page:
map = Map(options.InitOpts(bg_color="#87cefa ", page u title = distribution of world epidemic situation"). add()
By now, all the configurations have been completed, but to display the data in the chart, you need to pass in a dictionary to replace the default English name. For the specific implementation, see the following complete code.
Full code
import requests
import json
from pyecharts.charts import Map
from pyecharts import options

url = 'https://api.inews.qq.com/newsqa/v1/automation/foreign/country/ranklist'
response = requests.post(url).text
resp = json.loads(response)   #Use the resp variable to receive data in dictionary format
map_version = {}  #Define an empty dictionary
for data in resp['data']:  #Traverse to extract epidemic data of each country
    name = data['name']   #Country name
    confirm = data['confirm']   #Number of outbreaks in the country
    map_version[name] = int(confirm)  #Pass the country and number of people into the dictionary as key value pairs
element = list(map_version.items())   #Adjust the dictionary value to a format that can be passed into the map
name_map = {
    'Singapore Rep.': 'Singapore',
    'Dominican Rep.': 'Dominican',
    'Palestine': 'Palestine',
    'Bahamas': 'Bahamas',
    'Timor-Leste': 'Timor-Leste',
    'Afghanistan': 'Afghanistan',
    'Guinea-Bissau': 'Guinea-Bissau',
    "Côte d'Ivoire": 'Cote d'Ivoire',
    'Siachen Glacier': 'Xiyaqin glacier',
    "Br. Indian Ocean Ter.": 'British Indian Ocean Territory',
    'Angola': 'Angola',
    'Albania': 'Albania',
    'United Arab Emirates': 'The United Arab Emirates',
    'Argentina': 'Argentina',
    'Armenia': 'Armenia',
    'French Southern and Antarctic Lands': 'French Southern Hemisphere and Antarctic Territory',
    'Australia': 'Australia',
    'Austria': 'Austria',
    'Azerbaijan': 'Azerbaijan',
    'Burundi': 'burundi',
    'Belgium': 'Belgium',
    'Benin': 'Benin',
    'Burkina Faso': 'burkina faso ',
    'Bangladesh': 'The People's Republic of Bangladesh',
    'Bulgaria': 'Bulgaria',
    'The Bahamas': 'Bahamas',
    'Bosnia and Herz.': 'Bosnia and Herzegovina',
    'Belarus': 'Belarus',
    'Belize': 'Belize ',
    'Bermuda': 'Bermuda',
    'Bolivia': 'bolivia',
    'Brazil': 'Brazil',
    'Brunei': 'Brunei',
    'Bhutan': 'Bhutan',
    'Botswana': 'botswana',
    'Central African Rep.': 'Central African',
    'Canada': 'Canada',
    'Switzerland': 'Switzerland',
    'Chile': 'Chile',
    'China': 'China',
    'Ivory Coast': 'Ivory Coast',
    'Cameroon': 'Cameroon',
    'Dem. Rep. Congo': 'Democratic Republic of Congo',
    'Congo': 'Congo',
    'Colombia': 'Columbia',
    'Costa Rica': 'Costa Rica',
    'Cuba': 'Cuba',
    'N. Cyprus': 'northern cyprus ',
    'Cyprus': 'Cyprus',
    'Czech Rep.': 'Czech',
    'Germany': 'Germany',
    'Djibouti': 'Djibouti',
    'Denmark': 'Denmark',
    'Algeria': 'Algeria',
    'Ecuador': 'Ecuador',
    'Egypt': 'Egypt',
    'Eritrea': 'Eritrea',
    'Spain': 'Spain',
    'Estonia': 'Estonia',
    'Ethiopia': 'Ethiopia',
    'Finland': 'Finland',
    'Fiji': 'Fei',
    'Falkland Islands': 'Falkland Islands',
    'France': 'France',
    'Gabon': 'Gabon',
    'United Kingdom': 'Britain',
    'Georgia': 'Georgia',
    'Ghana': 'Ghana',
    'Guinea': 'Guinea',
    'Gambia': 'Gambia',
    'Guinea Bissau': 'Guinea-Bissau',
    'Eq. Guinea': 'Equatorial Guinea',
    'Greece': 'Greece',
    'Greenland': 'Greenland',
    'Guatemala': 'Guatemala',
    'French Guiana': 'French Guiana',
    'Guyana': 'Guyana',
    'Honduras': 'Honduras',
    'Croatia': 'Croatia',
    'Haiti': 'Haiti',
    'Hungary': 'Hungary',
    'Indonesia': 'Indonesia',
    'India': 'India',
    'Ireland': 'Ireland',
    'Iran': 'Iran',
    'Iraq': 'Iraq',
    'Iceland': 'Iceland',
    'Israel': 'Israel',
    'Italy': 'Italy',
    'Jamaica': 'Jamaica',
    'Jordan': 'Jordan',
    'Japan': 'Japan',
    'Kazakhstan': 'Kazakhstan',
    'Kenya': 'Kenya',
    'Kyrgyzstan': 'Kyrgyzstan',
    'Cambodia': 'Cambodia',
    'Korea': 'The Republic of Korea',
    'Kosovo': 'Kosovo ',
    'Kuwait': 'Kuwait',
    'Lao PDR': 'Laos',
    'Lebanon': 'Lebanon',
    'Liberia': 'Liberia',
    'Libya': 'Libya',
    'Sri Lanka': 'Sri Lanka',
    'Lesotho': 'Lesotho',
    'Lithuania': 'Lithuania',
    'Luxembourg': 'Luxembourg',
    'Latvia': 'Latvia',
    'Morocco': 'Morocco',
    'Moldova': 'Moldova',
    'Madagascar': 'Madagascar',
    'Mexico': 'Mexico',
    'Macedonia': 'Macedonia',
    'Mali': 'Mali',
    'Myanmar': 'Myanmar',
    'Montenegro': 'Montenegro',
    'Mongolia': 'Mongolia',
    'Mozambique': 'Mozambique',
    'Mauritania': 'Mauritania',
    'Malawi': 'Malawi',
    'Malaysia': 'Malaysia',
    'Namibia': 'Namibia',
    'New Caledonia': 'New Caledonia ',
    'Niger': 'Niger',
    'Nigeria': 'Nigeria',
    'Nicaragua': 'Nicaragua',
    'Netherlands': 'Netherlands',
    'Norway': 'Norway',
    'Nepal': 'Nepal',
    'New Zealand': 'New Zealand',
    'Oman': 'Oman',
    'Pakistan': 'Pakistan',
    'Panama': 'Panama',
    'Peru': 'Peru',
    'Philippines': 'the Philippines',
    'Papua New Guinea': 'papua new guinea',
    'Poland': 'poland',
    'Puerto Rico': 'Puerto Rico',
    'Dem. Rep. Korea': 'Korea',
    'Portugal': 'Portugal',
    'Paraguay': 'Paraguay',
    'Qatar': 'Qatar',
    'Romania': 'Romania',
    'Russia': 'Russia',
    'Rwanda': 'Rwanda',
    'W. Sahara': 'Western Sahara',
    'Saudi Arabia': 'Saudi Arabia',
    'Sudan': 'Sultan',
    'S. Sudan': 'South Sudan',
    'Senegal': 'Senegal',
    'Solomon Is.': 'Solomon Islands',
    'Sierra Leone': 'sierra leone',
    'El Salvador': 'El Salvador',
    'Somaliland': 'Somaliland',
    'Somalia': 'Somalia',
    'Serbia': 'Serbia',
    'Suriname': 'Suriname',
    'Slovakia': 'Slovakia',
    'Slovenia': 'Slovenia',
    'Sweden': 'Sweden',
    'Swaziland': 'The Kingdom of eSwatini',
    'Syria': 'Syria',
    'Chad': 'Chad',
    'Togo': 'Togo',
    'Thailand': 'Thailand',
    'Tajikistan': 'Tajikistan',
    'Turkmenistan': 'Turkmenistan',
    'East Timor': 'Timor-Leste',
    'Trinidad and Tobago': 'Trinidad and Tobago ',
    'Tunisia': 'Tunisia',
    'Turkey': 'turkey',
    'Tanzania': 'Tanzania',
    'Uganda': 'Uganda',
    'Ukraine': 'Ukraine',
    'Uruguay': 'Uruguay',
    'United States': 'U.S.A',
    'Uzbekistan': 'Uzbekistan',
    'Venezuela': 'Venezuela',
    'Vietnam': 'Vietnam?',
    'Vanuatu': 'Vanuatu',
    'West Bank': 'West Bank',
    'Yemen': 'Yemen',
    'South Africa': 'South Africa',
    'Zambia': 'Zambia',
    'Zimbabwe': 'zimbabwe',
    'Comoros': 'Comoros'
}

map = Map(options.InitOpts(bg_color="#87cefa ", page u title = 'distribution of world epidemic situation')\
    add(series_name="World epidemic distribution map",  #Name
        data_pair=element,   #incoming data
        is_map_symbol_show=False,  #Don't show Tags
        maptype='world',   #Map type
        name_map=name_map,
        )
#Set global configuration item
map.set_global_opts(visualmap_opts=options.VisualMapOpts(max_=1100000,is_piecewise=True,pieces=[
                 {"min": 500000},
                 {"min": 200000, "max": 499999},
                 {"min": 100000, "max": 199999},
                 {"min": 50000, "max": 99999},
                 {"min": 10000, "max": 49999},
                 {"max": 9999},]))
#Set series configuration items
map.set_series_opts(label_opts=options.LabelOpts(is_show=False))  #Do not display country name
map.render('map.html')  #Name and save
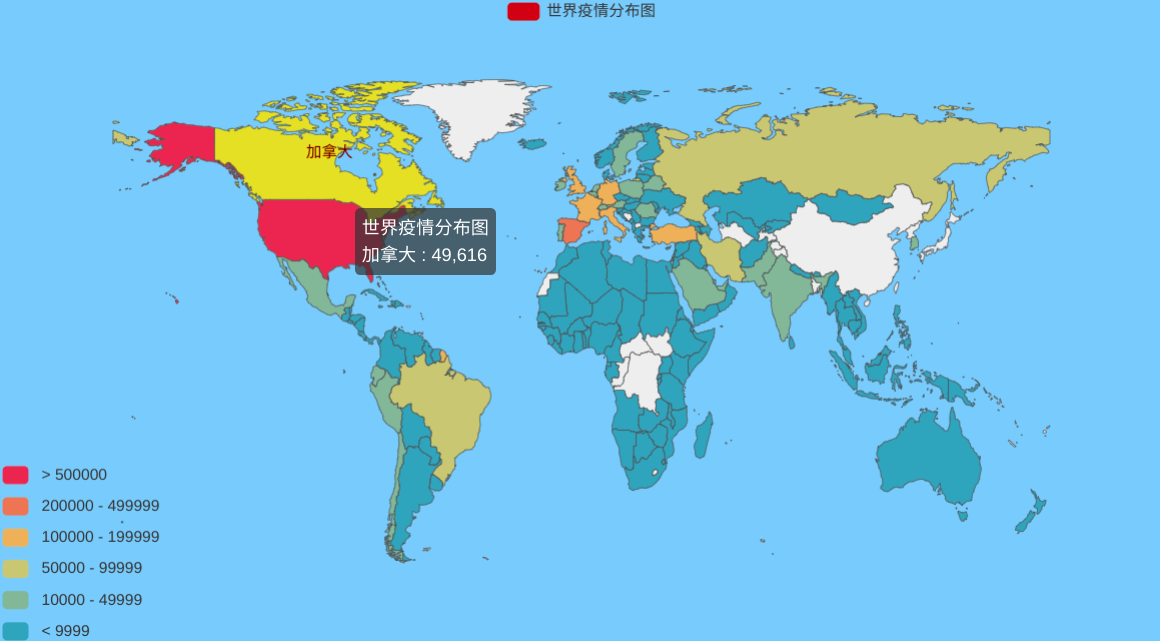
Achieve results
This result can be displayed in the web page dynamically, and the map plate can be filtered according to the number of people, and it is easy to zoom