background
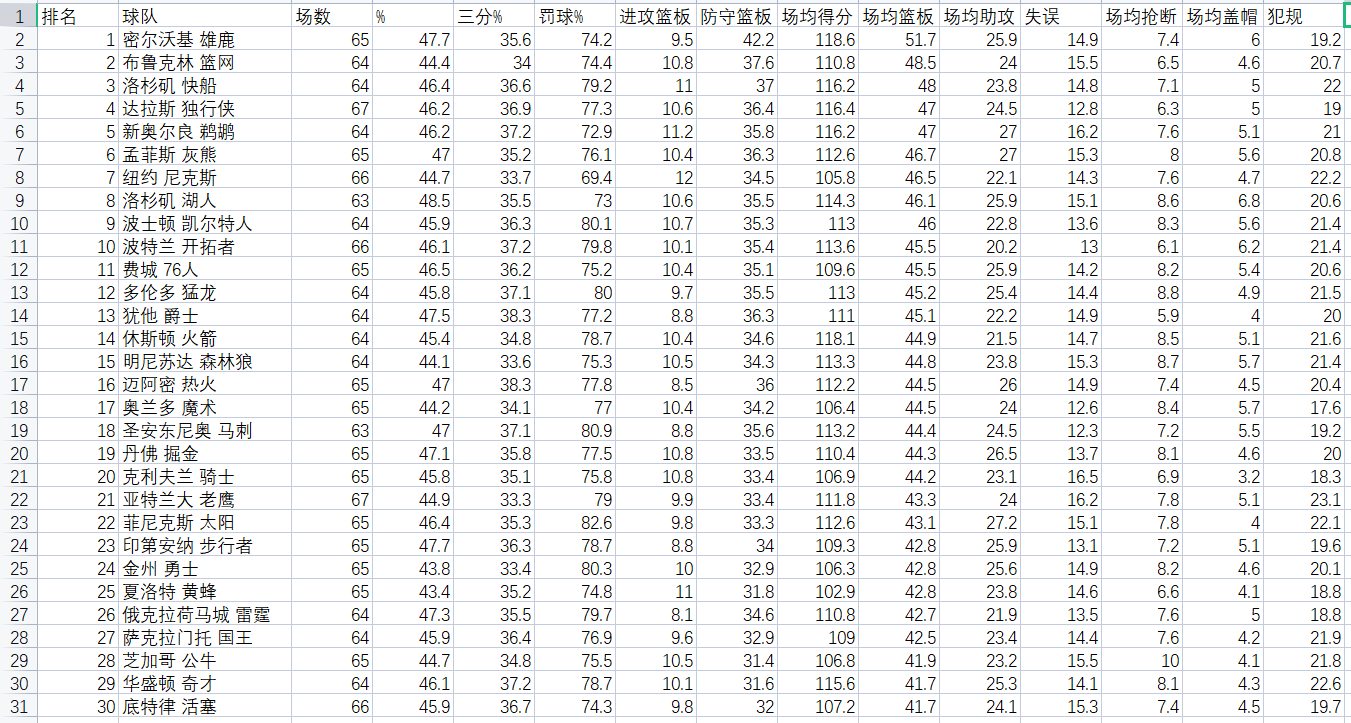
At present, the teams in the NBA regular season are ranked according to the winning rate from high to bottom. This ranking method is very simple and easy to be generally accepted by the public. However, due to the asymmetric cycle of NBA regular season competition system, such ranking rules are not completely fair. Therefore, this paper will try to establish a more reasonable mathematical model of NBA regular season team ranking.
Regular season competition system
The NBA has a total of 30 teams, divided into the Eastern League and the Western League, with 15 teams each. Each league has three divisions and five teams in each division. Based on the distance between the cities where the team is located, the arrangement of 82 regular seasons is as follows:
- Play 2 games with teams in different leagues, 1 home and 1 away (30 in total);
- Play 4 games with teams in the same division, 2 home games each (16 games in total);
- Four teams from different divisions of the same league played three games (a total of 12 games) and six teams played four games (a total of 24 games); among them, the team playing three games was quite different from the team's record last season, and the team was far away, which was arranged by computer.
In the NBA regular season competition system, the number of times each team plays against each other is not the same. There are often teams that lose the game because they unfortunately encounter a strong team many times, and there are few times they encounter a weak team. According to the traditional ranking, the team will be wrongly ranked downstream of the ranking list.
Theoretical basis
The purpose of ranking is to arrange an order reflecting the real level of each team according to the game results. Due to the asymmetric cycle of the NBA regular season competition system, the ranking method from high to bottom lacks a certain fairness. Therefore, this paper attempts to establish a mathematical model of NBA regular season team ranking that can deal with the weight of different games.
Therefore, this paper will establish the mathematical model of NBA regular season team ranking through python according to the principles of competition graph method and analytic hierarchy process.
Here is a reference to this article on football team ranking
data
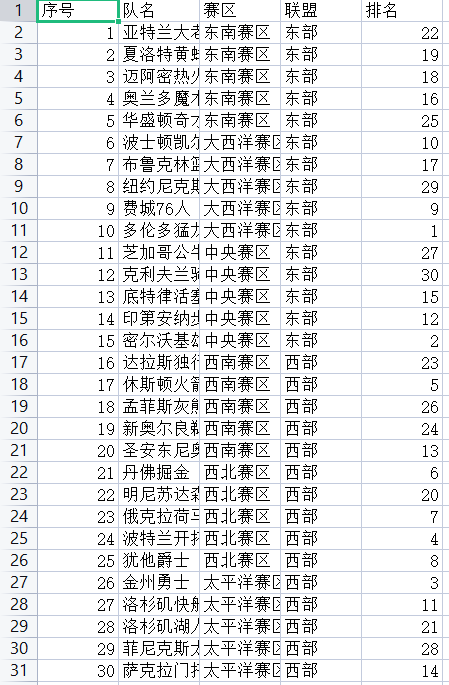
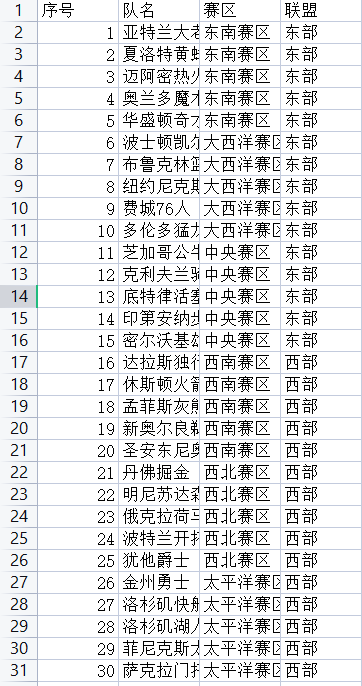
30 team numbers
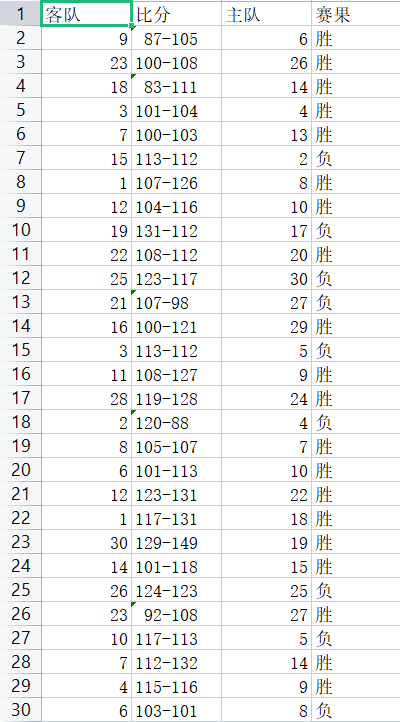
2018-2019 schedule arrangement
code
import numpy as np
import os
import pandas as pd
from pandas import Series,DataFrame


def score(df):
    num = np.zeros([30,30])  # Match number matrix
    score = np.zeros([30,30])  # Cumulative score matrix
    win_score = np.zeros([30,30])  # Victory score matrix
    # Fill in the above three matrices according to each game
    for i in range(len(df)):
        x = df['visiting team'][i]-1
        y = df['home team'][i]-1
        num[x][y] += 1  # Increase the number of games per round
        num[y][x] += 1
        a = int(df['score'][i].split('-')[1])-int(df['score'][i].split('-')[0])
        if(df['Sai Guo'][i]=='win'):
            win_score[y][x] += 1    # Increase the number of winners
            win_score[x][y] -= 1
            score[y][x] += a  # How many points have you won
            score[x][y] -= a

        if(df['Sai Guo'][i]=='negative'):
            win_score[y][x] -= 1
            win_score[x][y] += 1
            score[y][x] += a
            score[x][y] -= a

    for i in range(len(score)):
        for j in range(len(score)):
            if (win_score[i][j]>0):
                win_score[i][j] = 2 * win_score[i][j]   # 2 points for a clear win
                if(score[i][j]/num[i][j] > 15):   # Win an average of more than 15 points per game and increase the victory score by 1 point
                    win_score[i][j] += 1


    for i in range(len(score)):
        for j in range(len(score)):
            if(i == j):
                win_score[i][j] = 1  # Mark yourself as 1
            if (win_score[i][j] < 0):
                win_score[i][j] = 1 / win_score[j][i]   # A negative number is the reciprocal of a positive number
            if (win_score[i][j] == 0):  # In other cases, the two teams win or lose each other, which is recorded as 1
                win_score[i][j] = 1


    return win_score


def normalization(data):  # Normalized matrix
    _range = np.max(data) - np.min(data)
    return (data - np.min(data)) / _range


def final_score(win_score0):  # Get the final score matrix
    for i in range(len(win_score0)):
        win_score0[:,i] = normalization(win_score0[:,i])

    final_score = np.zeros(30)
    for i in range(len(final_score)):
        final_score[i] = win_score0[i,:].sum()

    return final_score


def rank(df0,final_score):  # According to the final score matrix, the teams are ranked by serial number
    df_fianl = df0
    df_fianl['ranking'] = 0
    rank = np.argsort(final_score)
    for i in range(0,len(rank)):
        df_fianl['ranking'][rank[i]] = 30-i

    return df_fianl


if __name__ == '__main__':
    # Import data
    file=os.path.dirname(os.path.abspath('__file__'))#Directory of return code
    data_file=os.path.join(file,'2018-2019 Schedule arrangement.csv')#Returns the file location of the data
    df=pd.read_csv(data_file,engine='python',encoding='gbk')
    data_file=os.path.join(file,'30 Team numbers.csv')#Returns the file location of the data
    df0=pd.read_csv(data_file,engine='python',encoding='gbk')

    #Get the fractional matrix
    win_score = score(df)


    #Get the final score of the team
    final_score = final_score(win_score)

    #Get the final ranking of the team
    df_fianl = rank(df0,final_score)

    #Export final ranking table
    if(os.path.exists(os.path.join(file,'Analytic hierarchy process 2019.csv'))):#If the output result table already exists, delete it
        os.remove(os.path.join(file,'Analytic hierarchy process 2019.csv'))
    df_fianl.to_csv('Analytic hierarchy process 2019.csv',index=False,encoding='gbk') #Remove the index and output the table csv
result