Author: Super onion 806
Source: https://blog.csdn.net/u014779536/article/details/108182833
Hello, I'm Ango!
Today, I'd like to share a Python automated office dry goods, which is very dry and can be tasted carefully
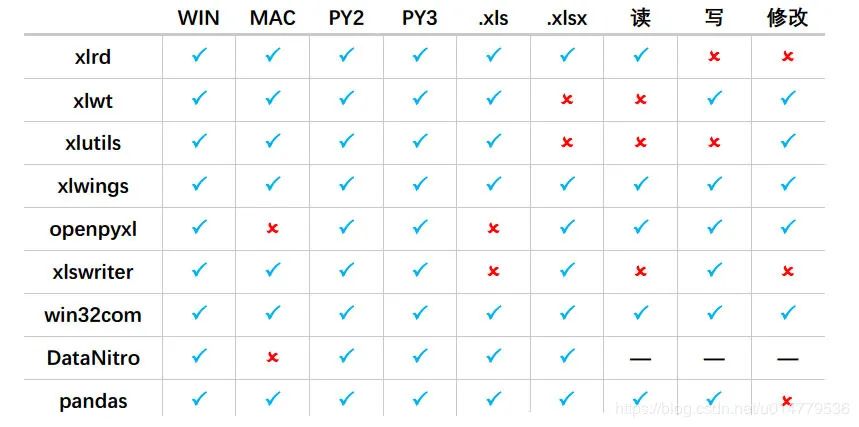
0. Python Excel library comparison
Let's take a look at the comparison of libraries that can operate Excel in python (nine libraries in total):
1. Python xlrd reading Excel
1.1 xlrd module introduction
(1) What is the xlrd module?
- python mainly uses xlrd and xlwt to operate excel, that is, xlrd is to read excel and xlwt is to write excel.
(2) Why use xlrd module?
- In UI automation or interface automation, data maintenance is a core, so this module is very practical.
xlrd module can be used to read Excel data, very fast, recommended!
Official documents: https://xlrd.readthedocs.io/en/latest/
1.2 installing xlrd modules
- Download from Python official website http://pypi.python.org/pypi/xlrd Module installation, provided that the python environment has been installed.
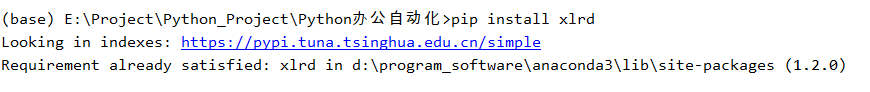
- Or pip install xlrd in the cmd window
pip install xlrd
anaconda comes with xlrd, so you will be prompted that it has been installed:
1.3 introduction to use
- Data type of common cells
- empty
- string(text)
- number
- date
- boolean
- error
- Blank (blank form)
- Import module
import xlrd
- Open Excel file to read data
data = xlrd.open_workbook(filename)#File name and path. If the path or file name has Chinese, add an r before it
- Common functions
- The most important method in excel is the operation of book and sheet
(1) Get a worksheet in book (excel file)
table = data.sheets()[0]             #Get by index order
table = data.sheet_by_index(sheet_indx)  #Get by index order
table = data.sheet_by_name(sheet_name)  #Get by name

# The above three functions will return an xlrd.sheet.Sheet() object

names = data.sheet_names()        #Returns the names of all worksheets in the book
data.sheet_loaded(sheet_name or indx)    # Check whether a sheet has been imported
(2) Operation of row
nrows = table.nrows
    # Get the number of rows in the sheet. Note: table.nrows is not followed by ()

table.row(rowx)
    # Returns a list of all cell objects in the row, which is no different from the tower. Raw () method.

table.row_slice(rowx)
    # Returns a list of all cell objects in the row

table.row_types(rowx, start_colx=0, end_colx=None)
    # Returns a list consisting of the data types of all cells in the row;
    # The return value is a list of logical values. If the type is empty, it is 0; otherwise, it is 1

table.row_values(rowx, start_colx=0, end_colx=None)
    # Returns a list of data from all cells in the row

table.row_len(rowx)
    # Returns the effective cell length of the row, that is, how many data there are in this row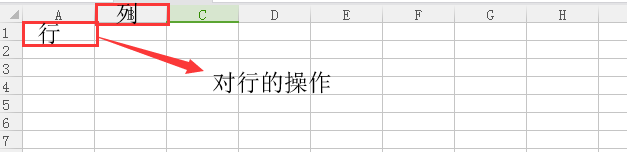
(3) Operation of column (colnum)
ncols = table.ncols
    # Gets the number of valid columns for the list

table.col(colx, start_rowx=0, end_rowx=None)
    # Returns a list of all cell objects in the column

table.col_slice(colx, start_rowx=0, end_rowx=None)
    # Returns a list of all cell objects in the column

table.col_types(colx, start_rowx=0, end_rowx=None)
    # Returns a list of the data types of all cells in the column

table.col_values(colx, start_rowx=0, end_rowx=None)
    # Returns a list of data from all cells in the column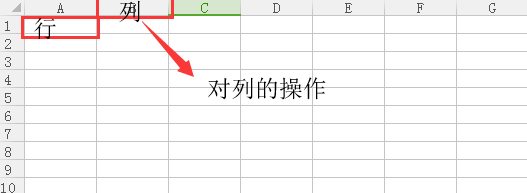
(4) Operation of cell
table.cell(rowx,colx)
    # Return cell object

table.cell_type(rowx,colx)
    # Returns the data type in the corresponding location cell

table.cell_value(rowx,colx)
    # Returns the data in the corresponding position cell
1.4 practical training
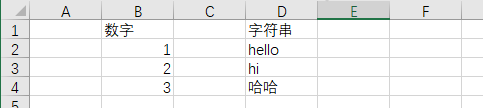
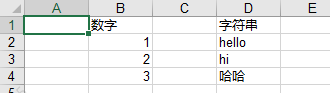
We first put the following data in the table and click Save:
Read using xlrd module:
import xlrd
xlsx = xlrd.open_workbook('./3_1 xlrd Reading operation exercise.xlsx')
# Find by sheet name: xlsx.sheet_by_name("sheet1")
# Find by index: xlsx.sheet_by_index(3)
table = xlsx.sheet_by_index(0)
# Getting a single table value (2,1) means getting the value of the cell in row 3 and column 2
value = table.cell_value(2, 1)
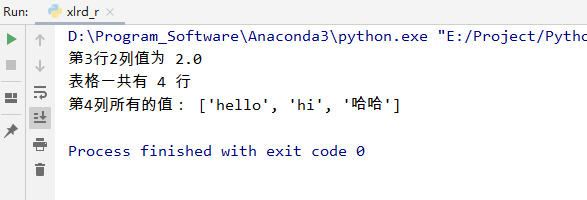
print("The value in row 3 and column 2 is",value)
# Get the number of table rows
nrows = table.nrows
print("There are two forms in total",nrows,"that 's ok")
# Get all the values in column 4 (list generator)
name_list = [str(table.cell_value(i, 3)) for i in range(1, nrows)]
print("All values in column 4:",name_list)Print results:
Introduction to list generation:
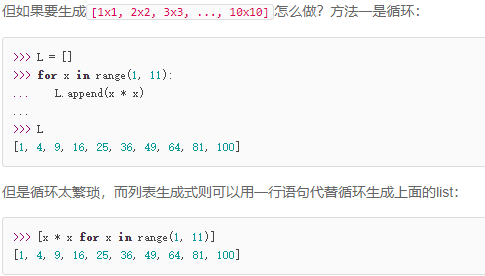
List generated learning link:
https://www.liaoxuefeng.com/wiki/1016959663602400/1017317609699776
2. Python xlwt write operation Excel (xls format only!)
xlwt can be used to write a new Excel table or modify it based on the original table. It is also fast. It is recommended!
Official documents: https://xlwt.readthedocs.io/en/latest/
2.1 pip installation xlwt
pip install xlwt
anaconda comes with xlwt, so it is prompted that it has been installed:

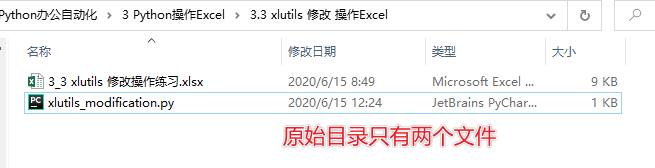
2.2 create a new table using xlwt and write
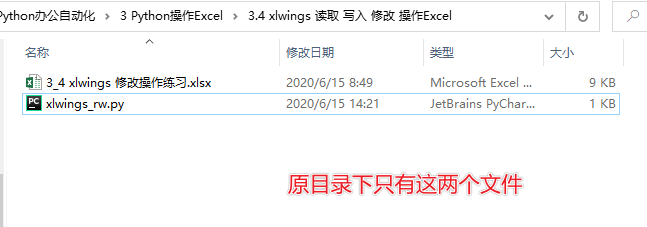
At first, there were only these two files in the directory:
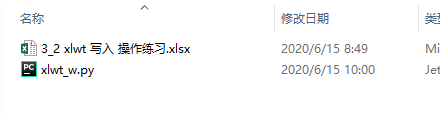
Write xlwt a new table writer:
# 3.2.2 create a new table using xlwt and write
def fun3_2_2():
# Create a new workbook (in fact, create a new excel)
workbook = xlwt.Workbook(encoding= 'ascii')
# Create a new sheet table
worksheet = workbook.add_sheet("My new Sheet")
# Write content to table
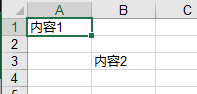
worksheet.write(0,0, "Content 1")
worksheet.write(2,1, "Content 2")
# preservation
workbook.save("Newly created table.xls")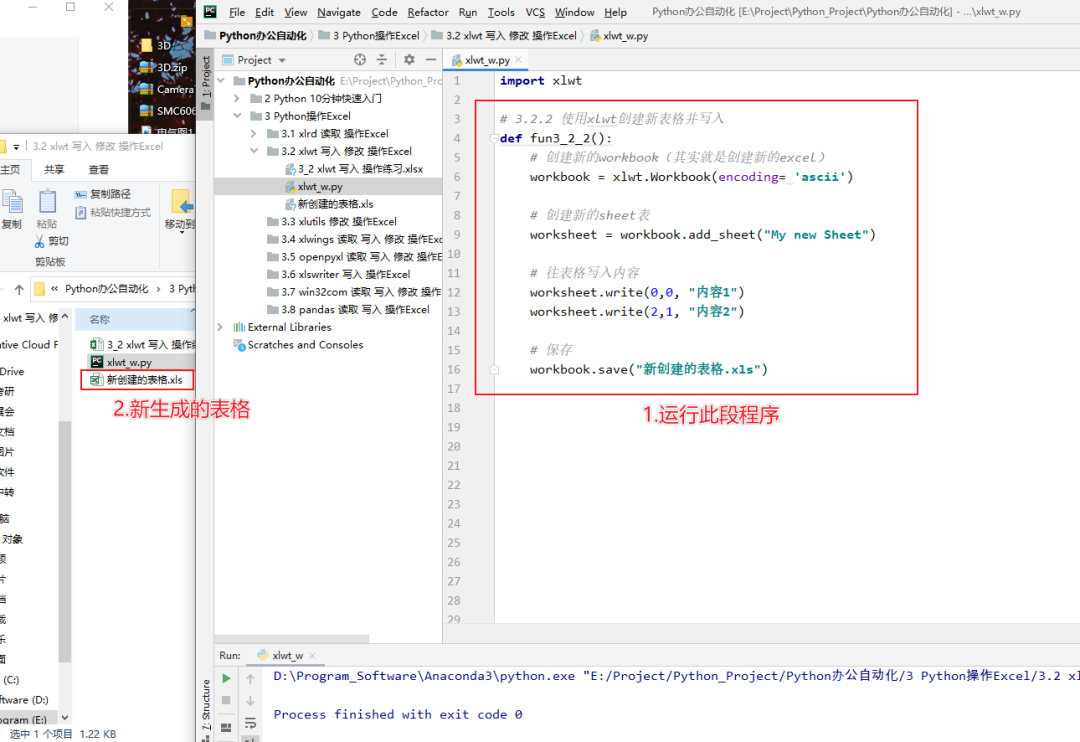
The table generated is as follows:
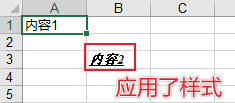
2.3 xlwt setting font format
Program example:
# 3.2.3 xlwt setting font format
def fun3_2_3():
    # Create a new workbook (in fact, create a new excel)
    workbook = xlwt.Workbook(encoding= 'ascii')

    # Create a new sheet table
    worksheet = workbook.add_sheet("My new Sheet")

    # Initialize style
    style = xlwt.XFStyle()

    # Create fonts for styles
    font = xlwt.Font()
    font.name = 'Times New Roman'   #typeface
    font.bold = True                #Bold
    font.underline = True           #Underline
    font.italic = True              #Italics

    # Set style
    style.font = font

    # Write content to table
    worksheet.write(0,0, "Content 1")
    worksheet.write(2,1, "Content 2",style)

    # preservation
    workbook.save("Newly created table.xls")
The effects are as follows:
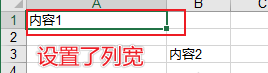
2.4 xlwt set column width
The value representation of column width in xlwt: 1 / 256 of the default font 0 is the measurement unit.
The default width used when xlwt is created is 2960, which is the width of 11 characters 0
Therefore, we can use the following methods when setting the column width:
width = 256 * 20 256 is the measurement unit, and 20 represents the width of 20 characters
Program example:
# 3.2.4 setting column width
def fun3_2_4():
    # Create a new workbook (in fact, create a new excel)
    workbook = xlwt.Workbook(encoding= 'ascii')

    # Create a new sheet table
    worksheet = workbook.add_sheet("My new Sheet")

    # Write content to table
    worksheet.write(0,0, "Content 1")
    worksheet.write(2,1, "Content 2")

    # Set column width
    worksheet.col(0).width = 256*20

    # preservation
    workbook.save("Newly created table.xls")
The effects are as follows:
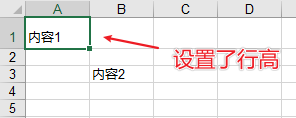
2.5 xlwt set row height
There is no specific function in xlwt to set the default column width and row height
The row height is set in the cell style. You can determine the row height by automatically wrapping and entering the amount of text
Program example:
# 3.2.5 set row height
def fun3_2_5():
    # Create a new workbook (in fact, create a new excel)
    workbook = xlwt.Workbook(encoding= 'ascii')

    # Create a new sheet table
    worksheet = workbook.add_sheet("My new Sheet")

    # Write content to table
    worksheet.write(0,0, "Content 1")
    worksheet.write(2,1, "Content 2")

    # Set row height
    style = xlwt.easyxf('font:height 360;')  # 18pt, type: small initial font size
    row = worksheet.row(0)
    row.set_style(style)

    # preservation
    workbook.save("Newly created table.xls")
The effects are as follows:
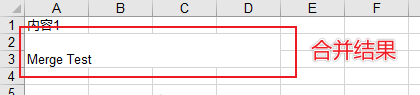
2.6 xlwt merge columns and rows
Program example:
# 3.2.6 combination, parallel and row
def fun3_2_6():
    # Create a new workbook (in fact, create a new excel)
    workbook = xlwt.Workbook(encoding= 'ascii')

    # Create a new sheet table
    worksheet = workbook.add_sheet("My new Sheet")

    # Write content to table
    worksheet.write(0,0, "Content 1")

    # Merge columns 0 to 3 of rows 1 to 2
    worksheet.write_merge(1, 2, 0, 3, 'Merge Test')

    # preservation
    workbook.save("Newly created table.xls")
The effects are as follows:
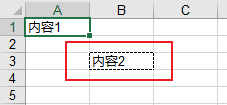
2.7 xlwt add border
Program example:
# 3.2.7 add border
def fun3_2_7():
    # Create a new workbook (in fact, create a new excel)
    workbook = xlwt.Workbook(encoding= 'ascii')

    # Create a new sheet table
    worksheet = workbook.add_sheet("My new Sheet")

    # Write content to table
    worksheet.write(0,0, "Content 1")

    # Set border style
    borders = xlwt.Borders()  # Create Borders

    # May be:   NO_LINE, THIN, MEDIUM, DASHED, DOTTED, THICK, DOUBLE, HAIR,
    #           MEDIUM_DASHED, THIN_DASH_DOTTED, MEDIUM_DASH_DOTTED, THIN_DASH_DOT_DOTTED,
    #           MEDIUM_DASH_DOT_DOTTED, SLANTED_MEDIUM_DASH_DOTTED, or 0x00 through 0x0D.
    # DASHED dotted line
    # NO_LINE no
    # THIN solid line

    borders.left = xlwt.Borders.DASHED
    borders.right = xlwt.Borders.DASHED
    borders.top = xlwt.Borders.DASHED
    borders.bottom = xlwt.Borders.DASHED
    borders.left_colour = 0x40
    borders.right_colour = 0x40
    borders.top_colour = 0x40
    borders.bottom_colour = 0x40

    style = xlwt.XFStyle()  # Create Style
    style.borders = borders  # Add Borders to Style

    worksheet.write(0, 0, 'Content 1', style)

    worksheet.write(2,1, "Content 2")

    # preservation
    workbook.save("Newly created table.xls")
The effects are as follows:
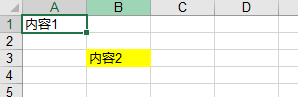
2.8 xlwt setting the background color for cells
Program example:
# Set cell background color
def fun3_2_8():
    # Create a new workbook (in fact, create a new excel)
    workbook = xlwt.Workbook(encoding= 'ascii')

    # Create a new sheet table
    worksheet = workbook.add_sheet("My new Sheet")

    # Write content to table
    worksheet.write(0,0, "Content 1")

    # create patterns
    pattern = xlwt.Pattern()

    # May be: NO_PATTERN, SOLID_PATTERN, or 0x00 through 0x12
    pattern.pattern = xlwt.Pattern.SOLID_PATTERN

    # May be: 8 through 63. 0 = Black, 1 = White, 2 = Red, 3 = Green, 4 = Blue, 5 = Yellow,
    # 6 = Magenta, 7 = Cyan, 16 = Maroon, 17 = Dark Green, 18 = Dark Blue, 19 = Dark Yellow ,
    # almost brown), 20 = Dark Magenta, 21 = Teal, 22 = Light Gray, 23 = Dark Gray, the list goes on...
    pattern.pattern_fore_colour = 5
    style = xlwt.XFStyle()
    style.pattern = pattern

    # Use style
    worksheet.write(2,1, "Content 2",style)
The effects are as follows:
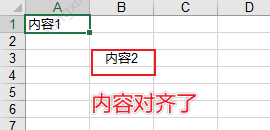
2.9 xlwt setting cell alignment
Use Alignment in xlwt to set the Alignment of cells, where horz represents horizontal Alignment and vert represents vertical Alignment.
VERT_TOP = 0x00 top alignment VERT_CENTER = 0x01 center alignment (vertical) VERT_BOTTOM = 0x02 low end alignment HORZ_LEFT = 0x01 left end alignment HORZ_CENTER = 0x02 center alignment (horizontal) HORZ_RIGHT = 0x03 right end alignment
Program example:
# Set cell alignment
def fun3_2_9():
    # Create a new workbook (in fact, create a new excel)
    workbook = xlwt.Workbook(encoding= 'ascii')

    # Create a new sheet table
    worksheet = workbook.add_sheet("My new Sheet")

    # Write content to table
    worksheet.write(0,0, "Content 1")

    # Set style
    style = xlwt.XFStyle()
    al = xlwt.Alignment()
    # VERT_TOP = 0x00 top alignment
    # VERT_CENTER = 0x01 center alignment (vertical)
    # VERT_BOTTOM = 0x02 low end alignment
    # HORZ_LEFT = 0x01 left end alignment
    # HORZ_CENTER = 0x02 center alignment (horizontal)
    # HORZ_RIGHT = 0x03 right end alignment
    al.horz = 0x02  # Set horizontal center
    al.vert = 0x01  # Set vertical center
    style.alignment = al

    # Align write
    worksheet.write(2,1, "Content 2",style)

    # preservation
    workbook.save("Newly created table.xls")
The effects are as follows:
3. Python xlutils modify Excel
xlutils can be used to copy or modify the original excel and save it;
Official documents: https://xlutils.readthedocs.io/en/latest/
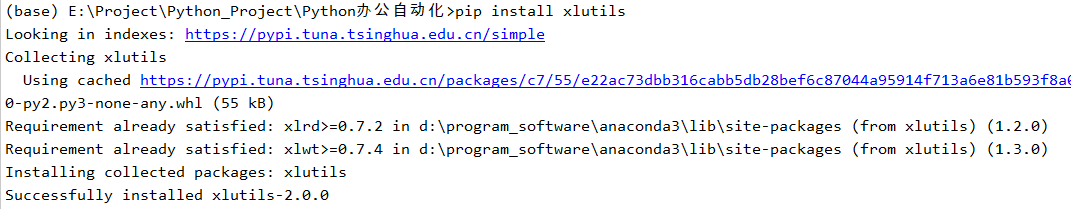
3.1 pip installation xlutils
pip install xlutils
Installation process:
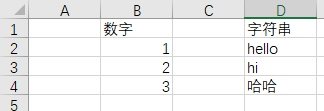
3.2 xlutils copy source files (to be used with xlrd)
The table reads as follows:
Program example:
# 3.3.2 copy source files
def fun3_3_2():
    workbook = xlrd.open_workbook('3_3 xlutils Modify operation exercise.xlsx')  # Open workbook
    new_workbook = copy(workbook)  # Convert xlrd object copy to xlwt object
    new_workbook.save("new_test.xls")  # Save Workbook
The effects are as follows:

The content is:
However, the style of the table has all disappeared.
3.3 xlutils reading and writing (i.e. modifying) Excel table information
Program example:
# 3.3.3 xlutils reading and writing Excel table information
def fun3_3_3():
# file_path: file path, including the full name of the file
# formatting_info=True: keep the original format of Excel (use xlsx file)
workbook = xlrd.open_workbook('3_3 xlutils Modify operation exercise.xlsx')
new_workbook = copy(workbook) # Convert xlrd object copy to xlwt object
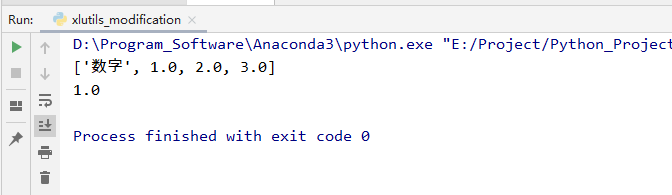
# Read table information
sheet = workbook.sheet_by_index(0)
col2 = sheet.col_values(1) # Take out the second column
cel_value = sheet.cell_value(1, 1)
print(col2)
print(cel_value)
# Write table information
write_save = new_workbook.get_sheet(0)
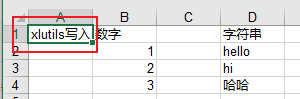
write_save.write(0, 0, "xlutils write in!")
new_workbook.save("new_test.xls") # Save WorkbookThe effects are as follows:
The source file information is copied and appended:
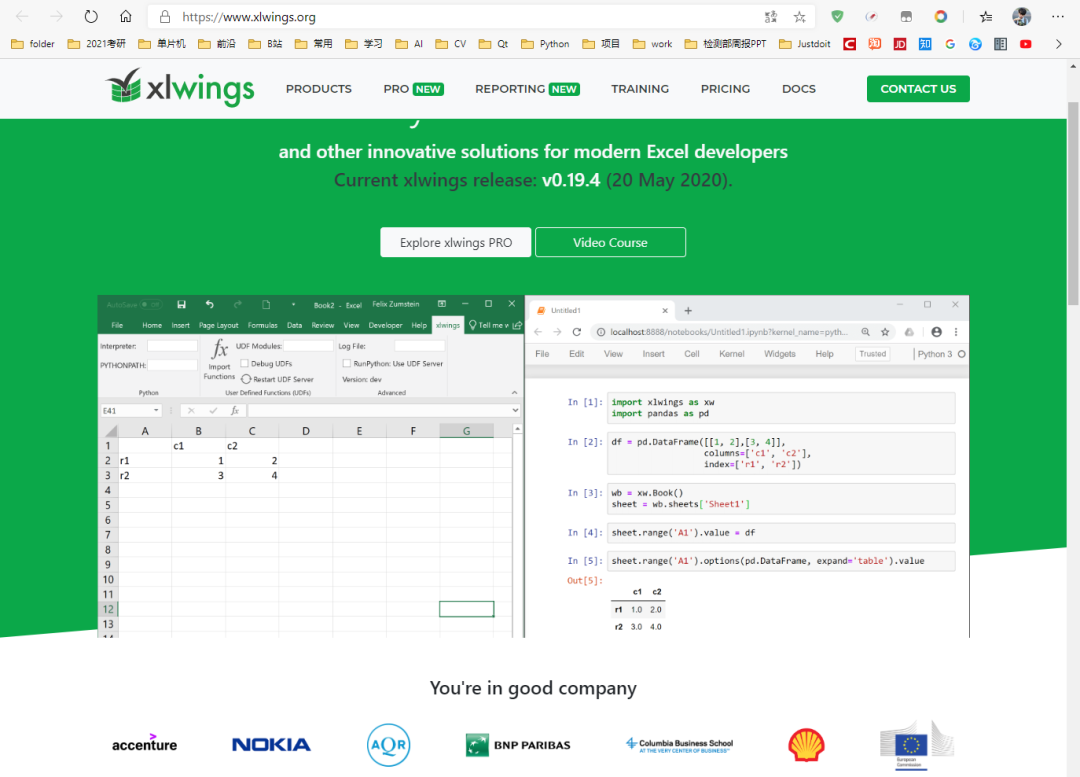
4. Python xlwings read write modify Excel
xlwings is more luxurious than xlrd, xlwt and xlutils. It has the following characteristics:
- xlwings can easily read and write the data in Excel files, and can modify the cell format
- It can be seamlessly connected with matplotlib and pandas, supports reading and writing numpy and pandas data types, and imports matplotlib visual charts into excel.
- You can call the program written by VBA in Excel file or let VBA call the program written in Python.
- Open source, free, constantly updated
Official website address: https://www.xlwings.org/
Official documents: https://docs.xlwings.org/en/stable/api.html

4.1 pip installation xlwings
pip install xlwings
4.2 basic operation
Import and warehousing
import xlwings as xw
Open Excel program, default setting: the program is visible, only open without creating a new workbook
app = xw.App(visible=True,add_book=False)
#Create a new Workbook (if you don't pick up the next code, Excel will only flash by and sell it)
wb = app.books.add()
Open an existing Workbook (absolute and relative paths are supported)
wb = app.books.open('example.xlsx')
#When practicing, it is recommended to use the following one directly
#wb = xw.Book('example.xlsx')
#In this way, you will not open new Excel frequently
Save Workbook
wb.save('example.xlsx')Exit Workbook (can be omitted)
wb.close()
Exit Excel
app.quit()
Three examples:
(1) Open an existing Excel document
# Import xlwings module
import xlwings as xw

# Open Excel program, default setting: the program is visible, only open without creating a new workbook, and screen update is closed
app=xw.App(visible=True,add_book=False)
app.display_alerts=False
app.screen_updating=False

# File location: filepath, open the test document, then save, close and end the program
filepath=r'g:\Python Scripts\test.xlsx'
wb=app.books.open(filepath)
wb.save()
wb.close()
app.quit()
(2) Create a new Excel document named test.xlsx and save it in disk D
import xlwings as xw

app=xw.App(visible=True,add_book=False)
wb=app.books.add()
wb.save(r'd:\test.xlsx')
wb.close()
app.quit()
(3) Enter a value in the cell
Create a new test.xlsx, enter "life" in the first cell of sheet1, then save, close and exit the Excel program.
 import xlwings as xw

 app=xw.App(visible=True,add_book=False)
 wb=app.books.add()

 # wb is the new workbook. Next, assign a value to cell A1 of sheet1 of wb
 wb.sheets['sheet1'].range('A1').value='life'
 wb.save(r'd:\test.xlsx')
 wb.close()
 app.quit()
Open the saved test.xlsx, enter "bitter short" in the second cell of sheet2, then save and close, and exit the Excel program
 import xlwings as xw

 app=xw.App(visible=True,add_book=False)
 wb=app.books.open(r'd:\test.xlsx')

 # wb is the new workbook. Next, assign a value to cell A1 of sheet1 of wb
 wb.sheets['sheet1'].range('A1').value='Bitter short'
 wb.save()
 wb.close()
 app.quit()
After mastering the above codes, you can store excel as a txt text, or read the data of Excel file, calculate and save the results in Excel.
4.3 reference workbooks, worksheets and cells
(1) Reference the workbook by name. Note that the workbook should be opened first
wb=xw.books['The name of the workbook']
(2) Reference active workbook
wb=xw.books.active
(3) Reference sheet in Workbook
sht=xw.books['The name of the workbook'].sheets['sheet Name of']
# perhaps
wb=xw.books['The name of the workbook']
sht=wb.sheets[sheet Name of]
(4) Reference active sheet
sht=xw.sheets.active
(5) Reference A1 cell
rng=xw.books['The name of the workbook'].sheets['sheet Name of']
# perhaps
sht=xw.books['The name of the workbook'].sheets['sheet Name of']
rng=sht.range('A1')
(6) References a cell on the active sheet
# Note that Range is capitalized
rng=xw.Range('A1')

#Note that the full reference path of the cell is:
# The first cell of the first sheet of the first Workbook of the first Excel program
xw.apps[0].books[0].sheets[0].range('A1')
The way to quickly reference cells is
sht=xw.books['name'].sheets['name']

# A1 cell
rng=sht['A1']

# A1:B5 cell
rng=sht['A1:B5']

# In row i+1, the cell in column j+1
# B1 cell
rng=sht[0,1]

# A1:J10
rng=sht[:10,:10]

#PS: cells can also be referenced by tuple s representing rows and columns
# A1 cell reference
xw.Range(1,1)

#A1:C3 cell reference
xw.Range((1,1),(3,3))
Reference cell:
rng = sht.range('a1')
#rng = sht['a1']
#rng = sht[0,0] the first column of the first row, i.e. a1, is equivalent to the slice of pandas
Reference area:
rng = sht.range('a1:a5')
#rng = sht['a1:a5']
#rng = sht[:5,0]
4.4 write & read data
1. Write data
(1) Select the starting cell A1 and write the string 'Hello'
sht.range('a1').value = 'Hello'(2) Write list
# Row storage: store the list [1,2,3] in A1: C1
sht.range('A1').value=[1,2,3]
# Column storage: store the list [1,2,3] in A1:A3
sht.range('A1').options(transpose=True).value=[1,2,3]
# Store the 2x2 table, that is, the two-dimensional array, in A1:B2, such as the first row 1 and 2 and the second row 3 and 4
sht.range('A1').options(expand='table')=[[1,2],[3,4]]- Insert by line by default: A1:D1 write 1, 2, 3 and 4 respectively
sht.range('a1').value = [1,2,3,4]Equivalent to
sht.range('a1:d1').value = [1,2,3,4]- Insert by column: A2:A5 write 5, 6, 7 and 8 respectively
You might think:
sht.range('a2:a5').value = [5,6,7,8]However, you will find that xlwings will still be processed by line. The above line is equivalent to:
sht.range('a2').value = [5,6,7,8]Correct syntax:
sht.range('a2').options(transpose=True).value = [5,6,7,8]Since the default is to write by line, we will reverse it. The word should be typed correctly. If you type the wrong word, it will not report an error, but will write by the default line (don't ask me how to know)
- Multi line input requires a two-dimensional list:
sht.range('a6').expand('table').value = [['a','b','c'],['d','e','f'],['g','h','i']]2. Read data
(1) Read a single value
# Read the value of A1 into the a variable
a=sht.range('A1').value
(2) Read values into the list
#Read the values from A1 to A2 into the a list
a=sht.range('A1:A2').value
# Read the data of the first and second rows as a two-dimensional array
a=sht.range('A1:B2').value- Select a column of data
Calculate the number of rows of the cell first (if there are consecutive cells)
rng = sht.range('a1').expand('table')
nrows = rng.rows.count
Then it can be read according to the accurate range
a = sht.range(f'a1:a{nrows}').value- Select a row of data
ncols = rng.columns.count
#Slice with
fst_col = sht[0,:ncols].value
4.5 common functions and methods
1. Common APIs for book workbooks
wb=xw.books['Workbook name']
- wb.activate() activates as the current workbook
- wb.fullname returns the absolute path of the workbook
- wb.name returns the name of the workbook
- wb.save(path=None) saves the workbook. The default path is the original path of the workbook. If it is not saved, it is the path where the script is located
- wb. close() closes the workbook
Code example:
# Reference the current workbook in the Excel program
wb=xw.books.acitve
# Returns the absolute path of the workbook
x=wb.fullname
# Returns the name of the workbook
x=wb.name
# When saving a workbook, the default path is the original path of the workbook. If it is not saved, it is the path where the script is located
x=wb.save(path=None)
# Close Workbook
x=wb.close()
2. Common api of sheet
# Reference a specified sheet
sht=xw.books['Workbook name'].sheets['sheet Name of']
# Activate sheet as the active sheet
sht.activate()
# Clear the contents and format of the sheet
sht.clear()
# Clear the contents of sheet
sht.contents()
# Gets the name of the sheet
sht.name
# Delete sheet
sht.delete
3. Common APIs of range
# Cell referencing the currently active sheet
rng=xw.Range('A1')
# Add hyperlink
# rng.add_hyperlink(r'www.baidu.com', 'Baidu', 'Tip: Click to link to Baidu')
# Get the address of the current range
rng.address
rng.get_address()
# Clear the contents of range
rng.clear_contents()
# Clear formatting and content
rng.clear()
# Get the background color of range and return the RGB value in tuple form
rng.color
# Sets the color of the range
rng.color=(255,255,255)
# Clear the background color of range
rng.color=None
# Get the first column of range
rng.column
# Returns the data of the cells in the range
rng.count
# Return current_region
rng.current_region
# Return to ctrl + direction
rng.end('down')
# Get formula or enter formula
rng.formula='=SUM(B1:B5)'
# Array Formula
rng.formula_array
# Gets the absolute address of the cell
rng.get_address(row_absolute=True, column_absolute=True,include_sheetname=False, external=False)
# Get column width
rng.column_width
# Returns the total width of the range
rng.width
# Get hyperlinks for range
rng.hyperlink
# Get the last cell in the lower right corner of the range
rng.last_cell
# range translation
rng.offset(row_offset=0,column_offset=0)
#resize the range to change the size of the range
rng.resize(row_size=None,column_size=None)
# First row of range
rng.row
# The height of the row. If all rows are the same height, return the row height. If not, return None
rng.row_height
# Returns the total height of the range
rng.height
# Returns the number of rows and columns in the range
rng.shape
# Returns the sheet where the range is located
rng.sheet
#Returns all rows of range
rng.rows
# First line of range
rng.rows[0]
# Total rows of range
rng.rows.count
# Returns all columns of range
rng.columns
# Returns the first column of the range
rng.columns[0]
# Returns the number of columns in the range
rng.columns.count
# Size adaptation of all range s
rng.autofit()
# All column widths are adaptive
rng.columns.autofit()
# All row width adaptation
rng.rows.autofit()
4. api of books workbook collection
# New workbook
xw.books.add()
# Reference the currently active workbook
xw.books.active
4. Sets of sheets
# New sheet
xw.sheets.add(name=None,before=None,after=None)
# Reference the currently active sheet
xw.sheets.active
4.6 data structure
1. One dimensional data
The list in python can exchange data with the rows and columns in Excel. The one-dimensional list in python defaults to one row of data in Excel.
import xlwings as xw

sht=xw.sheets.active

# Write 1, 2 and 3 into cells A1, B1 and C1 respectively
sht.range('A1').value=[1,2,3]

# Store the values of cells A1, B1 and C1 in the list1 list
list1=sht.range('A1:C1').value

# Write 1, 2 and 3 into cells A1, A2 and A3 respectively
sht.range('A1').options(transpose=True).value=[1,2,3]

# Save the values of cells A1, A2 and A3 in list1 list
list1=sht.range('A1:A3').value
2. 2D data
python's two-dimensional list can be converted into rows and columns in Excel. Two dimensional list, that is, the elements in the list or the list. In Excel, a list element in a two-dimensional list represents a column in an excel table. For example:
# Enter A1, A2 and A3 into the first column and B1, B2 and B3 into the second column
list1=[['a1','a2','a3'],['b1','b2','b3']]
sht.range('A1').value=list1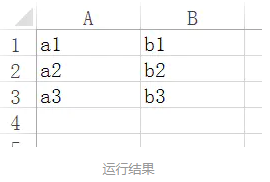
# Assign the value of A1: B3 to the two-dimensional list list1
list1=sht.range('A1:B3').value
3. Selection table of range in Excel
# Select first column
rng=sht. range('A1').expand('down')
rng.value=['a1','a2','a3']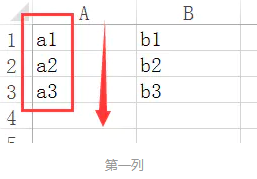
# Select the first row
rng=sht.range('A1').expand('right')
rng=['a1','b1']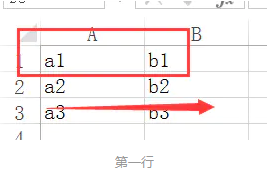
# Select table
rng.sht.range('A1').expand('table')
rng.value=[['a1','a2','a3'],['b1','b2','b3']]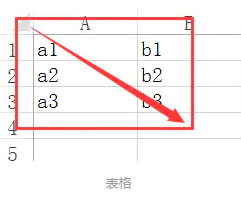
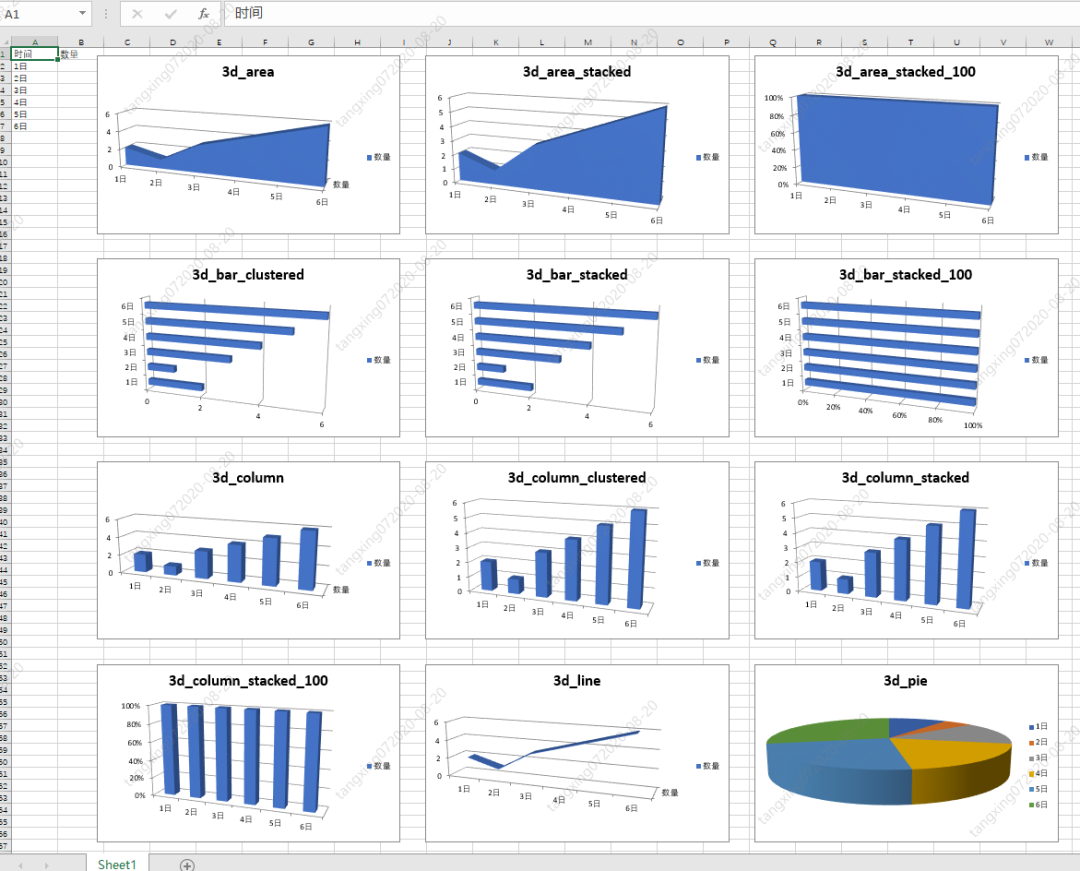
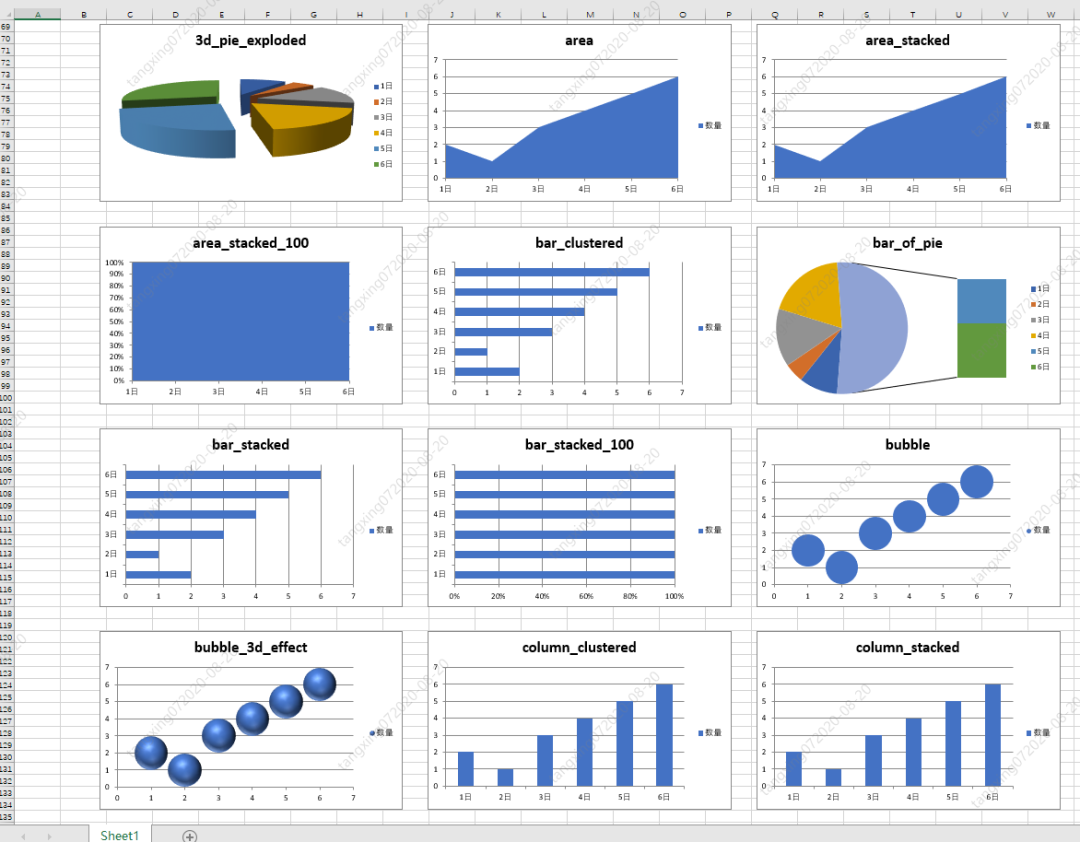
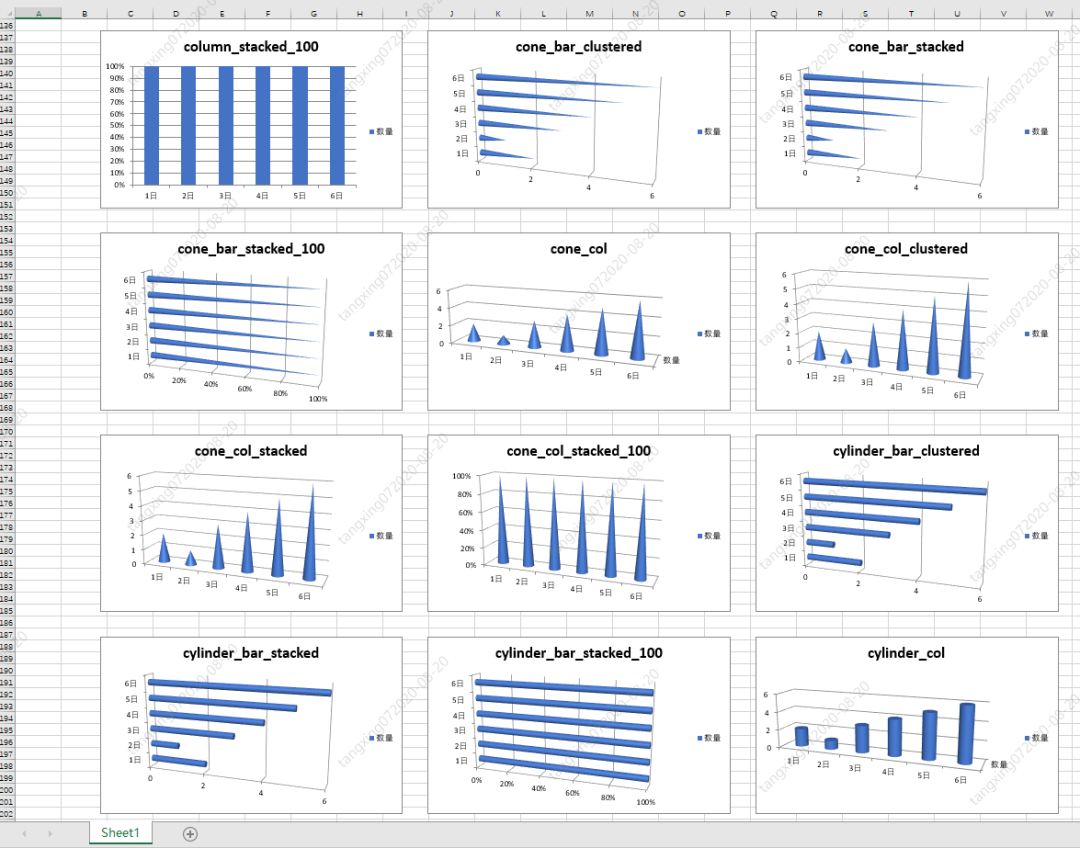
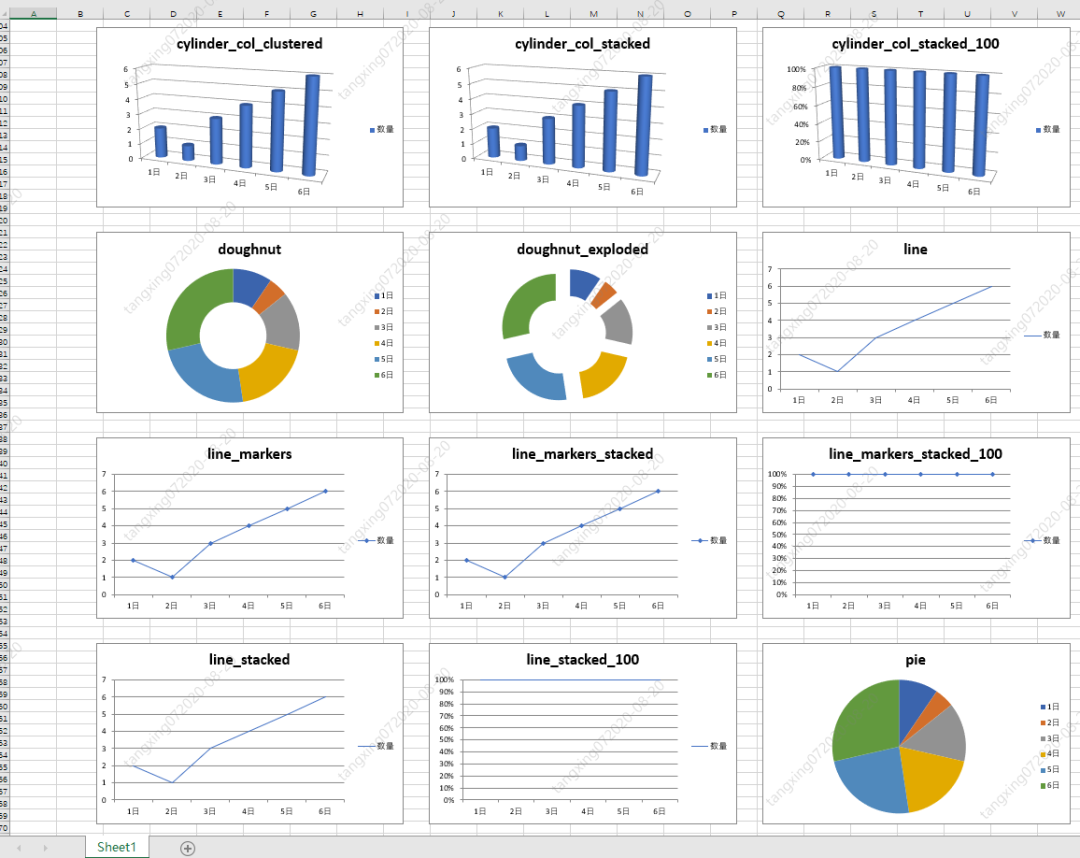
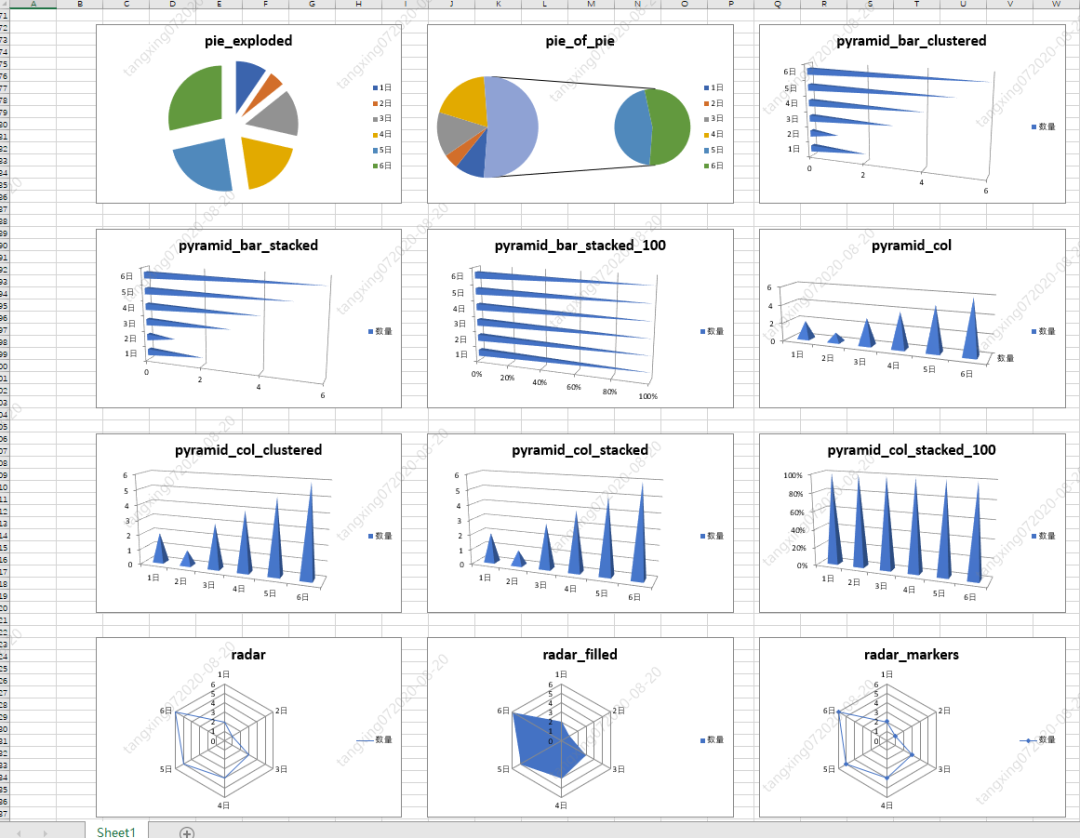
4.7 xlwings generation chart
For the method of generating chart, please refer to: Python operation Excel library xlwings common operation details!
import xlwings as xw
app = xw.App()
wb = app.books.active
sht = wb.sheets.active

chart = sht.charts.add(100, 10)  # 100 and 10 are the coordinates of the position where the chart is placed. In pixels.
chart.set_source_data(sht.range('A1').expand())  # The parameter is the data range in the table.
# chart.chart_type = i               # It is used to set the chart type. The specific parameters are described in detail below.
chart.api[1].ChartTitle.Text = i          # Used to set the title of the chart.
Example code:
import xlwings as xw
app = xw.App()
wb = app.books.active
sht = wb.sheets.active
# Generate chart data
sht.range('A1').value = [['time', 'quantity'], ['1 day', 2], ['2 day', 1], ['3 day', 3]
             , ['4 day', 4], ['5 day', 5], ['6 day', 6]]
"""Chart type parameters, which are annotated, cannot generate corresponding charts"""
dic = {
  '3d_area': -4098,
  '3d_area_stacked': 78,
  '3d_area_stacked_100': 79,
  '3d_bar_clustered': 60,
  '3d_bar_stacked': 61,
  '3d_bar_stacked_100': 62,
  '3d_column': -4100,
  '3d_column_clustered': 54,
  '3d_column_stacked': 55,
  '3d_column_stacked_100': 56,
  '3d_line': -4101,
  '3d_pie': -4102,
  '3d_pie_exploded': 70,
  'area': 1,
  'area_stacked': 76,
  'area_stacked_100': 77,
  'bar_clustered': 57,
  'bar_of_pie': 71,
  'bar_stacked': 58,
  'bar_stacked_100': 59,
  'bubble': 15,
  'bubble_3d_effect': 87,
  'column_clustered': 51,
  'column_stacked': 52,
  'column_stacked_100': 53,
  'cone_bar_clustered': 102,
  'cone_bar_stacked': 103,
  'cone_bar_stacked_100': 104,
  'cone_col': 105,
  'cone_col_clustered': 99,
  'cone_col_stacked': 100,
  'cone_col_stacked_100': 101,
  'cylinder_bar_clustered': 95,
  'cylinder_bar_stacked': 96,
  'cylinder_bar_stacked_100': 97,
  'cylinder_col': 98,
  'cylinder_col_clustered': 92,
  'cylinder_col_stacked': 93,
  'cylinder_col_stacked_100': 94,
  'doughnut': -4120,
  'doughnut_exploded': 80,
  'line': 4,
  'line_markers': 65,
  'line_markers_stacked': 66,
  'line_markers_stacked_100': 67,
  'line_stacked': 63,
  'line_stacked_100': 64,
  'pie': 5,
  'pie_exploded': 69,
  'pie_of_pie': 68,
  'pyramid_bar_clustered': 109,
  'pyramid_bar_stacked': 110,
  'pyramid_bar_stacked_100': 111,
  'pyramid_col': 112,
  'pyramid_col_clustered': 106,
  'pyramid_col_stacked': 107,
  'pyramid_col_stacked_100': 108,
  'radar': -4151,
  'radar_filled': 82,
  'radar_markers': 81,
  # 'stock_hlc': 88,
  # 'stock_ohlc': 89,
  # 'stock_vhlc': 90,
  # 'stock_vohlc': 91,
  # 'surface': 83,
  # 'surface_top_view': 85,
  # 'surface_top_view_wireframe': 86,
  # 'surface_wireframe': 84,
  'xy_scatter': -4169,
  'xy_scatter_lines': 74,
  'xy_scatter_lines_no_markers': 75,
  'xy_scatter_smooth': 72,
  'xy_scatter_smooth_no_markers': 73
}
w = 385
h = 241
n = 0
x = 100
y = 10
for i in dic.keys():
  xx = x + n % 3*w  # The x coordinate used to generate the chart placement.
  yy = y + n//3*h # is used to generate the y coordinate of chart placement.
  chart = sht.charts.add(xx, yy)
  chart.set_source_data(sht.range('A1').expand())
  chart.chart_type = i
  chart.api[1].ChartTitle.Text = i
  n += 1
wb.save('chart_Chart')
wb.close()
app.quit()
The effects are as follows:
4.8 practical training
1. xlwings create a new Excel document
Program example:
# 3.4.2 xlwings create a new excel document
def fun3_4_2():
"""
visible
Ture: so excel
False: invisible excel
add_book
True:open excel And create a new workbook
False: Do not create a new workbook
"""
app = xw.App(visible=True, add_book=False)
# Create a new Workbook (if you don't pick up the next code, Excel will only flash by and sell it)
wb = app.books.add()
# Save Workbook
wb.save('example.xlsx')
# Exit Workbook
wb.close()
# Exit Excel
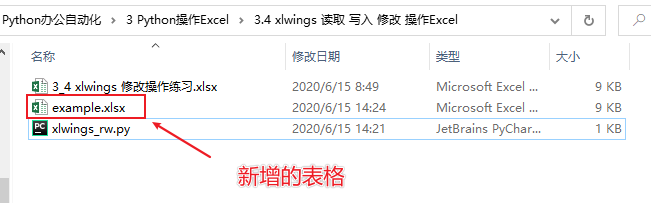
app.quit()After the program is executed, "example.xlsx" is added to the folder:
The table is empty:
2. xlwings open the existing Excel document
The existing table looks like this:
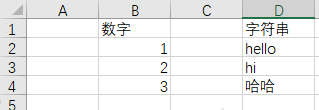
Running program:
# 3.4.3 xlwings open the existing Excel file
def fun3_4_3():
# New EXCEL default setting: the program is visible, only open without creating a new workbook, and screen update is closed
app = xw.App(visible=True, add_book=False)
app.display_alerts = False
app.screen_updating = False
# Open an existing Excel file
wb=app.books.open('./3_4 xlwings Modify operation exercise.xlsx')
# Save Workbook
wb.save('example_2.xlsx')
# Exit Workbook
wb.close()
# Exit Excel
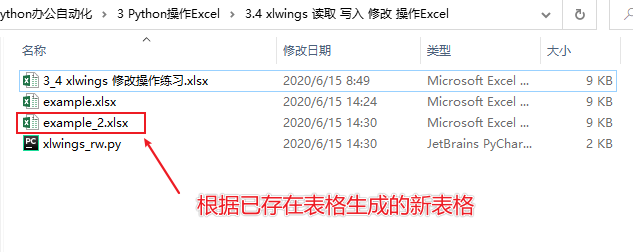
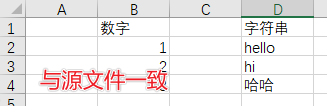
app.quit()Generate a new table:
The contents are as follows:
3. xlwings reading and writing Excel
Program example:
# 3.4.4 xlwings reading and writing Excel
def fun3_4_4():
# New EXCEL default setting: the program is visible, only open without creating a new workbook, and screen update is closed
app = xw.App(visible=True, add_book=False)
app.display_alerts = False
app.screen_updating = False
# Open an existing Excel file
wb=app.books.open('./3_4 xlwings Modify operation exercise.xlsx')
# Get sheet object
print(wb.sheets)
sheet = wb.sheets[0]
# sheet = wb.sheets["sheet1"]
# Read Excel information
cellB1_value = sheet.range('B1').value
print("Cell B1 The content is:",cellB1_value)
# Clear cell contents and formatting
sheet.range('A1').clear()
# Write cell
sheet.range('A1').value = "xlwings write in"
# Save Workbook
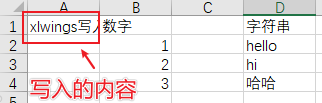
wb.save('example_3.xlsx')
# Exit Workbook
wb.close()
# Exit Excel
app.quit()Execution effect:

Related articles:
6000 word long text, take you to complete various Excel operations with Python!
Python operation Excel library xlwings common operation details!
Explain the various operations of Python and Excel in detail!
5. Python openpyxl read write modify Excel
In openpyxl, three concepts are mainly used: Workbooks, Sheets and Cells.
- A Workbook is an excel worksheet;
- Sheet is a sheet page in a worksheet;
- Cell is a simple lattice.
openpyxl revolves around these three concepts. No matter reading or writing, it is a "three board axe": open the Workbook, locate the Sheet, and operate the Cell.
Official documents: https://openpyxl.readthedocs.io/en/stable/
Official example:
from openpyxl import Workbook
wb = Workbook()

# grab the active worksheet
ws = wb.active

# Data can be assigned directly to cells
ws['A1'] = 42

# Rows can also be appended
ws.append([1, 2, 3])

# Python types will automatically be converted
import datetime
ws['A2'] = datetime.datetime.now()

# Save the file
wb.save("sample.xlsx")
5.1 basic operation of openpyxl
1. Installation
pip install openpyxl
Because I have installed it, the following information is prompted:
2. Open the file
(1) New
from  openpyxl import  Workbook
# instantiation
wb = Workbook()
# Activate worksheet
ws = wb.active
(2) Open existing
from openpyxl  import load_workbook

wb = load_workbook('File name.xlsx')
3. Write data
# Method 1: data can be directly allocated to cells (formulas can be entered)
ws['A1'] = 42
# Method 2: you can attach rows, starting from the first column (from the bottom blank, starting from the left) (you can enter multiple rows)
ws.append([1, 2, 3])
# Method 3: Python type will be automatically converted
ws['A3'] = datetime.datetime.now().strftime("%Y-%m-%d")
4. Create a sheet
# Method 1: insert to last (default)
ws1 = wb.create_sheet("Mysheet")
# Mode 2: insert to the beginning
ws2 = wb.create_sheet("Mysheet", 0)
5. Select sheet
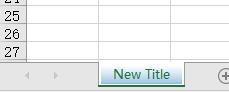
# sheet names can be indexed as key s
>>> ws3 = wb["New Title"]
>>> ws4 = wb.get_sheet_by_name("New Title")
>>> ws is ws3 is ws4
True
6. View table name (sheet)
# Show all table names
>>> print(wb.sheetnames)
['Sheet2', 'New Title',  'Sheet1']
# Traverse all tables
>>> for sheet in  wb:
...     print(sheet.title)
7. Access cell
(1) Single cell access
# Method 1
>>> c = ws['A4']
# Method 2: row and column
>>> d = ws.cell(row=4, column=2, value=10)
# Method 3: create as long as you access
>>> for i in  range(1,101):
...         for j in range(1,101):
...            ws.cell(row=i, column=j)
(2) Multiple cell access
# By slicing
>>> cell_range = ws['A1':'C2']
# By row (column)
>>> colC = ws['C']
>>> col_range = ws['C:D']
>>> row10 = ws[10]
>>> row_range = ws[5:10]
# By specifying the range (row → row)
>>> for row in  ws.iter_rows(min_row=1, max_col=3, max_row=2):
...    for cell in  row:
...        print(cell)
<Cell Sheet1.A1>
<Cell Sheet1.B1>
<Cell Sheet1.C1>
<Cell Sheet1.A2>
<Cell Sheet1.B2>
<Cell Sheet1.C2>
# By specifying the range (column → column)
>>> for row in  ws.iter_rows(min_row=1, max_col=3, max_row=2):
...    for cell in  row:
...        print(cell)
<Cell Sheet1.A1>
<Cell Sheet1.B1>
<Cell Sheet1.C1>
<Cell Sheet1.A2>
<Cell Sheet1.B2>
<Cell Sheet1.C2>
# Traverse all methods one
>>> ws = wb.active
>>> ws['C9'] = 'hello world'
>>> tuple(ws.rows)
((<Cell Sheet.A1>, <Cell Sheet.B1>, <Cell Sheet.C1>),
(<Cell Sheet.A2>, <Cell Sheet.B2>, <Cell Sheet.C2>),
...
(<Cell Sheet.A8>, <Cell Sheet.B8>, <Cell Sheet.C8>),
(<Cell Sheet.A9>, <Cell Sheet.B9>, <Cell Sheet.C9>))
# Traverse all method two
>>> tuple(ws.columns)
((<Cell Sheet.A1>,
<Cell Sheet.A2>,
<Cell Sheet.A3>,
...
<Cell Sheet.B7>,
<Cell Sheet.B8>,
<Cell Sheet.B9>),
(<Cell Sheet.C1>,
...
<Cell Sheet.C8>,
<Cell Sheet.C9>))
8. Save data
wb.save('File name.xlsx')9. Others
(1) Change sheet label button color
ws.sheet_properties.tabColor = "1072BA" # The color value is RGB16 hexadecimal value
(2) Get maximum row, maximum column
# Get maximum columns and maximum rows
print(sheet.max_row)
print(sheet.max_column)
(3) Get each row and each column
- sheet.rows is the generator, which contains the data of each row, and each row is wrapped by a tuple.
- sheet.columns is similar, but each tuple is the cell of each column.
# Because of the row by row, the order of A1, B1 and C1 is returned
for row in sheet.rows:
    for cell in row:
        print(cell.value)

# A1, A2, A3 in this order
for column in sheet.columns:
    for cell in column:
        print(cell.value)
(4) Get letters from numbers, get numbers from letters
from openpyxl.utils import get_column_letter, column_index_from_string

# Returns letters based on the numbers in the column
print(get_column_letter(2))  # B
# Returns the number of columns based on letters
print(column_index_from_string('D'))  # 4
(5) Delete sheet
# Mode 1
wb.remove(sheet)
# Mode II
del wb[sheet]
(6) Matrix permutation
rows = [
    ['Number', 'data1', 'data2'],
    [2, 40, 30],
    [3, 40, 25],
    [4, 50, 30],
    [5, 30, 10],
    [6, 25, 5],
    [7, 50, 10]]

list(zip(*rows))

# out
[('Number', 2, 3, 4, 5, 6, 7),
 ('data1', 40, 40, 50, 30, 25, 50),
 ('data2', 30, 25, 30, 10, 5, 10)]

# Note that the method discards columns (rows) that lack data
rows = [
    ['Number', 'data1', 'data2'],
    [2, 40      ],    # There is one less data here
    [3, 40, 25],
    [4, 50, 30],
    [5, 30, 10],
    [6, 25, 5],
    [7, 50, 10],
]
# out
[('Number', 2, 3, 4, 5, 6, 7), ('data1', 40, 40, 50, 30, 25, 50)]
10. Set cell style
(1) Class to import
from openpyxl.styles import Font, colors, Alignment
(2) Typeface
- The following code specifies equal line 24, bold italic, and the font color is red. Directly use the font attribute of the cell to assign the font object to it.
bold_itatic_24_font = Font(name='Isoline', size=24, italic=True, color=colors.RED, bold=True)

sheet['A1'].font = bold_itatic_24_font
(3) Alignment
- The cell attribute alignment is also used directly. Here, the vertical center and horizontal center are specified. In addition to center, you can also use parameters such as right, left, and so on
# Set the vertical center and horizontal center of data in B1
sheet['B1'].alignment = Alignment(horizontal='center', vertical='center')
(4) Set row height and column width
# Row 2 row height
sheet.row_dimensions[2].height = 40
# Column C column width
sheet.column_dimensions['C'].width = 30
(5) Merge and split cells
- The so-called merged cell refers to the cell in the upper left corner of the merged area as the benchmark, covering other cells to make it called a large cell.
- Instead, after splitting the cell, return the value of the large cell to the original upper left corner.
# Merge cells and write data to the upper left corner
sheet.merge_cells('B1:G1') # Merge several cells in a row
sheet.merge_cells('A1:C3') # Merge cells in a rectangular range- After merging, you can only write data to the upper left corner, that is, the coordinates on the left of the interval.
- If these cells to be merged have data, only the data in the upper left corner will be retained, and the others will be discarded. In other words, if data is not written in the upper left corner before merging, there will be no data in the merged cells.
- The following is the code for splitting cells. After splitting, the value returns to the A1 position
sheet.unmerge_cells('A1:C3')11. Example code
import datetime
from random import choice
from time import time
from openpyxl import load_workbook
from openpyxl.utils import get_column_letter
# Set file mingc
addr = "openpyxl.xlsx"
# Open file
wb = load_workbook(addr)
# Create a new table
ws = wb.create_sheet()
# First line input
ws.append(['TIME', 'TITLE', 'A-Z'])
# Input content (500 lines of data)
for i in range(500):
TIME = datetime.datetime.now().strftime("%H:%M:%S")
TITLE = str(time())
A_Z = get_column_letter(choice(range(1, 50)))
ws.append([TIME, TITLE, A_Z])
# Get maximum rows
row_max = ws.max_row
# Get maximum columns
con_max = ws.max_column
# Print the contents written above on the console
for j in ws.rows: # we.rows get each row of data
for n in j:
print(n.value, end="\t") # n.value gets the value of the cell
print()
# Save, save (the file name (absolute address) must be written. Under the default py peer directory, only xlsx format is supported)
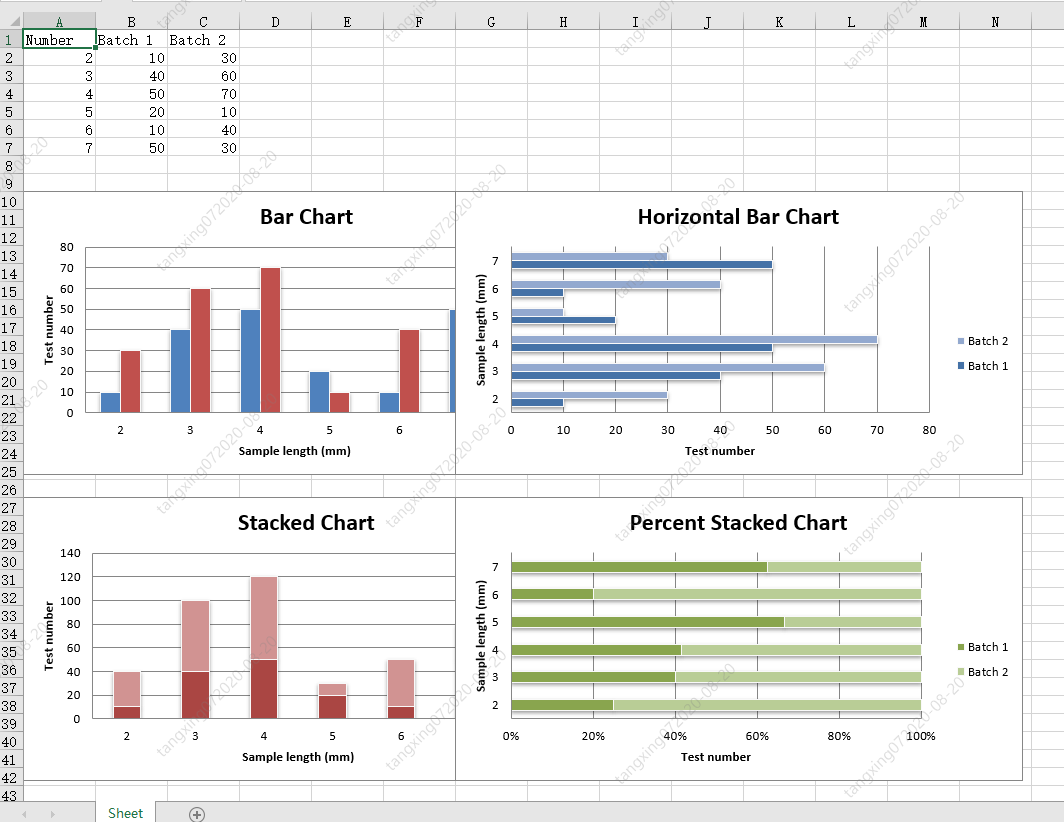
wb.save(addr)5.2 openpyxl generate 2D chart
Example code:
from openpyxl import Workbook
from openpyxl.chart import BarChart, Series, Reference

wb = Workbook(write_only=True)
ws = wb.create_sheet()

rows = [
    ('Number', 'Batch 1', 'Batch 2'),
    (2, 10, 30),
    (3, 40, 60),
    (4, 50, 70),
    (5, 20, 10),
    (6, 10, 40),
    (7, 50, 30),
]

for row in rows:
    ws.append(row)

chart1 = BarChart()
chart1.type = "col"
chart1.style = 10
chart1.title = "Bar Chart"
chart1.y_axis.title = 'Test number'
chart1.x_axis.title = 'Sample length (mm)'

data = Reference(ws, min_col=2, min_row=1, max_row=7, max_col=3)
cats = Reference(ws, min_col=1, min_row=2, max_row=7)
chart1.add_data(data, titles_from_data=True)
chart1.set_categories(cats)
chart1.shape = 4
ws.add_chart(chart1, "A10")

from copy import deepcopy

chart2 = deepcopy(chart1)
chart2.style = 11
chart2.type = "bar"
chart2.title = "Horizontal Bar Chart"
ws.add_chart(chart2, "G10")

chart3 = deepcopy(chart1)
chart3.type = "col"
chart3.style = 12
chart3.grouping = "stacked"
chart3.overlap = 100
chart3.title = 'Stacked Chart'
ws.add_chart(chart3, "A27")

chart4 = deepcopy(chart1)
chart4.type = "bar"
chart4.style = 13
chart4.grouping = "percentStacked"
chart4.overlap = 100
chart4.title = 'Percent Stacked Chart'
ws.add_chart(chart4, "G27")

wb.save("bar.xlsx")
The effects are as follows:
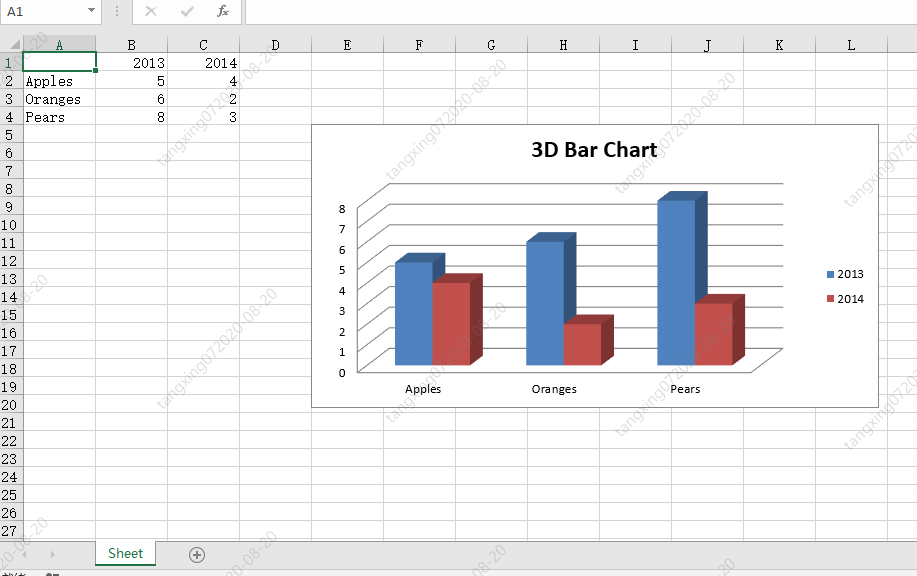
5.3 openpyxl generating 3D charts
Example code:
from openpyxl import Workbook
from openpyxl.chart import (
    Reference,
    Series,
    BarChart3D,
)

wb = Workbook()
ws = wb.active

rows = [
    (None, 2013, 2014),
    ("Apples", 5, 4),
    ("Oranges", 6, 2),
    ("Pears", 8, 3)
]

for row in rows:
    ws.append(row)

data = Reference(ws, min_col=2, min_row=1, max_col=3, max_row=4)
titles = Reference(ws, min_col=1, min_row=2, max_row=4)
chart = BarChart3D()
chart.title = "3D Bar Chart"
chart.add_data(data=data, titles_from_data=True)
chart.set_categories(titles)

ws.add_chart(chart, "E5")
wb.save("bar3d.xlsx")
The effects are as follows:
5.4 practical training
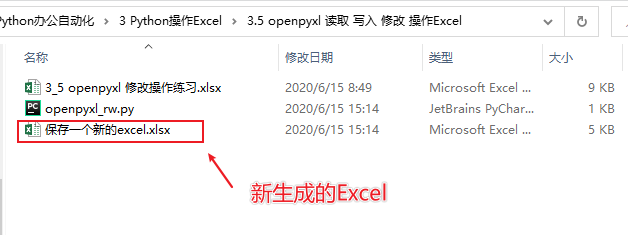
1.openpyxl create a new Excel
Program example:
# 3.5.2 openpyxl create Excel
def fun3_5_2():
    wb = Workbook()

    # Note: this function calls the index of the worksheet (_active_sheet_index), which is 0 by default.
    # Unless you change this value, you are always operating on the first worksheet with this function.
    ws = wb.active

    # Set sheet name
    ws.title = "New Title"

    # Set sheet color
    ws.sheet_properties.tabColor = "1072BA"

    # Save form
    wb.save('Save a new excel.xlsx')
Execution effect:
And set the title and background color for the sheet:
2.openpyxl open existing Excel
Program example:
# 3.5.3 openpyxl open existing Excel
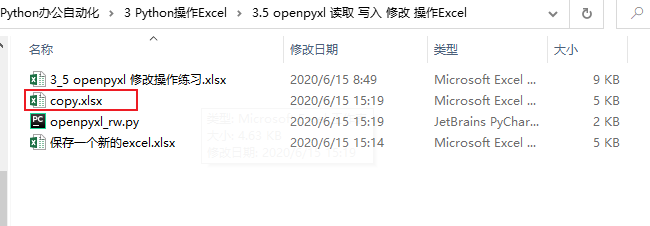
def fun3_5_3():
wb = load_workbook("./3_5 openpyxl Modify operation exercise.xlsx")
# Note: this function calls the index of the worksheet (_active_sheet_index), which is 0 by default.
# Unless you change this value, you are always operating on the first worksheet with this function.
ws = wb.active
# Save form
wb.save('copy.xlsx')The effects are as follows:
3.openpyxl reading and writing Excel
Program example:
# 3.5.4 openpyxl reading and writing Excel
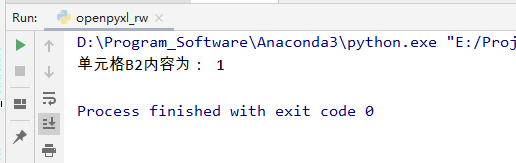
def fun3_5_4():
wb = load_workbook("./3_5 openpyxl Modify operation exercise.xlsx")
# Note: this function calls the index of the worksheet (_active_sheet_index), which is 0 by default.
# Unless you change this value, you are always operating on the first worksheet with this function.
ws = wb.active
# Read cell information
cellB2_value = ws['B2'].value
print("Cell B2 The content is:",cellB2_value)
# Write cell
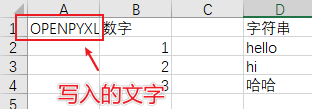
ws['A1'].value = "OPENPYXL"
# Save form
wb.save('copy.xlsx')Execution results:
6. Python xlswriter write operation Excel
- XlsxWriter is a python module used to write Excel 2007 and xlsx file formats. It can be used to write text, numbers and formulas, and supports cell formatting, pictures, charts, document configuration, automatic filtering and other features
- Advantages: more functions, high fidelity, extended format type, faster and configurable disadvantages: it can not be used to read and modify excel files
Official documents: https://xlsxwriter.readthedocs.io/
6.1 basic operation of xlswriter
1. Install the xlswriter module
pip install XlsxWriter
Since I have already installed it, I will be prompted that:

2. Create excel file
# create a file
workbook = xlsxwriter.Workbook("new_excel.xlsx")
3. Create sheet
# Create sheet
worksheet = workbook.add_worksheet("first_sheet")
4. Write data
(1) Write text
# Method I:
worksheet.write('A1', 'write something')
# Method 2:
worksheet.write(1, 0, 'hello world')
(2) Write number
# Write number
worksheet.write(0, 1, 32)
worksheet.write(1, 1, 32.3)
(3) Write function
worksheet.write(2, 1, '=sum(B1:B2)')
(4) Write picture
# Insert picture
worksheet.insert_image(0, 5, 'test.png')
worksheet.insert_image(0, 5, 'test.png', {'url': 'http://httpbin.org/'})
(5) Write date
# Write date
d = workbook.add_format({'num_format': 'yyyy-mm-dd'})
worksheet.write(0, 2, datetime.datetime.strptime('2017-09-13', '%Y-%m-%d'), d)
(6) Set row and column properties
# Set the row property, and set the row height to 40
worksheet.set_row(0, 40)

# Set the column properties and set the width of columns A to B to 20
worksheet.set_column('A:B', 20)
5. Custom format
Common formats:
- Font color: color
- bold font
- Font size: font_site
- Date format: num_format
- Hyperlink: url
- Underline setting: underline
- Cell color: bg_color
- Borders: border
- Alignment: align
# Custom format
f = workbook.add_format({'border': 1, 'font_size': 13, 'bold': True, 'align': 'center','bg_color': 'cccccc'})
worksheet.write('A3', "python excel", f)
worksheet.set_row(0, 40, f)
worksheet.set_column('A:E', 20, f)
6. Batch write data to cells
# Batch write data to cells
worksheet.write_column('A15', [1, 2, 3, 4, 5])  # Column write, starting with A15
worksheet.write_row('A12', [6, 7, 8, 9])        # Line write, starting from A12
7. Merge cell write
# Merge cell write
worksheet.merge_range(7,5, 11, 8, 'merge_range')
8. Close the file
workbook.close()
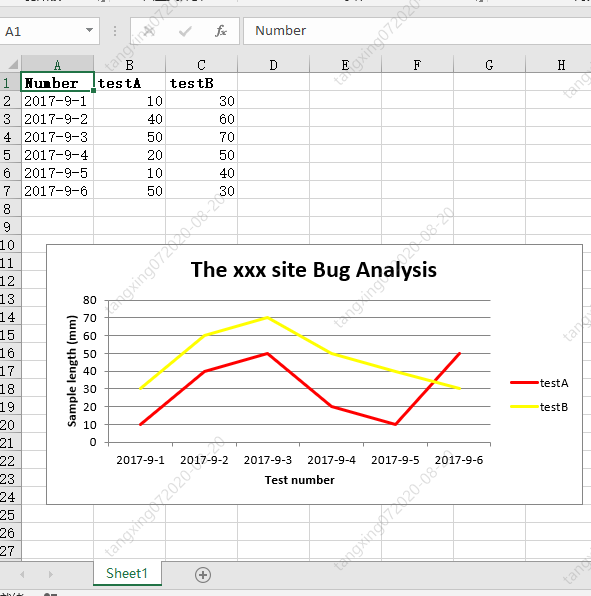
6.3 xlswriter generates line chart
Example code:
# -*- coding:utf-8 -*-

import xlsxwriter

# Create an excel
workbook = xlsxwriter.Workbook("chart_line.xlsx")
# Create a sheet
worksheet = workbook.add_worksheet()
# worksheet = workbook.add_worksheet("bug_analysis")

# Custom styles, bold
bold = workbook.add_format({'bold': 1})

# --------1. Prepare data and write to excel---------------
# Write data to excel and use it when creating icons
headings = ['Number', 'testA', 'testB']
data = [
    ['2017-9-1', '2017-9-2', '2017-9-3', '2017-9-4', '2017-9-5', '2017-9-6'],
    [10, 40, 50, 20, 10, 50],
    [30, 60, 70, 50, 40, 30],
]

# Write header
worksheet.write_row('A1', headings, bold)

# Write data
worksheet.write_column('A2', data[0])
worksheet.write_column('B2', data[1])
worksheet.write_column('C2', data[2])

# --------2. Generate chart and insert into excel---------------
# Create a line chart
chart_col = workbook.add_chart({'type': 'line'})

# Configure first series data
chart_col.add_series({
    # sheet1 here is the default value because we did not specify the sheet name when creating a new sheet
    # If the sheet name is set when we create a new sheet, it should be set to the corresponding value here
    'name': '=Sheet1!$B$1',
    'categories': '=Sheet1!$A$2:$A$7',
    'values':   '=Sheet1!$B$2:$B$7',
    'line': {'color': 'red'},
})

# Configure second series data
chart_col.add_series({
    'name': '=Sheet1!$C$1',
    'categories':  '=Sheet1!$A$2:$A$7',
    'values':   '=Sheet1!$C$2:$C$7',
    'line': {'color': 'yellow'},
})

# Configure the second series of data (using another syntax)
# chart_col.add_series({
#     'name': ['Sheet1', 0, 2],
#     'categories': ['Sheet1', 1, 0, 6, 0],
#     'values': ['Sheet1', 1, 2, 6, 2],
#     'line': {'color': 'yellow'},
# })

# Set the title and x, y axis information of the chart
chart_col.set_title({'name': 'The xxx site Bug Analysis'})
chart_col.set_x_axis({'name': 'Test number'})
chart_col.set_y_axis({'name':  'Sample length (mm)'})

# Set the style of the chart
chart_col.set_style(1)

# Insert the chart into the worksheet and set the offset
worksheet.insert_chart('A10', chart_col, {'x_offset': 25, 'y_offset': 10})

workbook.close()
The effects are as follows:
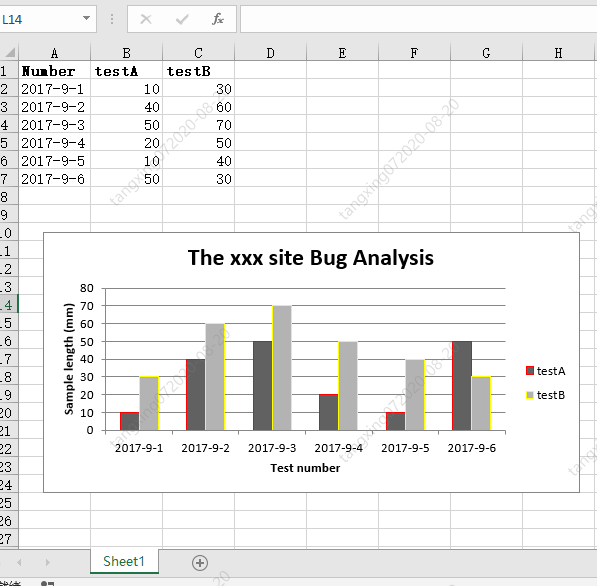
6.4 xlswriter generate histogram
Example code:
# -*- coding:utf-8 -*-

import xlsxwriter

# Create an excel
workbook = xlsxwriter.Workbook("chart_column.xlsx")
# Create a sheet
worksheet = workbook.add_worksheet()
# worksheet = workbook.add_worksheet("bug_analysis")

# Custom styles, bold
bold = workbook.add_format({'bold': 1})

# --------1. Prepare data and write to excel---------------
# Write data to excel and use it when creating icons
headings = ['Number', 'testA', 'testB']
data = [
    ['2017-9-1', '2017-9-2', '2017-9-3', '2017-9-4', '2017-9-5', '2017-9-6'],
    [10, 40, 50, 20, 10, 50],
    [30, 60, 70, 50, 40, 30],
]

# Write header
worksheet.write_row('A1', headings, bold)

# Write data
worksheet.write_column('A2', data[0])
worksheet.write_column('B2', data[1])
worksheet.write_column('C2', data[2])

# --------2. Generate chart and insert into excel---------------
# Create a column chart
chart_col = workbook.add_chart({'type': 'column'})

# Configure first series data
chart_col.add_series({
    # sheet1 here is the default value because we did not specify the sheet name when creating a new sheet
    # If the sheet name is set when we create a new sheet, it should be set to the corresponding value here
    'name': '=Sheet1!$B$1',
    'categories': '=Sheet1!$A$2:$A$7',
    'values':   '=Sheet1!$B$2:$B$7',
    'line': {'color': 'red'},
})

# Configure the second series of data (using another syntax)
chart_col.add_series({
    'name': '=Sheet1!$C$1',
    'categories':  '=Sheet1!$A$2:$A$7',
    'values':   '=Sheet1!$C$2:$C$7',
    'line': {'color': 'yellow'},
})

# Configure the second series of data (using another syntax)
# chart_col.add_series({
#     'name': ['Sheet1', 0, 2],
#     'categories': ['Sheet1', 1, 0, 6, 0],
#     'values': ['Sheet1', 1, 2, 6, 2],
#     'line': {'color': 'yellow'},
# })

# Set the title and x, y axis information of the chart
chart_col.set_title({'name': 'The xxx site Bug Analysis'})
chart_col.set_x_axis({'name': 'Test number'})
chart_col.set_y_axis({'name':  'Sample length (mm)'})

# Set the style of the chart
chart_col.set_style(1)

# Insert chart into worksheet and offset
worksheet.insert_chart('A10', chart_col, {'x_offset': 25, 'y_offset': 10})

workbook.close()
The effects are as follows:
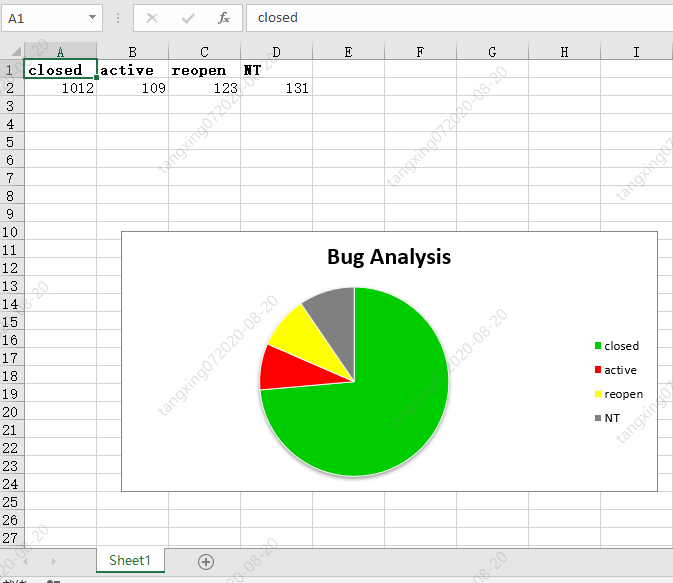
6.5 generating pie chart by xlswriter
Example code:
# -*- coding:utf-8 -*-

import xlsxwriter

# Create an excel
workbook = xlsxwriter.Workbook("chart_pie.xlsx")
# Create a sheet
worksheet = workbook.add_worksheet()

# Custom styles, bold
bold = workbook.add_format({'bold': 1})

# --------1. Prepare data and write to excel---------------
# Write data to excel and use it when creating icons
data = [
    ['closed', 'active', 'reopen', 'NT'],
    [1012, 109, 123, 131],
]

# Write data
worksheet.write_row('A1', data[0], bold)
worksheet.write_row('A2', data[1])

# --------2. Generate chart and insert into excel---------------
# Create a pie chart
chart_col = workbook.add_chart({'type': 'pie'})

# Configure first series data
chart_col.add_series({
    'name': 'Bug Analysis',
    'categories': '=Sheet1!$A$1:$D$1',
    'values': '=Sheet1!$A$2:$D$2',
    'points': [
        {'fill': {'color': '#00CD00'}},
        {'fill': {'color': 'red'}},
        {'fill': {'color': 'yellow'}},
        {'fill': {'color': 'gray'}},
    ],

})

# Set the title and x, y axis information of the chart
chart_col.set_title({'name': 'Bug Analysis'})

# Set the style of the chart
chart_col.set_style(10)

# Insert chart into worksheet and offset
worksheet.insert_chart('B10', chart_col, {'x_offset': 25, 'y_offset': 10})
workbook.close()
The effects are as follows:
6.6 practical training
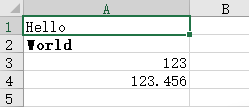
1.xlswriter create and write to Excel
Program example:
# 3.6.2 xlswriter creates and writes to Excel
def fun3_6_2():
    # Create an excel and add a sheet
    workbook = xlsxwriter.Workbook('demo.xlsx')
    worksheet = workbook.add_worksheet()

    # Set column width
    worksheet.set_column('A:A', 20)

    # Format
    bold = workbook.add_format({'bold': True})

    # Add text content
    worksheet.write('A1', 'Hello')

    # Add content by format
    worksheet.write('A2', 'World', bold)

    # Write some numbers
    worksheet.write(2, 0, 123)
    worksheet.write(3, 0, 123.456)

    # Add picture
    worksheet.insert_image('B5', 'demo.png')

    workbook.close()
The effects are as follows:
7. Python win32com read write modify Excel
python can use a third-party library called win32com to operate com. Win32com is powerful and can operate word, call macros and so on.
7.1 pip installation win32com
pip install pypiwin32
Since I have already installed it, I will be prompted that:
7.2 Python uses win32com to read and write Excel
Program example:
import win32com
from win32com.client import Dispatch, constants
import os
# Get current script path
def getScriptPath():
nowpath = os.path.split(os.path.realpath(__file__))[0]
print(nowpath)
return nowpath
# 3.7.2 Python uses win32com to read and write Excel
def fun3_7_2():
app = win32com.client.Dispatch('Excel.Application')
# Background operation, no display, no warning
app.Visible = 0
app.DisplayAlerts = 0
# Create a new Excel
# WorkBook = app.Workbooks.Add()
# New sheet
# sheet = WorkBook.Worksheets.Add()
# Open the existing table. Note that the absolute path should be used here
WorkBook = app.Workbooks.Open(getScriptPath() + "\\3_7 win32com Modify operation exercise.xlsx")
sheet = WorkBook.Worksheets('Sheet1')
# Get the n-th row and n-th column of cell information without - 1
cell01_value = sheet.Cells(1,2).Value
print("cell01 The contents are as follows:",cell01_value)
# Write table information
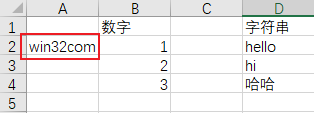
sheet.Cells(2, 1).Value = "win32com"
# Save form
#WorkBook.Save()
# Save as implementation copy
WorkBook.SaveAs(getScriptPath() + "\\new.xlsx")
# Close table
WorkBook.Close()
app.Quit()
if __name__ == '__main__':
fun3_7_2()The effects are as follows:
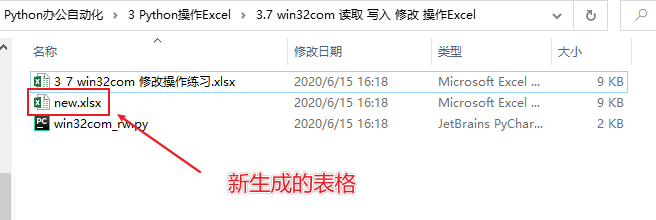
The content is:
8. Python pandas reading and writing Excel
Introduction:
pandas is a NumPy based tool created to solve data analysis tasks. pandas incorporates a large number of libraries and some standard data models, providing the tools needed to operate large data sets efficiently. pandas provides a large number of functions and methods that enable us to process data quickly and easily. You will soon find that it is one of the important factors that make Python a powerful and efficient data analysis environment.
Official website: https://pandas.pydata.org/
Official documents: https://pandas.pydata.org/pandas-docs/stable/
8.1 pip installation pandas
pip install pandas
8.2 pandas reading and writing Excel
The table reads as follows:
Program example:
import pandas as pd
from pandas import DataFrame
# 3.8.2 pandas reading and writing Excel
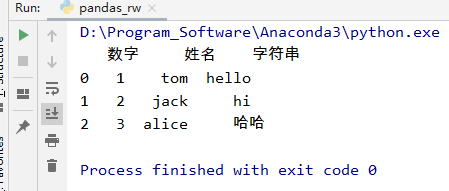
def fun3_8_2():
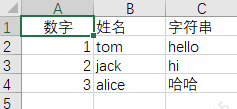
data = pd.read_excel('3_8 pandas Modify operation exercise.xlsx', sheet_name='Sheet1')
print(data)
# Add line data, and add in line 5
data.loc[4] = ['4', 'john', 'pandas']
# Add column data and give the default value None
data['new_col'] = None
# Save data
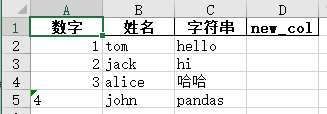
DataFrame(data).to_excel('new.xlsx', sheet_name='Sheet1', index=False, header=True)
if __name__ == '__main__':
fun3_8_2()The effects are as follows:
The generated excel is as follows:
pandas is very powerful. Here are just simple examples. There are many other operations. You can refer to the official documents or quick start for learning.
Ten thousand words long article, welcome to like, watch and share!