To generate a table using python report, you need to define the data and style of the table, and finally use doc The build method generates files.
Describe the table method in the reportlab Chinese Manual:
Table initialization
Table(
data,
colWidths=None,
rowHeights=None,
style=None,
splitByRow=1,
repeatRows=0,
repeatCols=0,
rowSplitRange=None,
spaceBefore=None,
spaceAfter=None,
)
Parameter data is a sequence of cell values. Each cell value should be converted into a string value using str function, or it should be a string value
A Flowable instance (such as Paragraph) or a list (or tuple) of such instances. If a cell value is a Flowable or
For a Flowable list, these cells must have a certain width, or the contained columns must have a fixed width. unit
The first row of cell values is in data[0], that is, the cell values are arranged in row order. i, jth. The cell value is in data[i][j].
The new line character '\ n' in the cell value is treated as a line split character and is used to format the cell as a row when draw ing.
Other parameters are quite obvious. The colWidths parameter is a sequence of numbers, or None, representing the width of the column. stay
The number of elements in colWidths determines the number of columns in the table. A value of None means that the corresponding column width should be calculated automatically.
The parameter rowheights is a sequence of numbers or None, which represents the height of the row. rowHeights
The number of elements in determines the number of rows in the table. A value of None means that the corresponding row height should be calculated automatically.
The parameter style can be the initial style of the table.
The splitByRow parameter applies only to tables that are too high and too wide to fit the current context.
In this case, you have to decide whether to "tile" down and horizontally, or horizontally and then down. This parameter is a Boolean value, table
Shows that when the available space in the current drawing area is too small and the caller wants the Table to be divided, the Table should be divided by row first, and then
Split by column. At present, Table segmentation by column has not been realized, so setting splitByRow to False will result in NotImplem entedError.
The parameter repeatRows specifies the number of leading rows or tuples that should be repeated when the Table is required to be split. If it is a tuple
, it should specify which leading lines should be repeated; This allows the first occurrence of the table to have more leading rows than subsequent splits.
Currently, the repeatCols parameter is ignored because the Table cannot be split by column.
When rearranged in a platypus story, the spaceBefore and spaceAfter parameters
Can be used to place additional space before or after the table.
The rowSplitRange parameter can be used to control the table segmentation and divide the table into a subset of its rows; This prevents splitting too close to the table
Start or end.
Table.setStyle(tblStyle)
This method applies a specific instance of the class TABLESTYLE (discussed below) to a Table instance. This is to make tables in a good way
The only way formatting occurs.
The continuous use of the setStyle method applies these styles in an additive manner. In other words, the later application will cover the previous overlapping application
Use.
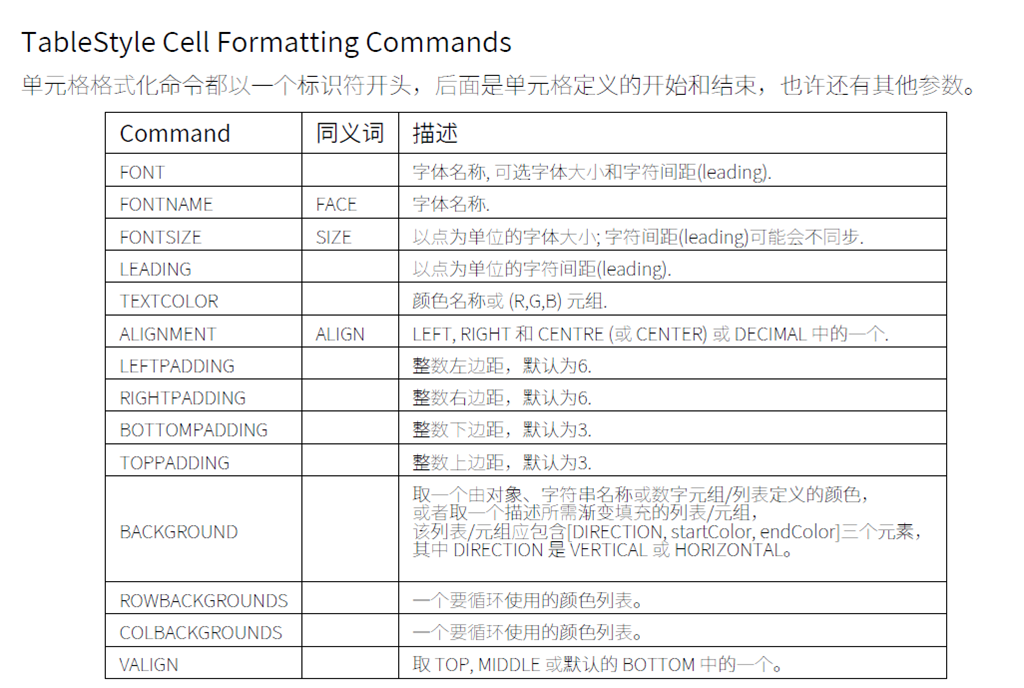
TableStyle(commandSequence)
The creation method takes the parameter command sequence as an example to initialize the TableStyle.
This class is created by passing it a sequence of commands, each command
Is a tuple, identified by its first element, which is a string; The remaining elements of the command tuple represent the start and stop cell coordinates of the command, and may also have thickness and color.
LIST_STYLE = TableStyle(
[('LINEABOVE', (0,0), (-1,0), 2, colors.green),
('LINEABOVE', (0,1), (-1,-1), 0.25, colors.black),
('LINEBELOW', (0,-1), (-1,-1), 2, colors.green),
('ALIGN', (1,1), (-1,-1), 'RIGHT')]
)
Here (0,0), (- 1,0), is the definition range. The front is the upper coordinate and the rear is the lower coordinate. Each group of coordinates is (column, row)
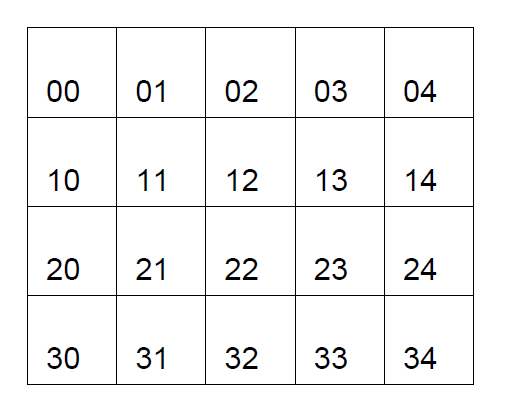
from reportlab.platypus.tables import Table, TableStyle
from reportlab.lib import colors
from reportlab.lib.units import inch
from reportlab.platypus import SimpleDocTemplate, Paragraph, Spacer, Image, Table, TableStyle
elements = []
data = [['00', '01', '02', '03', '04'],
    ['10', '11', '12', '13', '14'],
    ['20', '21', '22', '23', '24'],
    ['30', '31', '32', '33', '34']]
t = Table(data,5*[0.4*inch], 4*[0.4*inch])
t.setStyle(TableStyle([
    ('TEXTCOLOR',(0,0),(-1,-1),colors.green),
    ('INNERGRID', (0,0), (-1,-1), 0.25, colors.black),
    ('BOX', (0,0), (-1,-1), 0.25, colors.black),
    ]))
elements.append(t)
doc = SimpleDocTemplate('TabDemo3.pdf')
doc.build(elements)
The generated files are as follows:
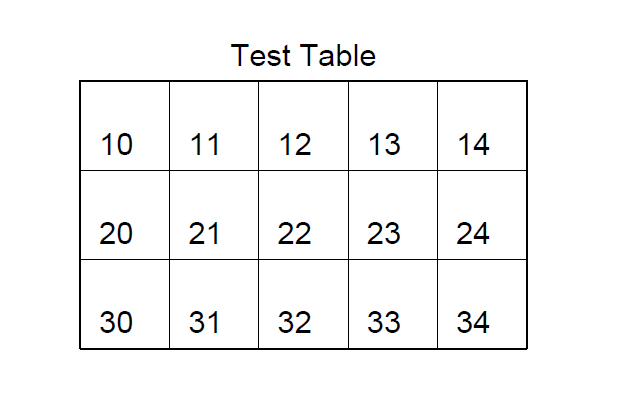
Merge the first row, align, no border: (add border and inner line from column 0 to row 1, and change the outer border to 0.5
from reportlab.platypus.tables import Table, TableStyle
from reportlab.lib import colors
from reportlab.lib.units import inch
from reportlab.platypus import SimpleDocTemplate, Paragraph, Spacer, Image, Table, TableStyle
elements = []
data = [["Test Table",'', '', '', ''],
    ['10', '11', '12', '13', '14'],
    ['20', '21', '22', '23', '24'],
    ['30', '31', '32', '33', '34']]
t = Table(data,5*[0.4*inch], 4*[0.4*inch])
t.setStyle(TableStyle([
    ('TEXTCOLOR',(0,0),(-1,-1),colors.black),#Set cell
    ('SPAN',(0,0),(-1,0)),#Merge cells, merge first row
    ('ALIGN', (0,0), (-1,0), 'CENTER'),#Set the first line to center
    ('INNERGRID', (0,1), (-1,-1), 0.25, colors.black),
    ('BOX', (0,1), (-1,-1), 0.5, colors.black),
    ]))
elements.append(t)
doc = SimpleDocTemplate('TableDemo1.pdf')
doc.build(elements)
The result is
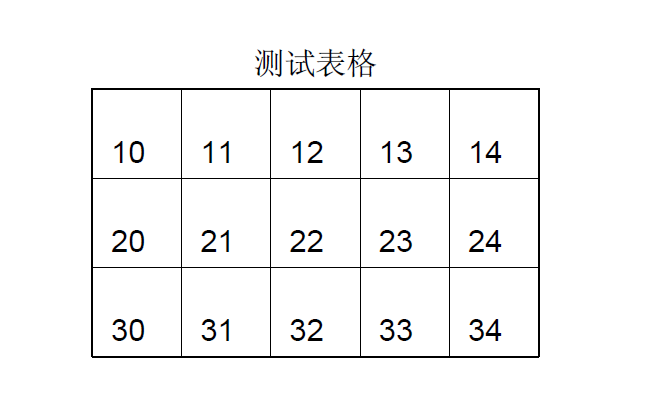
Add Chinese characters
from reportlab.platypus.tables import Table, TableStyle
from reportlab.lib import colors
from reportlab.lib.units import inch
from reportlab.platypus import SimpleDocTemplate, Paragraph, Spacer, Image, Table, TableStyle
from reportlab.pdfbase import pdfmetrics
from reportlab.pdfbase.ttfonts import TTFont #Import font

pdfmetrics.registerFont(TTFont('SimSun','SimSun.ttf')) #Register font
pdfmetrics.registerFont(TTFont('SIMLI','SIMLI.ttf')) #Register font
pdfmetrics.registerFont(TTFont('SIMXING','SIMXING.ttf')) #Register font
pdfmetrics.registerFont(TTFont('Times','Times.ttf')) #Register font

elements = []
data = [["Test form",'', '', '', ''],
    ['10', '11', '12', '13', '14'],
    ['20', '21', '22', '23', '24'],
    ['30', '31', '32', '33', '34']]
t = Table(data,5*[0.4*inch], 4*[0.4*inch])
t.setStyle(TableStyle([
    ('TEXTCOLOR',(0,0),(-1,-1),colors.black),#Set cell
    ('SPAN',(0,0),(-1,0)),#Merge cells, merge first row
    ('ALIGN', (0,0), (-1,0), 'CENTER'),#Set the first line to center
    ("FONTNAME",(0,0), (-1,0), 'SimSun'),
    ('INNERGRID', (0,1), (-1,-1), 0.25, colors.black),
    ('BOX', (0,1), (-1,-1), 0.5, colors.black),
    ]))
elements.append(t)
doc = SimpleDocTemplate('TableDemo2.pdf')
doc.build(elements)
Final result