Yunqi information:[ Click to view more industry information]
Here you can find the first-hand cloud information of different industries. What are you waiting for? Come on!
Guide: today, let's talk about Li Ziqi who lives a poem. See the second part for Python technology. Official account background, reply to the keyword "Li Zi Qi" to obtain complete data.

"The Li family has a daughter, who is called Ziqi." If we talk about the most popular online red, I think many people will think of Li Ziqi.
Li Ziqi can always live a poem or a painting on a seemingly ordinary day when he works at sunrise and stops at sunset.
The peach blossom is ripe in March, and it's picked to brew peach blossom wine. In April, loquat ripens, making loquat wine With different seasons, people who have made different delicacies and watched liziqi video yearn for the ancient rural life in that video, and at the same time, it also brings the healing power to countless people.
At present, Li Ziqi has 5.79 million fans in station B. Up to now, only 125 videos have been released, but almost every video is a blockbuster.

So, what are the characteristics of her videos? Which is the most popular video? Today we will take you to interpret Li Ziqi with data.
Why is Li Ziqi's video so attractive?
We use Python to analyze 125 videos released by Li Ziqi on station B. The analysis process consists of the following three steps:
- Data read in
- Data cleaning
- Data visualization
First, let's see the analysis results:
- Number of videos released each year
First, see the number of videos released by Li Ziqi in each year on station B.
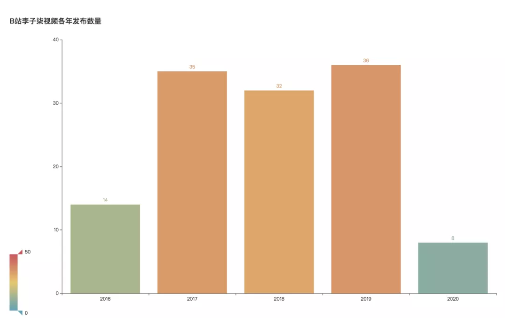
From July 2016, Li Ziqi released the first video in station B. According to statistics, she released 14 videos in 2016. The number of videos released in 2017-2019 is almost the same, all of which are about 34, with an average of 2.8 videos released every month. So far, eight videos have been released in 2020.
- Number of videos released each month
It's said that Li Ziqi can feel the changes of the four seasons in her videos. In which months did she release the most videos?

It is found that the video in summer is significantly higher than that in other seasons, especially in August, 26 of the 125 videos were released in August, accounting for 20%. Secondly, autumn is also the season of high-yield video of plum seven, 36 videos were released from September to November.
- Video release timeline
What are the characteristics of video release time?
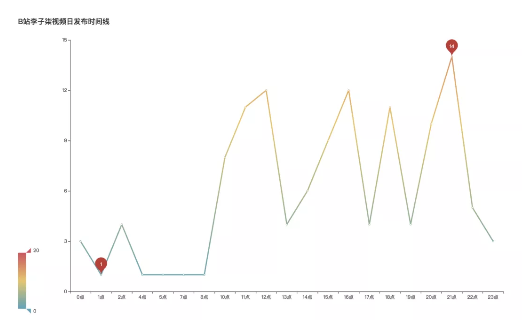
Through the analysis of Li Ziqi's video release timeline, we find that there are four peak hours of video release, namely 12:00, 4:00, 6:00 and 9:00. There are 14 videos released at 9:00 p.m.
- Proportion of video types
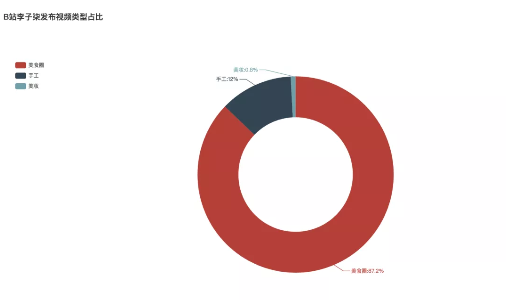
In terms of video type, of course, food is the most, accounting for 87.2%. The second is manual video, accounting for 12%. The least is beauty videos. Only one of the 125 videos released at present is of beauty type.
- Video leaderboard performance
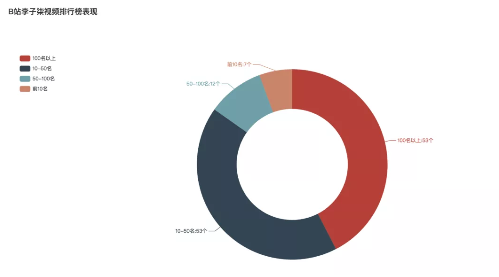
Of all 125 videos, 72 made the B-stop daily ranking. Among them, there are 7 in the top 10, followed by 50-100, with 12 videos. The videos of 10-50 and more than 100 are the most, 53.
- Average performance of various video data
Next, we can see the average performance of all kinds of data in Li Ziqi video.
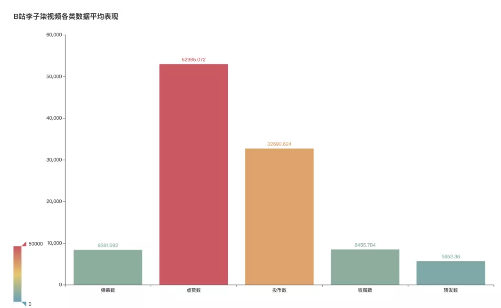
The average number of bullets in the video is 8361, the number of likes is 52965, and the number of coins is 32690. The number of collections is 8455, and the average number of forwarding is 5652.
Which videos play the most? Which video screens interact the most?
- Top 10 videos
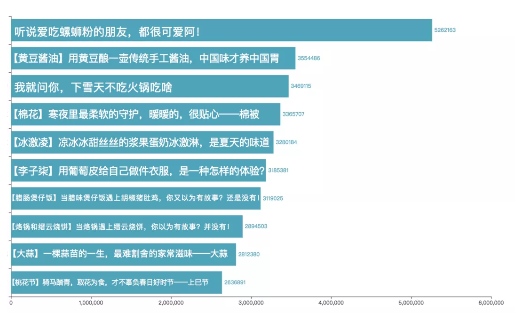
Let's take a look at them separately. First of all, the top 10 videos are the most popular. The most popular video is "it's said that friends who love eating snail powder are lovely!" and the number of videos has reached more than 5.26 million. It seems that snail powder is indeed a proper national online red snack.
What's on the screen of this video?

It can be seen that in the video of snail powder with the highest amount of play, the most frequently discussed materials in the screen are "snail", "snail", "bean", "pepper", "cowpea", etc. The origin of "Guangxi" is also mentioned. Interestingly, the main up food area with the theme of snails powder, such as "egg yolk pie", was also mentioned in the screen.
- Top 10 videos of bullet screens
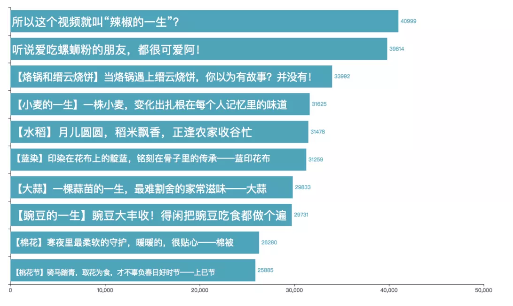
Then there is top 10 video with the largest number of bullet screens, and the video with the largest number of bullet screens is "so this video is called Chili's life". The total number of bullet screens has reached more than 40000.
What's on the screen of this video?

The bullet screen of this video is particularly interesting. The most discussed words in the bullet screen are all kinds of wishing Related words, such as "go ashore", "take the exam", "take the postgraduate entrance examination", "success", "smooth", "refueling", etc., which are mentioned the most frequently.
Let's analyze Li Ziqi's video title again. Her video title is characterized by [Key words] + simple description. For example: a wheat plant changes its flavor rooted in everyone's memory.
- Video title keyword cloud
First, we can see the word cloud characteristics of the key words. We can see that in addition to "plum seven", "peach blossom", "preserved meat" and "pea", the key words are all ingredients with high frequency. At the same time, "manual" is also a high frequency word. Secondly, the "life" of a certain kind of food material is also the theme that Li Ziqi is keen on shooting.

- Video title descriptors cloud
So what are the characteristics of video title description?

The analysis found that "taste" appeared the most frequently, far more than other words. Secondly, the words "summer", "Millennium", "home" and "memory" appear frequently.
02: what are Li Ziqi's videos shooting?
Let's see the key analysis steps:
Python obtained 125 video related information released by Li Ziqi on station B, and made the following analysis. The analysis process is as follows:
- Data read in
- Data cleaning
- Data visualization
The official account dialog box answers Li Ziqi, and gets the complete data.
- Data read in
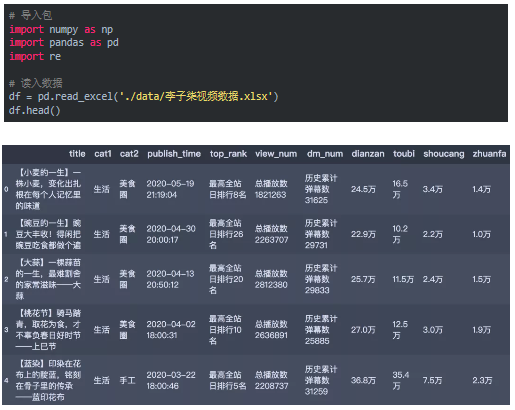
First, read in the data set used for analysis. This data set contains 125 samples and 11 fields. The meaning of the fields is: video title, first level classification, second level classification, release time, highest ranking of the whole station, total number of plays, historical cumulative barrage, likes, coins, collections and shares. The data preview is as follows:
- Data cleaning
In this part, we preliminarily process the following information, including:
title: extract theme and introduction
top_rank: extract values
view_num: extract values
dm_num: extract value
dianzan: calculated value
toubi: calculation value
Shouchang: calculated value
Xuanfa: calculation value
# Defining conversion functions
def transform_num(x):
    str1 = str(x)
    if 'ten thousand' in str1:
        return float(str1.strip('ten thousand'))*10000
    else:
        return float(str1)

# Extract data
df['title_1'] = df.title.str.extract('[(.*?)].*')
df['title_2'] = df.title.str.split(']').str[-1]
df['top_rank'] = df.top_rank.str.extract('Highest daily ranking of the whole station(\d+)name')
df['view_num'] = df.view_num.str.extract('(\d+)')
df['dm_num'] = df.dm_num.str.extract('(\d+)')
df['dianzan'] = df.dianzan.apply(lambda x: transform_num(x))
df['toubi'] = df.toubi.apply(lambda x: transform_num(x))
df['shoucang'] = df.shoucang.apply(lambda x: transform_num(x))
df['zhuanfa'] = df.zhuanfa.apply(lambda x: transform_num(x))

# Conversion type
df['view_num'] = df.view_num.astype('int')
df['dm_num'] = df.dm_num.astype('int')
df['publish_time'] = pd.to_datetime(df['publish_time'])
The processed data are as follows:

- Data visualization
Here we will do the following visual analysis. First, we import the required package, where pyecharts is used to draw dynamic visual graphics, and stylecloud is used to draw word cloud maps. The key codes are as follows:
# Export required packages
from pyecharts.charts import Pie, Line, Tab, Map, Bar, WordCloud, Page
from pyecharts import options as opts
from pyecharts.globals import SymbolType
import stylecloud
- Number of videos released each year
# Number of releases
pub_year = df.publish_time.dt.year.value_counts().sort_index()

# Bar chart
bar0 = Bar(init_opts=opts.InitOpts(width='1350px', height='750px'))
bar0.add_xaxis(pub_year.index.tolist())
bar0.add_yaxis('', pub_year.values.tolist())
bar0.set_global_opts(title_opts=opts.TitleOpts(title='B Number of videos released in each year'),
                     visualmap_opts=opts.VisualMapOpts(max_=50),
                    )
bar0.render()
- Number of videos released each month
pub_month = df.publish_time.dt.month.value_counts().sort_index()

# Bar chart
bar = Bar(init_opts=opts.InitOpts(width='1350px', height='750px'))
bar.add_xaxis([str(i)+'month'for i in pub_month.index.tolist()])
bar.add_yaxis('', pub_month.values.tolist())
bar.set_global_opts(title_opts=opts.TitleOpts(title='B Monthly release quantity of station liziqi video'),
                     visualmap_opts=opts.VisualMapOpts(max_=30),
                    )
bar.render()
- Video release timeline
# Publishing point in time distribution
pub_hour = df.publish_time.dt.hour.value_counts().sort_index()

# Generate data
x1_line1 = [i+'spot' for i in pub_hour.index.values.astype('str').tolist()]
y1_line1 = pub_hour.values.tolist()

# Draw area map
line1 = Line(init_opts=opts.InitOpts(width='1350px', height='750px'))
line1.add_xaxis(x1_line1)
line1.add_yaxis('', y1_line1,
                markpoint_opts=opts.MarkPointOpts(data=[
                    opts.MarkPointItem(type_='max', name='Maximum'),
                    opts.MarkPointItem(type_='min', name='minimum value')
                ]))
line1.set_global_opts(title_opts=opts.TitleOpts('B Daily video release timeline of station liziqi'),
                      visualmap_opts=opts.VisualMapOpts(max_=20)
                     )
line1.set_series_opts(label_opts=opts.LabelOpts(is_show=False),
                      linestyle_opts=opts.LineStyleOpts(width=3))
line1.render()
- Proportion of published video types
# Proportion of video types
cat_num = df.cat2.value_counts()

# Generate data pairs
data_pair = [list(z) for z in zip(cat_num.index.tolist(), cat_num.values.tolist())]

# Draw pie chart
# {a} (series name), {b} (data item name), {c} (value), {d} (percentage)
pie1 = Pie(init_opts=opts.InitOpts(width='1350px', height='750px'))
pie1.add('', data_pair=data_pair, radius=['35%', '60%'])
pie1.set_global_opts(title_opts=opts.TitleOpts(title='B Proportion of video types released by Li Ziqi'),
                     legend_opts=opts.LegendOpts(orient='vertical', pos_top='15%', pos_left='2%'))
pie1.set_series_opts(label_opts=opts.LabelOpts(formatter="{b}:{d}%"))
pie1.render()
- Video performance with ranking data
top_rank_num = df.top_rank.dropna().astype('int')

cut_bins = [1,10,30,50,100]
top_num = pd.cut(top_rank_num, bins=cut_bins, labels=['Top 10', '10-30 name', '30-50 name', '50-100 name']).value_counts()

# Data pair
data_pair_2 = [list(z) for z in zip(top_num.index.tolist(), top_num.values.tolist())]

# Pie chart
pie2 = Pie(init_opts=opts.InitOpts(width='1350px', height='750px'))
pie2.add('', data_pair=data_pair_2, radius=['35%', '60%'])
pie2.set_global_opts(title_opts=opts.TitleOpts(title='B Station Li Ziqi has ranking data video performance'),
                     legend_opts=opts.LegendOpts(orient='vertical', pos_top='15%', pos_left='2%'))
pie2.set_series_opts(label_opts=opts.LabelOpts(formatter="{b}:number:{c}\n Proportion:{d}%"))
pie2.render()
- Average performance of video data
df_num = df[['view_num', 'dm_num', 'dianzan', 'toubi', 'shoucang', 'zhuanfa']].mean()

# Bar chart
bar3 = Bar(init_opts=opts.InitOpts(width='1350px', height='750px'))
bar3.add_xaxis(['Number of bullet screens', 'Likes', 'Number of coins', 'Number of collections', 'Number of forwarding'])
bar3.add_yaxis('', df_num.values.tolist()[1:])
bar3.set_global_opts(title_opts=opts.TitleOpts(title='B Average performance of all kinds of data in liziqi video'),
                     visualmap_opts=opts.VisualMapOpts(max_=50000),
                    )
bar3.render()
- Number of plays Top10 video
# Play top10 at most
view_top10 = df.sort_values('view_num', ascending=False).head(10)[['title', 'view_num']]
view_top10 = view_top10.sort_values('view_num')

# Column chart
bar1 = Bar(init_opts=opts.InitOpts(width='1350px', height='750px'))
bar1.add_xaxis(view_top10.title.values.tolist())
bar1.add_yaxis('', view_top10.view_num.values.tolist())
bar1.set_global_opts(title_opts=opts.TitleOpts(title='B Number of station Li Ziqi plays Top10 video'),
                     yaxis_opts=opts.AxisOpts(axislabel_opts=opts.LabelOpts(position='inside')),
                     visualmap_opts=opts.VisualMapOpts(max_=3000000),
                    )
bar1.set_series_opts(label_opts=opts.LabelOpts(position='right'))
bar1.reversal_axis()
bar1.render()
- Top 10 video
# Bullet curtain top 10 at most
dm_top10 = df.sort_values('dm_num', ascending=False).head(10)[['title', 'dm_num']]
dm_top10 = dm_top10.sort_values("dm_num")

# Column chart
bar2 = Bar(init_opts=opts.InitOpts(width='1350px', height='750px'))
bar2.add_xaxis(dm_top10.title.values.tolist())
bar2.add_yaxis('', dm_top10.dm_num.values.tolist())
bar2.set_global_opts(title_opts=opts.TitleOpts(title='B Number of Li Ziqi bullet screens in the station Top10 video'),
                     visualmap_opts=opts.VisualMapOpts(max_=40999),
                    )
bar2.set_series_opts(label_opts=opts.LabelOpts(position='right'))
bar2.reversal_axis()
bar2.render()
- Cloud chart of video title words
import stylecloud stylecloud.gen_stylecloud(text=' '.join(word_num_selected), #text needs to be str type palette='tableau.Tableau_10', collocations=False, font_path=r'C:\Windows\Fonts\msyh.ttc', # typeface icon_name='fas fa-heart', size=768, output_name='Cloud chart of liziqi video title words.png' # Generate picture )
[yunqi online class] product technology experts share every day!
Course address: https://yqh.aliyun.com/zhibo
Join the community immediately, face to face with experts, and keep abreast of the latest news of the course!
[yunqi online classroom community] https://c.tb.cn/F3.Z8gvnK
Original release time: June 4, 2020
Author: CDA Data Analyst
This article comes from:“ Big data DT WeChat official account ”, you can pay attention to“ Big data DT"