Pytoch machine learning (x) -- anchor generated by k-means clustering method in YOLO
catalogue
Pytoch machine learning (x) -- anchor generated by k-means clustering method in YOLO
2, k-means clustering is used to generate anchor in YOLO
preface
The previous article mentioned some knowledge about the anchor box, but there is a hole that has not been filled, that is, how to determine the size of the anchor box in YOLO. In fact, in yoov3, there is a method of using k-means clustering method to calculate the anchor box, while in yoov5, the author uses genetic algorithm based on the results of K-means clustering method to further obtain a better anchor box.
If you don't understand the concept of anchor box, you can take a look at this article
1, K-means clustering
In YOLOV3, the anchor box size is calculated by using the k-means clustering method.
From an intuitive understanding, we know the length and width of all marked bboxs, and the anchor box is a potential candidate box for predicting these bboxs. Therefore, the closer the length and width shape of the anchor box is to the real bbox, the better. Moreover, since the prediction layer of YOLO network contains three scales of information (corresponding to three receptive fields respectively), and there are three anchors of each scale, we need nine scales of anchors, that is, we need to cluster the sizes of all bbox into nine categories!!
k-means clustering method is commonly used, and its algorithm flow is as follows.
- K points are randomly selected from the data set as the center of the initial clustering, and the center point is
- For each sample xi in the data set, the distance from them to each cluster center point is calculated. Which cluster center point has the smallest distance, it is divided into the class of the corresponding cluster center
- For each category i, the cluster center of that category is recalculated
 (where | | | i | represents the total number of data in this category)
 - Repeat step 2 and step 3 until the position of the cluster center does not change (we can also set the number of iterations)
k-means code
# Calculate the direct distance between the center point and other points
def calc_distance(obs, guess_central_points):
"""
:param obs: All observation points
:param guess_central_points: Center point
:return:Distance of each point corresponding to the center point
"""
distances = []
for x, y in obs:
distance = []
for xc, yc in guess_central_points:
distance.append(math.dist((x, y), (xc, yc)))
distances.append(distance)
return distances
def k_means(obs, k, dist=np.median):
"""
:param obs: Points to be observed
:param k: Cluster number k
:param dist: Characterization clustering center function
:return: guess_central_points Center point
current_cluster Classification results
"""
obs_num = obs.shape[0]
if k < 1:
raise ValueError("Asked for %d clusters." % k)
# Random center point
guess_central_points = obs[np.random.choice(obs_num, size=k, replace=False)] # Initialize maximum distance
last_cluster = np.zeros((obs_num, ))
# When it is less than a certain value, clustering is completed
while True:
# The key is the following calc_distance to calculate the required distance
distances = calc_distance(obs, guess_central_points)
# Gets the index corresponding to the minimum distance
current_cluster = np.argmin(distances, axis=1)
# If the cluster category has not changed, exit directly
if (last_cluster == current_cluster).all():
break
# Calculate new center
for i in range(k):
guess_central_points[i] = dist(obs[current_cluster == i], axis=0)
last_cluster = current_cluster
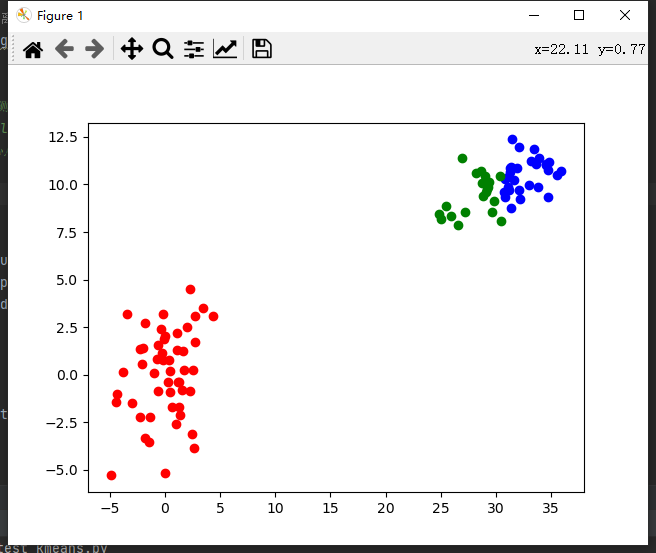
return guess_central_points, current_clusterThe clustering effect is as follows
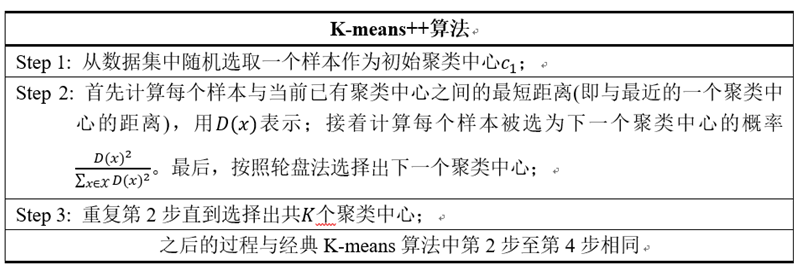
k-means + + algorithm
There is also a k-means + + algorithm, which is a derivative of the k-means algorithm. It mainly solves the problem of randomly selecting the center point in the first step of the k-means algorithm.
The whole code is also very simple. You only need to calculate the first randomly selected center point with the following code.
# k_means + + calculation center coordinates
def calc_center(boxes):
    box_number = boxes.shape[0]
    # Select the first center point at random
    first_index = np.random.choice(box_number, size=1)
    clusters = boxes[first_index]
    # Calculate the distance from each sample to the center point
    dist_note = np.zeros(box_number)
    dist_note += np.inf
    for i in range(k):
        # If enough cluster centers have been found, exit
        if i+1 == k:
            break
        # Calculates the distance between the current center point and other points
        for j in range(box_number):
            j_dist = single_distance(boxes[j], clusters[i])
            if j_dist < dist_note[j]:
                dist_note[j] = j_dist
        # Convert to probability
        dist_p = dist_note / dist_note.sum()
        # Use the roulette method to select the next point
        next_index = np.random.choice(box_number, 1, p=dist_p)
        next_center = boxes[next_index]
        clusters = np.vstack([clusters, next_center])
    return clusters
But in the process of using it, I don't have much improvement. Mainly because the scale difference of bbox is generally not too large, so the selection of this center point has little impact on the final result.
2, k-means clustering is used to generate anchor in YOLO
The following focuses on how to use this k-means algorithm to generate anchor to assist us in training. The following code is a little different from the above code, because our above code is based on points (x, y), while our clustering is bbox (w, h). The following codes take the training set in VOC format as an example. If it is in coco format, You have to change the format yourself.
If you don't want to use the following code but also want to use k-means clustering, please read the bbox and picture (w, h) and save them in the form of a list when reading your own data set, so as to ensure your own n*2 or m*2 list
Read VOC format dataset
The following code not only reads the data set in voc format, but also makes some data statistics. If you don't want to, just annotate it yourself. The code is relatively simple and comments are also written.
You don't have to worry about the code implementation. Remember to change your picture path.
import matplotlib.pyplot as plt
import cv2 as cv
import os
train_annotation_path = '/home/aistudio/data/train/Annotations' # Path of training set annotation
train_image_path = '/home/aistudio/data/train/JPEGImages' # Path to training set image
# Number of pictures displayed
show_num = 12
#Open xml document
def read_voc(train_annotation_path, train_image_path, show_num):
"""
train_annotation_path:Training set annotation Path of
train_image_path: Path to training set image
show_num: Show the size of the picture
"""
# Used to count the length and width of the picture
total_width, total_height = 0, 0
# Used to count the picture bbox length and width
bbox_total_width, bbox_total_height, bbox_num = 0, 0, 0
min_bbox_size = 40000
max_bbox_size = 0
# It is used to count the length and width of the image used for clustering, bbox length and width
img_wh = []
bbox_wh = []
# Tag for statistics
total_size = []
class_static = {'crazing': 0, 'inclusion': 0, 'patches': 0, 'pitted_surface': 0, 'rolled-in_scale': 0, 'scratches': 0}
num_index = 0
for root, dirs, files in os.walk(train_annotation_path):
for file in files:
num_index += 1
xml_path = os.path.join(root, file)
image_name, width, height, bboxes = parase_xml(xml_path)
image_path = os.path.join(train_image_path, image_name)
img_wh.append([width, height])
total_width += width
total_height += height
# If you need to show, read the picture
if num_index < show_num:
image_path = os.path.join(train_image_path, image_name)
image = cv.imread(image_path)
# Statistics about bbox
wh = []
for bbox in bboxes:
class_name = bbox[0]
class_static[class_name] += 1
x1, y1, x2, y2 = bbox[1], bbox[2], bbox[3], bbox[4]
bbox_width = x2 - x1
bbox_height = y2 - y1
bbox_size = bbox_width*bbox_height
# Statistics of the maximum and minimum dimensions of bbox
if min_bbox_size > bbox_size:
min_bbox_size = bbox_size
if max_bbox_size < bbox_size:
max_bbox_size = bbox_size
total_size.append(bbox_size)
# Statistical bbox average size
bbox_total_width += bbox_width
bbox_total_height += bbox_height
# For clustering use
wh.append([bbox_width / width, bbox_height / height]) # Relative coordinates
bbox_num += 1
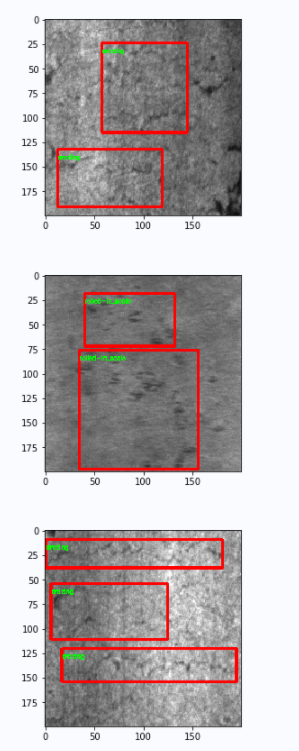
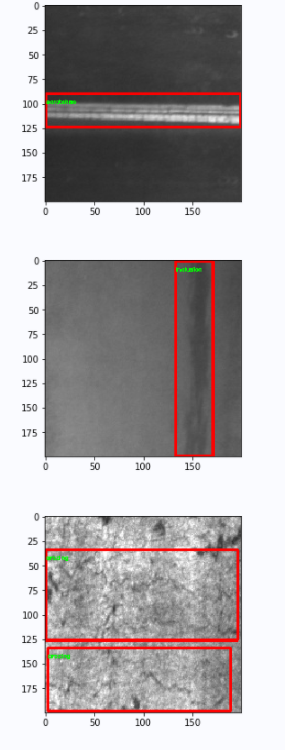
# Draw a box if necessary
if num_index < show_num:
cv.rectangle(image, (x1, y1), (x2, y2), color=(255, 0, 0), thickness=2)
cv.putText(image, class_name, (x1, y1+10), cv.FONT_HERSHEY_SIMPLEX, fontScale=0.2, color=(0, 255, 0), thickness=1)
bbox_wh.append(wh)
# If you need to show
if num_index < show_num:
plt.figure()
plt.imshow(image)
plt.show()
# Remove 2 inspection files
# num_index -= 2
print("total train num is: {}".format(num_index))
print("avg total_width is {}, avg total_height is {}".format((total_width / num_index), (total_height / num_index)))
print("avg bbox width is {}, avg bbox height is {} ".format((bbox_total_width / bbox_num), (bbox_total_height / bbox_num)))
print("min bbox size is {}, max bbox size is {}".format(min_bbox_size, max_bbox_size))
print("class_static show below:", class_static)
return img_wh, bbox_wh
img_wh, bbox_wh = read_voc(train_annotation_path, train_image_path, show_num) Generating anchor by k-means clustering
The k-means code here is a collection of the implementation of k-means + + Sunflower mung bean The blogger proposed to use IOU as the evaluation index to calculate k-means instead of Euler distance. It can be found that the effect of using IOU is better than using Euler distance as the evaluation index)
# k-means clustering, and the evaluation index adopts IOU
def k_means(boxes, k, dist=np.median, use_iou=True, use_pp=False):
    """
    yolo k-means methods
    Args:
        boxes: Need clustering bboxes,bboxes by n*2 contain w,h
        k: Number of clusters(Gather into several categories)
        dist: Method of updating cluster coordinates(The median is used by default, which is slightly better than the mean)
        use_iou: Whether to use IOU As a calculation
    """
    box_number = boxes.shape[0]
    last_nearest = np.zeros((box_number,))
    # k of all bboxes are randomly selected as the center of the cluster
    if not use_pp:
        clusters = boxes[np.random.choice(box_number, k, replace=False)]
    # k_means + + calculates the initial value
    else:
        clusters = calc_center(boxes, k)

    # print(clusters)
    while True:
    	# Calculate the distance 1-IOU(bboxes, anchors) from each bboxes to each cluster
        if use_iou:
            distances = 1 - wh_iou(boxes, clusters)
        else:
            distances = calc_distance(boxes, clusters)
        # Calculate the nearest cluster center of each bboxes
        current_nearest = np.argmin(distances, axis=1)
        # If the elements in each cluster are not changing, it indicates that the clustering is completed
        if (last_nearest == current_nearest).all():
            break  # clusters won't change
        for cluster in range(k):
            # Recalculate the cluster center according to the bboxes in each cluster
            clusters[cluster] = dist(boxes[current_nearest == cluster], axis=0)

        last_nearest = current_nearest

    return clusters
Use my auot below_ Anchor code note!!
IMG in passed in parameters_ Wh and bbox_wh is to read the length and width of the picture in the voc dataset and the length and width of bbox, which are the lists of n*2 and m*2!!
Here I also added the genetic algorithm in yoov5, and the specific details will not be expanded.
from tqdm import tqdm
import random
# Calculate the coincidence degree between anchor and real bbox from clustering and genetic algorithm
def anchor_fitness(k: np.ndarray, wh: np.ndarray, thr: float): # mutation fitness
"""
Input: k: The results after clustering are in ascending order
wh: contain bbox in w,h And converted to absolute coordinates
thr: bbox neutralization k Frame coincidence threshold of clustering
"""
r = wh[:, None] / k[None]
x = np.minimum(r, 1. / r).min(2) # ratio metric
best = x.max(1)
f = (best * (best > thr).astype(np.float32)).mean() # fitness
bpr = (best > thr).astype(np.float32).mean() # best possible recall
return f, bpr
def auto_anchor(img_size, n, thr, gen, img_wh, bbox_wh):
"""
Input: img_size: Zoom size of picture
n: Cluster number
thr: fitness Threshold of
gen: Iteration times of genetic algorithm
img_wh: Length and width collection of pictures
bbox_wh: bbox Long box collection
"""
# Maximum edge reduction to img_size
img_wh = np.array(img_wh, dtype=np.float32)
shapes = (img_size * img_wh / img_wh).max(1, keepdims=True)
wh0 = np.concatenate([l * s for s, l in zip(shapes, bbox_wh)]) # wh
i = (wh0 < 3.0).any(1).sum()
if i:
print(f'WARNING: Extremely small objects found. {i} of {len(wh0)} labels are < 3 pixels in size.')
wh = wh0[(wh0 >= 2.0).any(1)] # Only box es with wh greater than or equal to 2 pixels are reserved
# k_means cluster computing anchor
k = k_means(wh, n, use_iou=True, use_pp=False)
k = k[np.argsort(k.prod(1))] # sort small to large
f, bpr = anchor_fitness(k, wh, thr)
print("kmeans: " + " ".join([f"[{int(i[0])}, {int(i[1])}]" for i in k]))
print(f"fitness: {f:.5f}, best possible recall: {bpr:.5f}")
# YOLOV5 improved genetic algorithm
npr = np.random
f, sh, mp, s = anchor_fitness(k, wh, thr)[0], k.shape, 0.9, 0.1 # fitness, generations, mutation prob, sigma
pbar = tqdm(range(gen), desc=f'Evolving anchors with Genetic Algorithm:') # progress bar
for _ in pbar:
v = np.ones(sh)
while (v == 1).all(): # mutate until a change occurs (prevent duplicates)
v = ((npr.random(sh) < mp) * random.random() * npr.randn(*sh) * s + 1).clip(0.3, 3.0)
kg = (k.copy() * v).clip(min=2.0)
fg, bpr = anchor_fitness(kg, wh, thr)
if fg > f:
f, k = fg, kg.copy()
pbar.desc = f'Evolving anchors with Genetic Algorithm: fitness = {f:.4f}'
# Sort by area
k = k[np.argsort(k.prod(1))] # sort small to large
print("genetic: " + " ".join([f"[{int(i[0])}, {int(i[1])}]" for i in k]))
print(f"fitness: {f:.5f}, best possible recall: {bpr:.5f}")
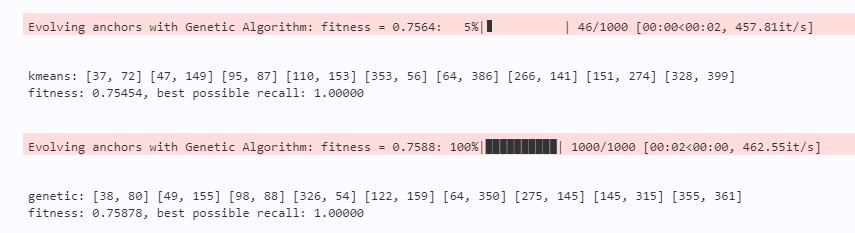
auto_anchor(img_size=416, n=9, thr=0.25, gen=1000, img_wh=img_wh, bbox_wh=bbox_wh)If you are interested in code details, you can read the comments inside. If you don't understand, you can communicate with me in private.
Finally, the calculated results are as follows. It can be seen that the calculated anchors are rectangular. This is because most of my bbox have rectangular anchors, which is in line with my expectations.
summary
The whole idea of the algorithm is not difficult, but the code has some redundancy and length, which is mainly combined with their own. In the process of learning and using, it is found that many bloggers do not understand how to use these codes.