1, Foreword
Smooth curve is an unavoidable topic in all projects involving curve graph. Although many people like to see broken line graph, it is more pleasing to the eye to have a smooth curve graph. This is just like the current mobile app mobile client, from the initial four directions to the current smooth fillet, Even Xiaomi's LOGO was slightly adjusted from square to smooth rounded corners, and the designer received millions. It is a trend for curves to change from curved lines to smooth and silky curves, so I have been wondering why many curve chart controls are not limited to Qt, including C#/JAVA/ANDROID and other development frameworks. By default, they are in the form of line chart rather than smooth. Is it because the English line chart code is simple, Just connect the two points directly?
There are many smoothing curve algorithms on the Internet, and the most commonly used is the Bezier curve path. There are many algorithms on how to generate the connection points of these path points of Bezier curve. Either use the default curve point set to connect one by one, or use the algorithm to readjust and calculate the coordinate points. For example, the default coordinate points are connected with cubicTo, and the highest point will not exceed the real point, Some algorithms will enlarge the trend of various curves. The trend is larger and looks more curved. The disadvantage is that it is likely to exceed part of the real point, so you can choose which algorithm to deal with according to the needs of customers.
It is expected that the future QCustomPlot and qwt controls will have built-in smoothing attributes, which are not enabled by default. After enabling, the smoothing algorithm will be enabled for curve drawing. If it is added by the official, it will still be used by many users. At this stage, if the corresponding processing is added to the source code, it will affect the cleanliness of the original code. After all, the official code has been updated, New features emerge one after another. If you modify them directly in the source code, you have to add new official code every time. It's annoying, so I like to implement them with separate inheritance classes or user-defined classes.
2, Functional features
- The layered design is adopted, and the whole is divided into three levels of interfaces. The first level interface is the overall layout, the second level interface is a single functional module, and the third level interface is a single control.
- Sub controls include pie chart, doughnut chart, curve chart, histogram, column grouping chart, horizontal histogram, horizontal column grouping chart, qualification rate control, percentage control, progress control, equipment status panel, table data, map control, video control, etc.
- The secondary interface can drag and float freely. It supports minimizing hiding, maximizing closing, and responding to double clicking the custom title bar.
- The data source supports analog data (default), database collection, serial communication (customized), network communication (customized), network request, etc. the collection interval of each sub interface, i.e. data refresh frequency, can be freely set.
- Written with pure QWidget and tested Qt4 6 to Qt6 2 any version, which theoretically supports other subsequent Qt versions.
- Super cross platform, personal testing of windows, linux, mac, domestic uos, domestic Galaxy kylin and other systems, with perfect results. At the same time, it also supports embedded linux, such as raspberry pie, Orange Pie, Quanzhi, imx6, etc.
- At the same time, it integrates user-defined controls, qchart pie chart, echart map and other functions.
- Built in multiple sets of color matching styles (purple, blue, dark blue, black), default purple, adaptive to any resolution.
- You can set the system title, target resolution and layout scheme, and start the immediate application.
- You can set the main background color, panel color, crosshair cursor color and other colors.
- Multiple curves can be set with different colors. If no color is set, multiple sets of exquisite colors are built in and applied randomly.
- You can set the background color and text color of the title block.
- You can set the background color, text color and grid color of the curve chart.
- Normal color, warning color, alarm color, disabled color and percentage progress color can be set.
- Various font sizes can be set separately, such as global font, software name, title bar, sub title bar, bold label, etc.
- You can set title block height, header height and row height.
- Curves support cursors, positioning lines, hovering highlighted data points, and hovering display values.
- The histogram supports the display of data at the top (top, upper, middle and bottom can be set), and all adaptive calculation positions.
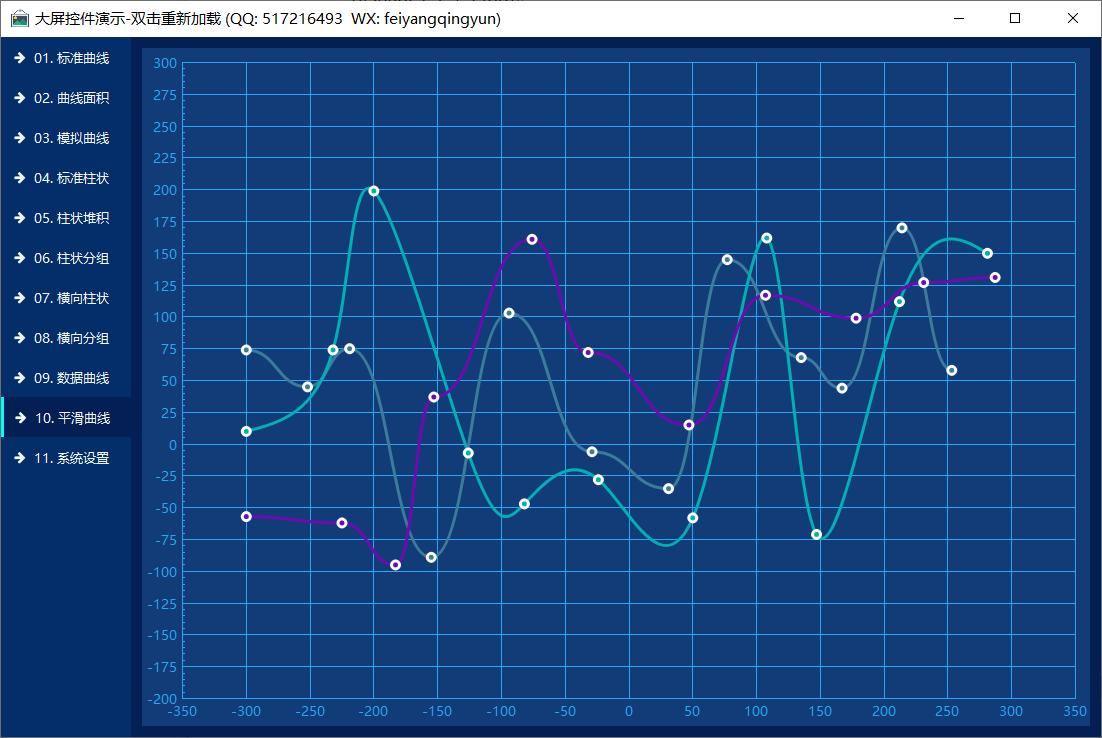
- Support smooth curve, built-in multiple smooth curve algorithms, and support area map smoothing.
- A variety of rules can be selected for the filling color of area map, such as monochrome transparency filling, transparency gradient filling, etc.
- The database supports sqlite, mysql, postgresql, oracle, National People's Congress gold warehouse and other databases.
- In the main interface, right-click to switch layout, color scheme, close and open a secondary form.
- Automatically memorize the size and position of all sub windows, and apply immediately the next time.
- Dynamically load the layout scheme menu. You can dynamically create, restore, save and save layouts. You can create any layout.
- Secondary form, double-click to separate from the main form and float, and you can adjust the size freely. Double click the title bar again to maximize and double-click restore again.
- The sub module can also be displayed in full screen as a large screen, so that multiple sub large screens can be expanded from one large screen to zoom in and view the data details of the sub module, which is suitable for multi screen display.
- Each module can customize the collection speed. If it is database collection, it will be automatically queued for processing. In the later stage, it can also expand the independent database collection of each sub module.
- The system setting module is provided to set the overall configuration parameters, and the effect is applied immediately.
- Provide beautiful and cool large screen map modules, including static pictures, flashing effects, migration effects, world maps, regional maps, etc. you can specify the longitude and latitude coordinates of points, identify click responses, do map jump, etc. each point can have different colors and prompt information.
- In addition to providing a large screen system, each module is also provided with an independent module example interface. Each module can be learned and used independently. The controls used inside are also provided with a separate control example interface to facilitate learning how to use each control.
- Very detailed development and user manual, including database description, module comparison diagram, control comparison diagram, project structure, code description (accurate to each class), demonstration demo, usage method, etc.
3, Experience address
- Experience address: https://pan.baidu.com/s/1d7TH_GEYl5nOecuNlWJJ7g Extraction code: 01jf file name: bin_bigscreen.zip.
- Domestic sites: https://gitee.com/feiyangqingyun
- International sites: https://github.com/feiyangqingyun
- Personal homepage: https://blog.csdn.net/feiyangqingyun
- Zhihu homepage: https://www.zhihu.com/people/feiyangqingyun/
- Online documentation: https://feiyangqingyun.gitee.io/qwidgetdemo/bigscreen/
4, Renderings
5, Core code
#include "customplotline.h"
#include "customplothelper.h"
#include "smoothcurve.h"

CustomPlotLine::CustomPlotLine(QCustomPlot *parentPlot) : QCPItemRect(parentPlot)
{
}

void CustomPlotLine::draw(QCPPainter *painter)
{
    int count = data.points.count();
    if (count == 0) {
        return;
    }

    //To do coordinate conversion
    vpoint points;
    foreach (QPointF point, data.points) {
        double x = parentPlot()->xAxis->coordToPixel(point.x());
        double y = parentPlot()->yAxis->coordToPixel(point.y());
        points << QPointF(x, y);
    }

    //Create a smooth curve
    QPainterPath path;
    if (data.smoothType == 0) {
        path = SmoothCurve::createSmoothCurve(points);
    } else {
        path = SmoothCurve::createSmoothCurve2(points);
    }

    //Set brush
    painter->setPen(QPen(data.lineColor, data.lineWidth));
    //Draw path
    painter->drawPath(path);

    if (data.fillColor > 0) {
        vpoint points;
        //The last point corresponds to Y axis 0
        points << QPointF(data.points.last().x(), 0);
        //The first point corresponds to Y axis 0
        points << QPointF(data.points.first().x(), 0);
        //Move to first point
        points << data.points.first();

        //You need to reset the path, otherwise the drawn area is irregular
        foreach (QPointF point, points) {
            double x = parentPlot()->xAxis->coordToPixel(point.x());
            double y = parentPlot()->yAxis->coordToPixel(point.y());
            path.lineTo(x, y);
        }

        //It's better to remove the border
        painter->setPen(Qt::NoPen);
        //Set canvas background color
        CustomPlotHelper::setGraphBrush(painter, data.lineColor, data.fillColor);
        painter->drawPath(path);
    }

    //Draw data points
    if (data.scatterShape > 0) {
        //Drawing the width of data points in the curve source code seems to need an operation
        int width = data.dataWidth;
        painter->setPen(QPen(data.dataColor, width));
        painter->setBrush(data.lineColor);

        //Loop drawing data points
        foreach (QPointF point, points) {
            painter->drawEllipse(point, width + 1, width + 1);
        }

        //Loop drawing data values
        if (data.drawValue) {
            for (int i = 0; i < count; ++i) {
                QPointF point = points.at(i);
                //The value should be directly above
                int offset = 25;
                QRect textRect(point.x() - offset, point.y() - offset, offset * 2, offset);
                painter->drawRect(textRect);
                //You can specify the value to display
                QString text = QString::number(data.points.at(i).y(), 'f', 1);
                painter->drawText(textRect, Qt::AlignCenter, text);
            }
        }
    }
}

void CustomPlotLine::setData(const LineData &data)
{
    this->data = data;
}