
This is a continuation of the last practice of "how to diy a uvm framework". After the comparison data is generated by uvm, the corresponding bar graph should be drawn in python for direct observation.
I've been thinking about what data can be used to draw bar charts for a long time. At present, I only think of bandwidth fluctuation and length fluctuation. Please reply in the comment area for other answers. Thank you very much!
Most of the online bar charts are drawn by calling the matplotlib library, and then there are a lot of barabarabara. The results are really good, and I feel very fragrant. The following figure is a randomly intercepted one on the Internet. Just have a look.
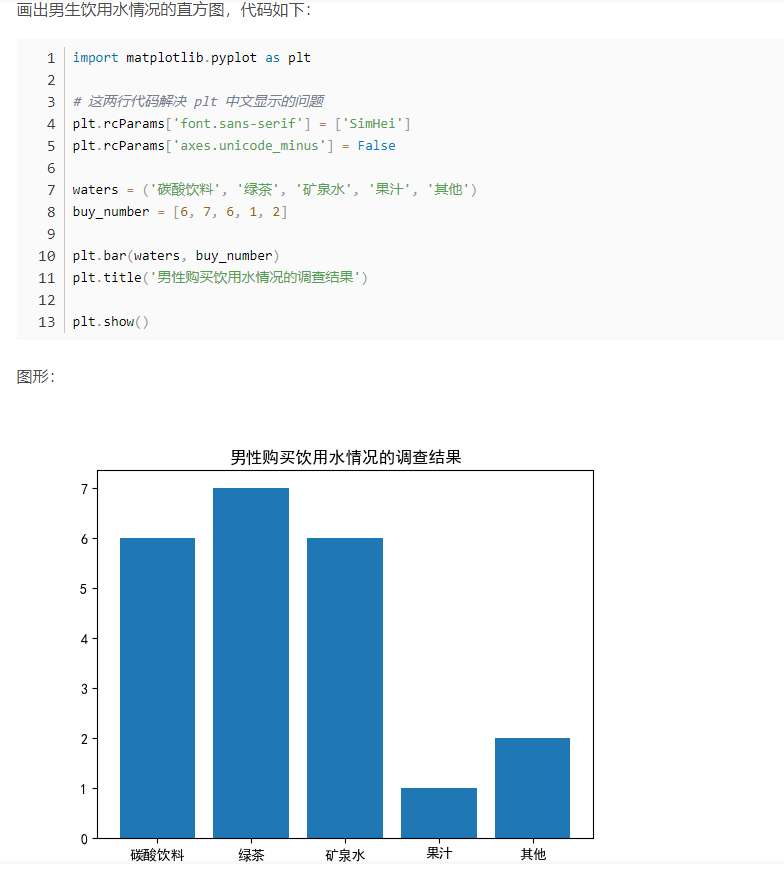
But can I copy my homework so easily? Yes, but it's not necessary. Many of the company's environments are not connected to the Internet. After thinking about where to use this library for you for a while, I feel that the bar chart will not be very difficult. Let's roll one up and start formally without saying much:
Analyzing the above figure is two for loops, and then printing a group of data according to pixels. Since there must be space at the top of the bar chart, set the max value and paste some code segments:
 max_yaxix_width = 25
    x_buf= ""
    y_buf= ""
    idle_buf="      "
    blank_buf="  "
    blank=blank_buf+idle_buf
    print("\n ★★★★★★★★★◣︻◢★★★★★★★★★★★★★★★◣︻◢★★★★★★★★★★★★★★◣︻◢★★★★★★★★★★")
    print("       ★★★★★★★★★★★★★★★★★★★★★Test results★★★★★★★★★★★★★★★★★★★★★★")
    print("           ★★★★★★★★★★★★★★★★★★★★★★★★★★★★★★★★★★★★\n")

    #and and x==len(x_axis)-1 and int(y)==int(y_axis[len(y_axis)-1])
    for g in range(max_yaxix_width,-1,-1):
        for x in range(0,len(x_axis)):
        	if int(math.ceil(int(y_axis[x])/multiple_reduction))>=g  :
        	    #print("  g="+str(g)+"  x="+str(x)+"  y="+y_axis[x] )
        	    y_buf = y_buf +idle_buf+"▇"
        	else :
        		y_buf = y_buf + blank
        		#print("  g="+str(g)+"  x="+str(x)+"  y="+y_axis[x] )

        	if x==len(x_axis)-1 :
        	    y_buf = y_buf + "\n"


    print(y_buf)
Is it over here? No, no, no, my IQ doesn't allow me to finish so hastily. Parameters and data can certainly be perfectly integrated into UVM from external text settings, so after a little modification, I read external text data, pull out characters and paste corresponding code segments:
#log analysis:
def get_data(txt):
    global x_axis
    global y_axis
    x_axis =[]
    y_axis =[]
    with open(txt,'r',encoding='utf-8') as file:
        for line in file.readlines():
        	mid_buf=" ".join(line.split())
        	x_axis.append(mid_buf.split(' ')[0])
        	y_axis.append(mid_buf.split(' ')[1])


def get_config(txt):
    global max_name_width
    global multiple_reduction

    with open(txt,'r',encoding='utf-8') as file:
        for line in file.readlines():
        	mid_buf=" ".join(line.split())
        	if "max_name_width" in mid_buf:
        		max_name_width =int(mid_buf.split('=')[1])
        	if "multiple_reduction" in mid_buf:
        		multiple_reduction =int(mid_buf.split('=')[1])
ok, let's look at the results. Good results are really good. The results are as follows:
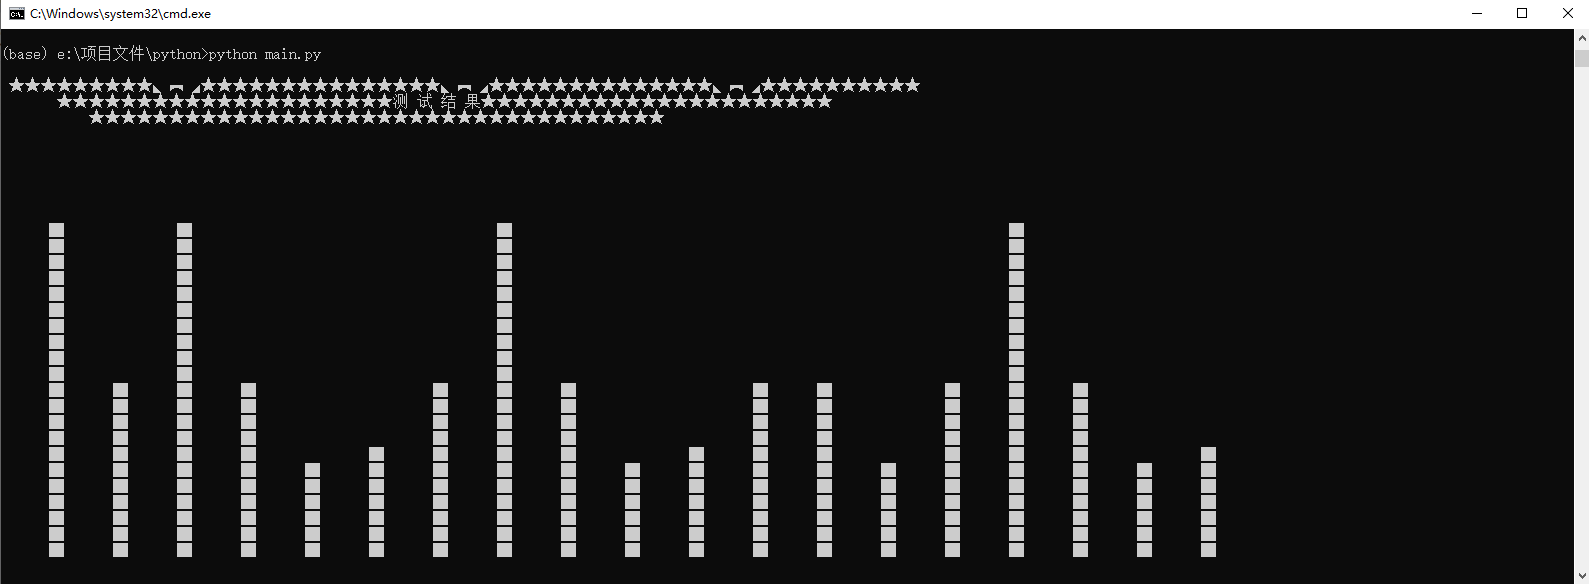
The result is good. Do you think it's over here? No, no, no, there is a vertical bar chart, there is a horizontal bar chart, so I went to the toilet to find inspiration. It took me a few minutes, and the inspiration burst. I went for again. The code snippet is as follows:
print("\n ★★★★★★★★★◣︻◢★★★★★★★★★★★★★★★◣︻◢★★★★★★★★★★★★★★◣︻◢★★★★★★★★★★")
    print("       ★★★★★★★★★★★★★★★★★★★★★Test results★★★★★★★★★★★★★★★★★★★★★★")
    print("           ★★★★★★★★★★★★★★★★★★★★★★★★★★★★★★★★★★★★\n")

    for i in range(0,len(x_axis)):
        for j in range(0,math.ceil(int(y_axis[i])/multiple_reduction)):
        	if j==0:
        	    x_buf = "  "+str(x_axis[i])+":"
        	    idle=max_name_width-len(x_axis[i])
        	    idle =idle*2
        	    for x in range(0,idle):
        	    	x_buf = x_buf+" "
        	x_buf = x_buf + "▇"
        print(x_buf+ "  "+str(y_axis[i]))
    print("\n")
ok, let's look at the results. Good results are really good. Eh, as I said before, the results are as follows:
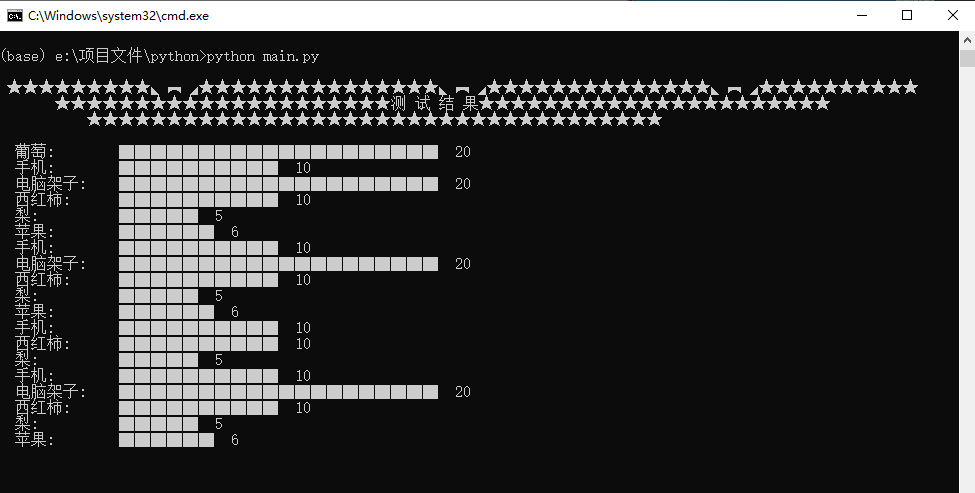
Well, the results are still good. I realized two kinds of bar charts by hand. I released the code and spent my weekend writing it. Please pay attention and support. It's not easy to update and cherish it!
Complete code/
Code structure:
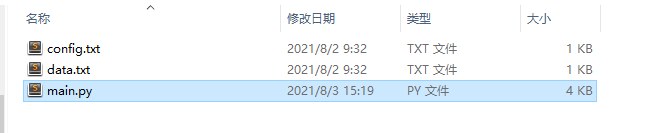
config.txt file:
max_name_width = 6
multiple_reduction = 1
data.txt file:
Grape 20
 Mobile phone 10
 Computer rack 20
 Tomato 10
 Pear 5
 Apple 6
 Mobile phone 10
 Computer rack 20
 Tomato 10
 Pear 5
 Apple 6
 Mobile phone 10
 Tomato 10
 Pear 5
 Mobile phone 10
 Computer rack 20
 Tomato 10
 Pear 5
 Apple 6
main.py file:
import sys
import os
import math

max_name_width = 5
multiple_reduction = 2
x_axis = ["Tomatoes", "Pear","Apple","Cantaloupe Juice"]
y_axis = [40, 15, 20, 100]

#log analysis:
def get_data(txt):
    global x_axis
    global y_axis
    x_axis =[]
    y_axis =[]
    with open(txt,'r',encoding='utf-8') as file:
        for line in file.readlines():
        	mid_buf=" ".join(line.split())
        	x_axis.append(mid_buf.split(' ')[0])
        	y_axis.append(mid_buf.split(' ')[1])


def get_config(txt):
    global max_name_width
    global multiple_reduction

    with open(txt,'r',encoding='utf-8') as file:
        for line in file.readlines():
        	mid_buf=" ".join(line.split())
        	if "max_name_width" in mid_buf:
        		max_name_width =int(mid_buf.split('=')[1])
        	if "multiple_reduction" in mid_buf:
        		multiple_reduction =int(mid_buf.split('=')[1])


def y_gui():
    global max_name_width
    global multiple_reduction
    global x_axis
    global y_axis
    print("\n ★★★★★★★★★◣︻◢★★★★★★★★★★★★★★★◣︻◢★★★★★★★★★★★★★★◣︻◢★★★★★★★★★★")
    print("       ★★★★★★★★★★★★★★★★★★★★★Test results★★★★★★★★★★★★★★★★★★★★★★")
    print("           ★★★★★★★★★★★★★★★★★★★★★★★★★★★★★★★★★★★★\n")

    for i in range(0,len(x_axis)):
        for j in range(0,math.ceil(int(y_axis[i])/multiple_reduction)):
        	if j==0:
        	    x_buf = "  "+str(x_axis[i])+":"
        	    idle=max_name_width-len(x_axis[i])
        	    idle =idle*2
        	    for x in range(0,idle):
        	    	x_buf = x_buf+" "
        	x_buf = x_buf + "▇"
        print(x_buf+ "  "+str(y_axis[i]))
    print("\n")


def x_gui():
    global multiple_reduction
    global x_axis
    global y_axis
    max_yaxix_width = 25
    x_buf= ""
    y_buf= ""
    idle_buf="      "
    blank_buf="  "
    blank=blank_buf+idle_buf
    print("\n ★★★★★★★★★◣︻◢★★★★★★★★★★★★★★★◣︻◢★★★★★★★★★★★★★★◣︻◢★★★★★★★★★★")
    print("       ★★★★★★★★★★★★★★★★★★★★★Test results★★★★★★★★★★★★★★★★★★★★★★")
    print("           ★★★★★★★★★★★★★★★★★★★★★★★★★★★★★★★★★★★★\n")

    #and and x==len(x_axis)-1 and int(y)==int(y_axis[len(y_axis)-1])
    for g in range(max_yaxix_width,-1,-1):
        for x in range(0,len(x_axis)):
        	if int(math.ceil(int(y_axis[x])/multiple_reduction))>=g  :
        	    #print("  g="+str(g)+"  x="+str(x)+"  y="+y_axis[x] )
        	    y_buf = y_buf +idle_buf+"▇"
        	else :
        		y_buf = y_buf + blank
        		#print("  g="+str(g)+"  x="+str(x)+"  y="+y_axis[x] )

        	if x==len(x_axis)-1 :
        	    y_buf = y_buf + "\n"


    print(y_buf)
    x_buf = "     "
    for x in range(0,len(x_axis)):
    	x_buf = x_buf+x_axis[x]+"   "
    print(x_buf)


def main():
    get_config("config.txt")
    get_data("data.txt")
    x_gui()

if len(sys.argv) < 2 :
    main()
Thanks for watching!!!!