❝ I wanted to write this article a long time ago, but it has been delayed because of some things. ❞
Based on the development of UCSCXenaShiny, I sorted out the UCSCXena TCGA/CCLE single gene data download function supported therein, and constructed a single entry. In this way, even if users do not need to load Shiny, they can easily download cancer single gene data.
❝ TCGA mentioned here alone is not comprehensive. It actually includes three databases of TCGA target GTEX, which are individual level data. CCLE is cell level data. ❞
Download installation package
In China, we recommend downloading the package on Gitee:
remotes::install_git("https://gitee.com/XenaShiny/UCSCXenaShiny")
If you have installed UCSCXenaShiny on CRAN, you also need to do the above operations, otherwise you can't use the latest functions.
Parameter description
The function is just a query_value().
Take a brief look at the parameters:
library(UCSCXenaShiny)
args(query_value)
#> function (identifier, data_type = c("gene", "transcript", "protein",
#>     "mutation", "cnv", "methylation"), database = c("toil", "ccle"))
#> NULL
It's very simple. There are only three:
- The first is gene name / protein name, etc.
- The second is the type of data, including gene expression, transcript expression, mutation, copy number variation (cnv) and methylation. The default is gene expression.
- The third is the database, including coil (including several individual level data such as TCGA mentioned above) and ccle.
use
After you understand the function parameters, you can use them according to your needs. If you don't understand, you can keep trying and making mistakes.
Let's take TP53 gene as an example to download some data.
gene_expr <- query_value("TP53")
#> Running mode: client
#> =========================================================================================
#> UCSCXenaTools version 1.3.3
#> Project URL: https://github.com/ropensci/UCSCXenaTools
#> Usages: https://cran.r-project.org/web/packages/UCSCXenaTools/vignettes/USCSXenaTools.html
#>
#> If you use it in published research, please cite:
#> Wang et al., (2019). The UCSCXenaTools R package: a toolkit for accessing genomics data
#>   from UCSC Xena platform, from cancer multi-omics to single-cell RNA-seq.
#>   Journal of Open Source Software, 4(40), 1627, https://doi.org/10.21105/joss.01627
#> =========================================================================================
#>                               --Enjoy it--
#> Try querying data #1
#> -> Checking if the dataset has probeMap...
#> -> Done. ProbeMap is found.
#> Running mode: client
#> More info about dataset please run following commands:
#>   library(UCSCXenaTools)
#>   XenaGenerate(subset = XenaDatasets == "TcgaTargetGtex_rsem_gene_tpm") %>% XenaBrowse()
The structure of the returned result:
str(gene_expr)
#> List of 2
#>  $ expression: Named num [1:19131] 4.79 5.89 5.52 4.43 2.38 ...
#>   ..- attr(*, "names")= chr [1:19131] "GTEX-S4Q7-0003-SM-3NM8M" "TCGA-19-1787-01" "TCGA-S9-A7J2-01" "GTEX-QV31-1626-SM-2S1QC" ...
#>  $ unit      : chr "log2(tpm+0.001)"
You can view some data:
gene_expr$expression[1:5]
#> GTEX-S4Q7-0003-SM-3NM8M         TCGA-19-1787-01         TCGA-S9-A7J2-01
#>                    4.79                    5.89                    5.52
#> GTEX-QV31-1626-SM-2S1QC         TCGA-G3-A3CH-11
#>                    4.43                    2.38
With this data, we can combine various phenotypes of patients for analysis.
Let's look at its CNV and mutation.
# CNV
gene_cnv <- query_value("TP53", data_type = "cnv")
#> Running mode: client
#> Try querying data #1
#> -> Checking if the dataset has probeMap...
#> -> Done. No probeMap found or error happened, use old way...
#> Running mode: client
#> More info about dataset please run following commands:
#>   library(UCSCXenaTools)
#>   XenaGenerate(subset = XenaDatasets == "TCGA.PANCAN.sampleMap/Gistic2_CopyNumber_Gistic2_all_thresholded.by_genes") %>% XenaBrowse()
gene_cnv$data[1:5]
#> TCGA-A5-A0GI-01 TCGA-S9-A7J2-01 TCGA-06-0150-01 TCGA-AR-A1AH-01 TCGA-EK-A2RE-01
#>               0               0               0              -1               0

# mutation
gene_mut <- query_value("TP53", data_type = "mutation")
#> More info about dataset please run following commands:
#>   library(UCSCXenaTools)
#>   XenaGenerate(subset = XenaDatasets == "mc3.v0.2.8.PUBLIC.nonsilentGene.xena") %>% XenaBrowse()
#> Running mode: client
#> Try querying data #1
#> -> Checking if the dataset has probeMap...
#> -> Done. ProbeMap is found.
#> Running mode: client
gene_mut[1:5]
#> TCGA-02-0003-01 TCGA-02-0033-01 TCGA-02-0047-01 TCGA-02-0055-01 TCGA-02-2470-01
#>               1               1               0               1               0
By simply using the tidyverse package, we can integrate several molecular data:
library(tidyverse)
#> ── Attaching packages ──────────────────────────────────────────────────────────── tidyverse 1.3.0 ──
#> ✓ ggplot2 3.3.2     ✓ purrr   0.3.4
#> ✓ tibble  3.0.3     ✓ dplyr   1.0.2
#> ✓ tidyr   1.1.2     ✓ stringr 1.4.0
#> ✓ readr   1.3.1     ✓ forcats 0.5.0
#> ── Conflicts ─────────────────────────────────────────────────────────────── tidyverse_conflicts() ──
#> x dplyr::filter() masks stats::filter()
#> x dplyr::lag()    masks stats::lag()

expr <- dplyr::tibble(
  sample = names(gene_expr$expression),
  expr = as.numeric(gene_expr$expression)
)

cnv <- dplyr::tibble(
  sample = names(gene_cnv$data),
  cnv = as.numeric(gene_cnv$data)
)

mut <- dplyr::tibble(
  sample = names(gene_mut),
  mut = as.numeric(gene_mut)
)

tp53 <- purrr::reduce(list(expr, cnv, mut), dplyr::full_join, by = "sample")
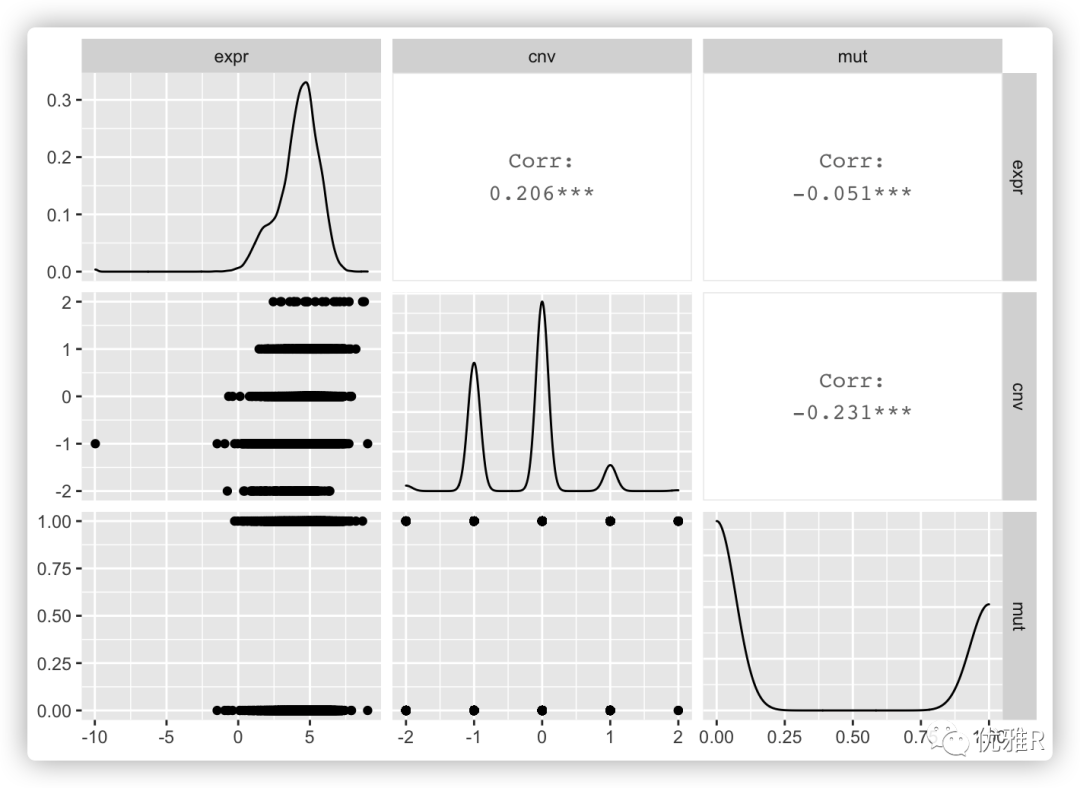
Finally, simply draw a picture:
GGally::ggpairs(tp53[, -1])
#> Registered S3 method overwritten by 'GGally':
#>   method from
#>   +.gg   ggplot2
#> Warning: Removed 1370 rows containing non-finite values (stat_density).
#> Warning in ggally_statistic(data = data, mapping = mapping, na.rm = na.rm, :
#> Removed 11009 rows containing missing values
#> Warning in ggally_statistic(data = data, mapping = mapping, na.rm = na.rm, :
#> Removed 12038 rows containing missing values
#> Warning: Removed 11009 rows containing missing values (geom_point).
#> Warning: Removed 9656 rows containing non-finite values (stat_density).
#> Warning in ggally_statistic(data = data, mapping = mapping, na.rm = na.rm, :
#> Removed 11608 rows containing missing values
#> Warning: Removed 12038 rows containing missing values (geom_point).
#> Warning: Removed 11608 rows containing missing values (geom_point).
#> Warning: Removed 11397 rows containing non-finite values (stat_density).