apply series functions
Hello, everyone. I want to be a big dinosaur 🦖 My birthday letter Xiaobai. Praise first and then see. Form a habit. Little friends who haven't paid attention don't get lost. Today, let's talk about the apply series functions in R language
preface
In R language, apply series functions can apply function operations to vectors, matrices, data frames and overall data at one time, which is very convenient
1, apply() function
Definition: the apply() function applies the specified function in the row or column direction of the matrix.
apply(
  x # Array or matrix
  MARGIN #Direction of application function, 1 row and 2 columns
  FUN # Applied functions
)
# The return value automatically determines the returned Data type according to the Data type of Data and the return value of Fun
Here is an example:
s <- matrix(1:9,ncol = 3)
apply(s,1,sum)
apply(s,2,sum)
The following results can be obtained:
apply(s,1,sum)
[1] 12 15 18
apply(s,2,sum)
[1]  6 15 24
Take an example of iris dataset in R language:
apply(iris[,1:4],2,sum)
The results are as follows:
apply(iris[,1:4],2,sum)
Sepal.Length  Sepal.Width Petal.Length  Petal.Width
       876.5        458.6        563.7        179.9
If you don't know about iris dataset, you can enter iris to view it.
At the same time, the R language also defines the rowSums(),rowMeans(),colSums(),colMeans() function to sum rows and columns and the function of mean value. The way of use is also very simple.
2, lapply() function
Definition: the happy () function returns the result of the function in the form of a list
lapply(
  X #Vector, list, expression, database
  FUN #Applied functions
  ... #Additional parameters are passed to the fun function
)
Examples of continuing to use iris dataset:
lapply(iris[,1:4],mean)
The results are as follows:
lapply(iris[,1:4],mean)
$Sepal.Length
[1] 5.843333

$Sepal.Width
[1] 3.057333

$Petal.Length
[1] 3.758

$Petal.Width
[1] 1.199333
You can see that the result is returned as a list, and you can use the unlist() function to convert the result into a vector.
unlist(
  #Convert list to vector
  X #R object
  recursive = FALSE #Whether to recursively convert the list in x
  use.names = TRUE #Keep value names in the list
)
unlist(lapply(iris[,1:4],mean))
The results are as follows:
unlist(lapply(iris[,1:4],mean))
Sepal.Length  Sepal.Width Petal.Length  Petal.Width
    5.843333     3.057333     3.758000     1.199333
3, sapply() function
The sapply() function is similar to the sapply() function, and the result is returned in the data type of matrix and vector.
Definition: apply the specified function to list, vector, expression data, etc., and then return the result in the form of vector or matrix.
sapply(
  X #Vector, list, expression, database
  FUN #Applied functions
  ... #Additional parameters are passed to the fun function
)
The iris dataset is also used as an example:
sapply(iris[,1:4], sum)
The results are as follows:
sapply(iris[,1:4], sum)
Sepal.Length  Sepal.Width Petal.Length  Petal.Width
       876.5        458.6        563.7        179.9
When the fun function has only one return value, the sapply () function returns the vector containing these values. If the result of the fun function is a vector greater than 1, the sapply() function returns a matrix.
Examples are as follows:
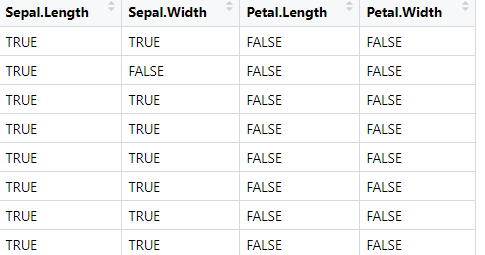
x <- sapply(iris[,1:4], function(x)  {x >3})
class(x)
The results are as follows:
class(x)
[1] "matrix"
The data is shown in the figure below:
4, tapply() function
Definition: group the data saved in the vector according to the given standard, then apply the specified function to each group and return the result.
tapply(
  X #vector
  INDEX #Data grouping index
  FUN #Applied functions
  ... #Additional parameters
)
for instance:
tapply(1:10,rep(1:2,5),sum)
The results are as follows:
tapply(1:10,rep(1:2,5),sum)
 1  2
25 30
In the example, 1:10 represents data from 1 to 10, and rep(1:2,5) represents repeating 1 to 2 for 5 times. 1, 3, 5, 7 and 9 belong to group 1, and 2, 4, 6, 8 and 10 belong to group 2. Sum them and get the result of the appeal.
Take iris dataset as an example:
tapply(iris$Sepal.Length,iris$Species,sum)
The results are as follows:
tapply(iris$Sepal.Length,iris$Species,sum)
    setosa versicolor  virginica
     250.3      296.8      329.4
Create a sales data:
m <- matrix(1:8,ncol = 2,
            dimnames = list(c("spring","summer","autumn","winter"),
                            c("female","male")))

For this data, the sum of autumn sales in the first and second half of autumn and gender respectively.
The code is as follows:
tapply(m, list(c(1,1,2,2,1,1,2,2),
               c(1,1,1,1,2,2,2,2)), sum)
The results are as follows:
tapply(m, list(c(1,1,2,2,1,1,2,2),
+                c(1,1,1,1,2,2,2,2)), sum)
  1  2
1 3 11
2 7 15
Here, the location of each data is indexed, grouped, and then summed.
5, Map() function
Definition: pass the parameters given in the form of list or vector to the specified function and return the function execution result.
mapply(
  FUN #Applied functions
  ... #Parameters to be passed
)
Example of continuing to use iris dataset (hahaha):
mapply(sum,iris[,1:4])
The results are as follows:
mapply(sum,iris[,1:4])
Sepal.Length  Sepal.Width Petal.Length  Petal.Width
       876.5        458.6        563.7        179.9
summary
That's what I'm going to talk about today. I see that the little partner here gave it to the big dinosaur 🦖 Little praise, little attention! If you have questions, you can leave a message!