To analyze whether there are excess deaths in the cohort, the standard population mortality is usually used to correct. The actual number of deaths (d) in the immediate observation and a standard number of deaths (E). The ratio of D to e is called the standardized mortality ratio (SMR). The standardized mortality rate (SMR) is the ratio of observed cases to expected cases
Therefore, incidence rate incidence rate and incidence rate are two. We use R language ems package to demonstrate the SMR.
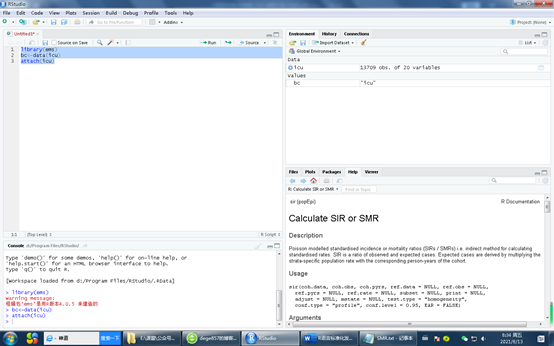
First, import the R package and its own ICU data
library(ems)
bc<-data(icu)
attach(icu)

Let's take a look at the data structure first. There are many data with long names. The following figure only shows some of them. Unit The name of the ICU unit: ICU unit name, Age Patient age, patient age, Gender, male = 1, female = 0, UnitAdmissionDateTimeICU check-in date and time, UnitDischargeDateTimeICU discharge date and time, UnitDischargeName outcome: death = 1, UnitDestinationName ICU hospitalization date, HospitalDischargeDate, HospitalDischargeName hospitalization result, LengthHospitalStayPriorUnitAdmission hospitalization time before admission, LengthHospitalStayPriorUnitAdmission source of ICU patients before admission, admissiontypename_ Pri admission as clinical treatments: 1 Drugs 2 Elective surgery 3 emergency surgery
Vasopressors_D1 whether pressor is required, whether mechanical ventilation is required for 1h, Charlson comorbidityindex complication index, Saps3Points SAPS 3 score, estimated probability of death,
Sofascolesofa score.

Although there are a lot of data in the article, we don't use much. First, we change the classified variables into factors and label some variables
attr(icu, "var.labels")[match(c("Unit", "IsMechanicalVentilation1h",
                                "AdmissionTypeName_pri","Vasopressors_D1"), names(icu))] <-
  c("ICU unit","Mechanichal ventilation","Admission type","Vasopressors at admission")
icu$Saps3DeathProbabilityStandardEquation <- icu$Saps3DeathProbabilityStandardEquation /100###Divided by 100 becomes a ratio
icu$IsMechanicalVentilation1h <- as.factor(ifelse(icu$IsMechanicalVentilation1h == 1, "Yes", "No"))
icu$AdmissionTypeName_pri <- as.factor(icu$AdmissionTypeName_pri)
levels(icu$AdmissionTypeName_pri) <- c("Clinical","Elective surgery", "Urgent surgery")
icu$Vasopressors_D1 <- as.factor(ifelse(icu$Vasopressors_D1 == 1, "Yes", "No"))
After processing the data, we can analyze that there are two main mortality rates in this article, one is the actual mortality rate of UnitDischargeName index, and the other is the predicted mortality rate composed of SOFA score
SMR(icu$UnitDischargeName, icu$Saps3DeathProbabilityStandardEquation)

OK, the actual number of deaths, the predicted number of deaths, SMR and confidence interval are all out. We can also calculate the SMR and confidence interval of the group. If we want to know whether there is any difference between the SMR on the ventilator or not,
x1 <- SMR.table(data = icu, obs.var = "UnitDischargeName",
               pred.var = "Saps3DeathProbabilityStandardEquation",
               group.var = c( "IsMechanicalVentilation1h"),
               reorder = "no",
               decreasing = TRUE,
               use.label = TRUE)### obs.var is the variable of actual death, PRED VaR is a variable for predicting death

If we want more groups
x <- SMR.table(data = icu, obs.var = "UnitDischargeName",
               pred.var = "Saps3DeathProbabilityStandardEquation",
               group.var = c( "IsMechanicalVentilation1h",
                              "AdmissionTypeName_pri","Vasopressors_D1"),
               reorder = "no",
               decreasing = TRUE,
               use.label = TRUE)

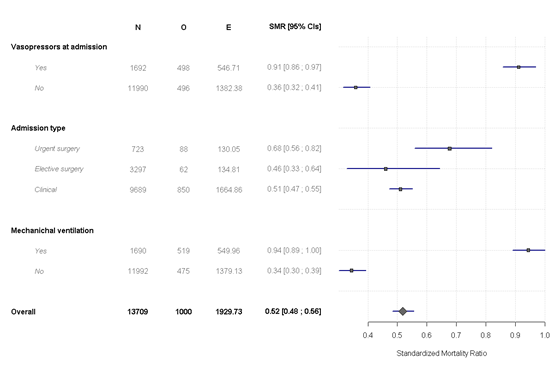
You can also make a visual view of the data
forest.SMR(x, digits = 2)

