1, Introduction of PWM and PFM
Motif refers to the DNA sequence pattern that transcription factors prefer to bind or the sequence pattern that RNA binding proteins prefer to bind. PWM is generally used to represent motif.
The process of making PWM is as follows:
- First, calculate the base frequency of each position of all sequences to obtain PFM(Position Frequency)
Matrix), which can be used as the input of ggseqlogo package to draw motif diagram. - PPM(Position Probability) can be further calculated through PFM
Matrix) represents the position frequency matrix, which is the matrix obtained after calculating the occurrence frequency of four bases at each position. This PPM matrix can be used as TOMTOM The input of is compared with other motif databases. - Divide the frequency in PPM by the base background frequency, and then take the logarithm (log2) to obtain PWM(Position
Weight matrix.
Making an example of PWM data can refer to what I wrote before Blog.
The following describes how to use R language to calculate the PFM and PPM of motif. The code refers to ggseqlogo source code And modified and annotated.
2, PFM and PPM are made by hand according to the base sequence
Goal to achieve: input n DNA or RNA sequences with the same length, and return PFM or PPM that can characterize the motif.
1. Main implementation functions
letterMatrix <- function(input){
  # Ensure kmers are the same length characters(ggseqlogo)
  # First, ensure that the length of the input base sequence is consistent
  seq.len = sapply(input, nchar) # Calculate the number of bases in each sequence
  num_pos = seq.len[1] # Number of bases in the first sequence
  if(! all(seq.len == num_pos)) { # The number of bases of all sequences must be the same. If not, an error will be reported
    stop('Sequences in alignment must have identical lengths')
  }

  # Construct matrix of letters(ggseqlogo)
  # Next, build a matrix, each element is a base
  split = unlist( sapply(input, function(seq){strsplit(seq, '')}) ) # strsplit can cut strings into individual characters

  t( matrix(split, seq.len, length(split)/num_pos) )
}

make_ppm <- function(seqs, ppm=TRUE, seq_type="dna") {
  # seqs: A vector of strings, each string is a DNA or RNA sequence
  # ppm: Whether to return PPM, default is PPM, else return PFM
  # seq_type: Sequence type, can be "dna" of "rna"

  letter_mat = letterMatrix(seqs) # Construct a base matrix, each row is a sequence, and each column is the base position

  # Get namespace(ggseqlogo)
  if(seq_type == "dna") {
    namespace = c("A", "T", "G", "C")
  } else if (seq_type == "rna" ) {
    namespace = c("A", "U", "G", "C")
  } else {
    stop('Wrong seq_type! Must be one of "dna" and "rna".')
  }

  # Construct PWM(ggseqlogo)
  pfm_mat = apply(letter_mat, 2, function(pos.data){ # The second parameter of apply is 2, which indicates the operation on the column
    # Get frequencies (ggseqlogo)
    t = table(pos.data) # Calculate the frequency of four bases at this position
    # Match to aa(ggseqlogo)
    ind = match(namespace, names(t)) #
    # Create column(ggseqlogo)
    col = t[ind] #
    col[is.na(col)] = 0
    names(col) = namespace

    if(ppm) { # If PPM is returned, divide the base frequency by the total number of bases in this column
      col = col / sum(col)
    }
    col # Function return value col
  })

  num_pos = nchar(seqs[1])
  colnames(pfm_mat) = 1:num_pos
  pfm_mat

}
The usage is as follows:
seqs <- c("CGTAA", "ATTAG", "CTAAG", "ATTAA", "CATAA")
# Calculate ppm (input format of TomTom)
ppm <- make_ppm(seqs, ppm=TRUE)
ppm
##     1   2   3 4   5
## A 0.4 0.2 0.2 1 0.6
## T 0.0 0.6 0.8 0 0.0
## G 0.0 0.2 0.0 0 0.4
## C 0.6 0.0 0.0 0 0.0
# Calculate PFM(ggseqlogo input format)
pfm <- make_ppm(seqs, ppm=FALSE) # ppm=FALSE, PFM is output
pfm
##   1 2 3 4 5
## A 2 1 1 5 3
## T 0 3 4 0 0
## G 0 1 0 0 2
## C 3 0 0 0 0
2. Achieve results
ggseqlogo package can accept a string vector storing base sequence or PFM to draw motif
logo, we will use these two methods to draw motif for 5 DNA and RNA sequences in turn
logo to verify that the PFM calculated manually is consistent with the result calculated by the package.
2.1 making motif logo of DNA
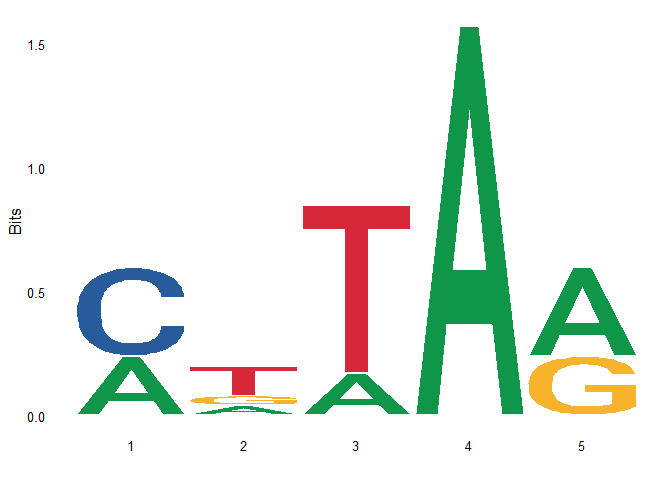
First, use ggseqlogo to draw the motif logo of these five sequences, as shown in the following figure
# install.packages('ggseqlogo')
library('ggseqlogo')

seqs <- c("CGTAA", "ATTAG", "CTAAG", "ATTAA", "CATAA")
ggseqlogo(seqs)
## Warning: `guides(<scale> = FALSE)` is deprecated. Please use `guides(<scale> =
## "none")` instead.
Next, use the above customized function to calculate the PFM, and then draw the motif logo:
seqs <- c("CGTAA", "ATTAG", "CTAAG", "ATTAA", "CATAA")
pfm <- make_ppm(seqs, ppm=FALSE)
pfm
##   1 2 3 4 5
## A 2 1 1 5 3
## T 0 3 4 0 0
## G 0 1 0 0 2
## C 3 0 0 0 0
ggseqlogo(pfm)
## Warning: `guides(<scale> = FALSE)` is deprecated. Please use `guides(<scale> =
## "none")` instead.
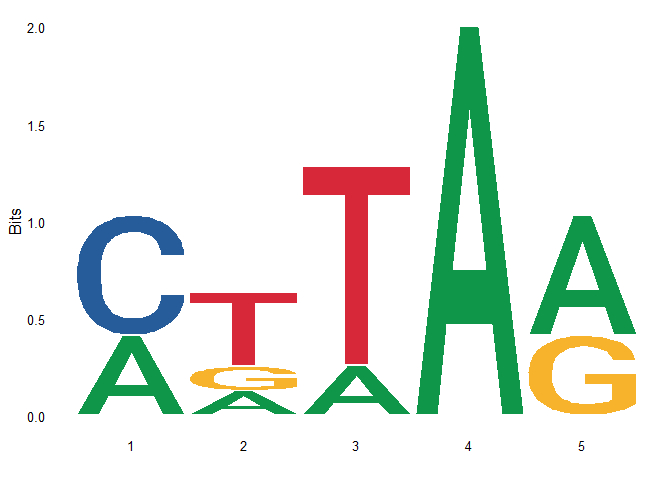
You can see that the result of drawing is the same as that of using ggseqlogo directly.
This code can also calculate ppm (the format required by TomTom), as shown below:
seqs <- c("CGTAA", "ATTAG", "CTAAG", "ATTAA", "CATAA")
pfm <- make_ppm(seqs)
pfm
##     1   2   3 4   5
## A 0.4 0.2 0.2 1 0.6
## T 0.0 0.6 0.8 0 0.0
## G 0.0 0.2 0.0 0 0.4
## C 0.6 0.0 0.0 0 0.0
2.2 making motif logo of RNA
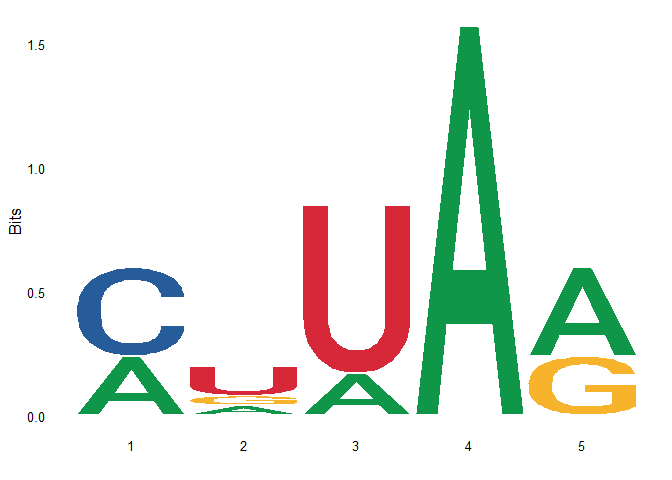
First draw the motif logo with ggseqlogo as follows:
# install.packages('ggseqlogo')
library('ggseqlogo')

seqs <- c("CGUAA", "AUUAG", "CUAAG", "AUUAA", "CAUAA")
ggseqlogo(seqs)
## Warning: `guides(<scale> = FALSE)` is deprecated. Please use `guides(<scale> =
## "none")` instead.
Using make_ppm function is used to calculate PFM, and seq needs to be specified when calculating RNA_ Type = "RNA", the code is as follows:
seqs <- c("CGUAA", "AUUAG", "CUAAG", "AUUAA", "CAUAA")
pfm <- make_ppm(seqs, ppm=FALSE, seq_type='rna')
pfm
##   1 2 3 4 5
## A 2 1 1 5 3
## U 0 3 4 0 0
## G 0 1 0 0 2
## C 3 0 0 0 0
ggseqlogo(pfm)
## Warning: `guides(<scale> = FALSE)` is deprecated. Please use `guides(<scale> =
## "none")` instead.
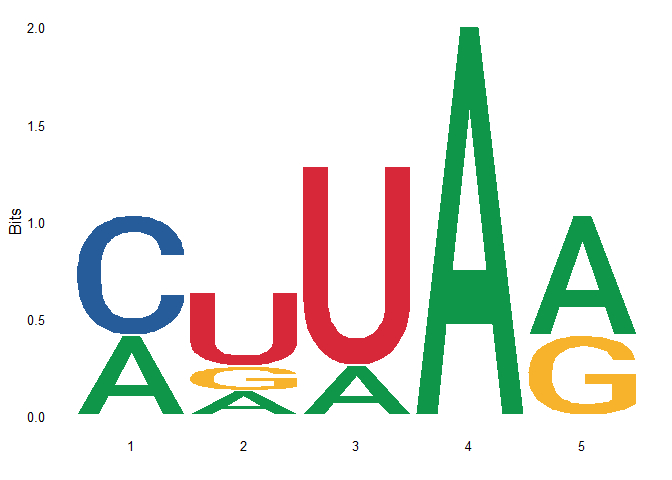
The result of the above logo is the same as that of ggseqlogo.
3, PFM - > ppm - > PWM
The above realizes the production of PFM and PPM according to the base sequence, but what if there is already PFM? With PFM, you can calculate PPM and PWM in turn. Write the code of PFM - > PPM - > PWM below.
- PFM->PPM
The code is as follows,
pfm2ppm <- function(pfm) {
  ppm <- apply(pfm, 2, function(col) {col / sum(col)} ) # yes
  return(ppm)
}

# Examples
seqs <- c("CGTAA", "ATTAG", "CTAAG", "ATTAA", "CATAA")
pfm <- make_ppm(seqs, ppm=FALSE)
pfm
##   1 2 3 4 5
## A 2 1 1 5 3
## T 0 3 4 0 0
## G 0 1 0 0 2
## C 3 0 0 0 0
ppm_ori <- make_ppm(seqs)
ppm_ori
##     1   2   3 4   5
## A 0.4 0.2 0.2 1 0.6
## T 0.0 0.6 0.8 0 0.0
## G 0.0 0.2 0.0 0 0.4
## C 0.6 0.0 0.0 0 0.0
ppm <- pfm2ppm(pfm)
ppm
##     1   2   3 4   5
## A 0.4 0.2 0.2 1 0.6
## T 0.0 0.6 0.8 0 0.0
## G 0.0 0.2 0.0 0 0.4
## C 0.6 0.0 0.0 0 0.0
ppm_ori == ppm
##      1    2    3    4    5
## A TRUE TRUE TRUE TRUE TRUE
## T TRUE TRUE TRUE TRUE TRUE
## G TRUE TRUE TRUE TRUE TRUE
## C TRUE TRUE TRUE TRUE TRUE
# The PPM calculated by the two methods is consistent.
- PPM->PWM
From PPM to PWM, you need to divide PPM by the background frequency of each base (generally, the background frequency of the four bases is 0.25), and then take logarithm (log2) to get PWM. The code is as follows:
ppm2pwm <- function(ppm) {
  pwm <- log2(ppm / 0.25)
  pwm[is.infinite(pwm)] <- 0 # The base with frequency 0 is negative infinity after taking the logarithm, so it needs to be set to 0
  return(pwm)
}

seqs <- c("CGTAA", "ATTAG", "CTAAG", "ATTAA", "CATAA")
ppm <- make_ppm(seqs)
ppm
##     1   2   3 4   5
## A 0.4 0.2 0.2 1 0.6
## T 0.0 0.6 0.8 0 0.0
## G 0.0 0.2 0.0 0 0.4
## C 0.6 0.0 0.0 0 0.0
pwm <- ppm2pwm(ppm)
pwm
##           1          2          3 4         5
## A 0.6780719 -0.3219281 -0.3219281 2 1.2630344
## T 0.0000000  1.2630344  1.6780719 0 0.0000000
## G 0.0000000 -0.3219281  0.0000000 0 0.6780719
## C 1.2630344  0.0000000  0.0000000 0 0.0000000
- Directly read in the PFM matrix and calculate the PPM, and then use ggseqlogo to draw the picture
seqs_text <- '  1 2 3 4 5
A 2 1 1 5 3
T 0 3 4 0 0
G 0 1 0 0 2
C 3 0 0 0 0'
seqs_pfm <- read.table(text=seqs_text)
# Calculate PPM
pfm2ppm(seqs_pfm)
##    X1  X2  X3 X4  X5
## A 0.4 0.2 0.2  1 0.6
## T 0.0 0.6 0.8  0 0.0
## G 0.0 0.2 0.0  0 0.4
## C 0.6 0.0 0.0  0 0.0
# Direct drawing
library(ggseqlogo)
ggseqlogo(as.matrix(seqs_pfm))
## Warning: `guides(<scale> = FALSE)` is deprecated. Please use `guides(<scale> =
## "none")` instead.

4, To be optimized
- Optimize the code so that it can automatically determine whether the input type is DNA or RNA, that is, there is no need to specify seq_type parameter.
- The blog post needs to change the number and put the code on it by the way.