SSH (secure shell) is the most common remote management protocol for Linux based systems, routers, switches, firewalls, devices and other assets. Although the SSH daemon provides Excellent enhancements, Your to enhance Authentication method and access control However, SSHD does not provide native monitoring.
This blog post details how to use In ELK stack Kibana (Elasticsearch, Logstash and kibana) converts SSH log files into real-time and interactive open source SIEM (security information and Event Management) dashboards. This way, you know who is knocking and gaining visibility in the SSH session. Figure 1 shows the real-time dashboard. The left side of this security dashboard shows failed SSH operations, while the right side shows successful SSH sessions:
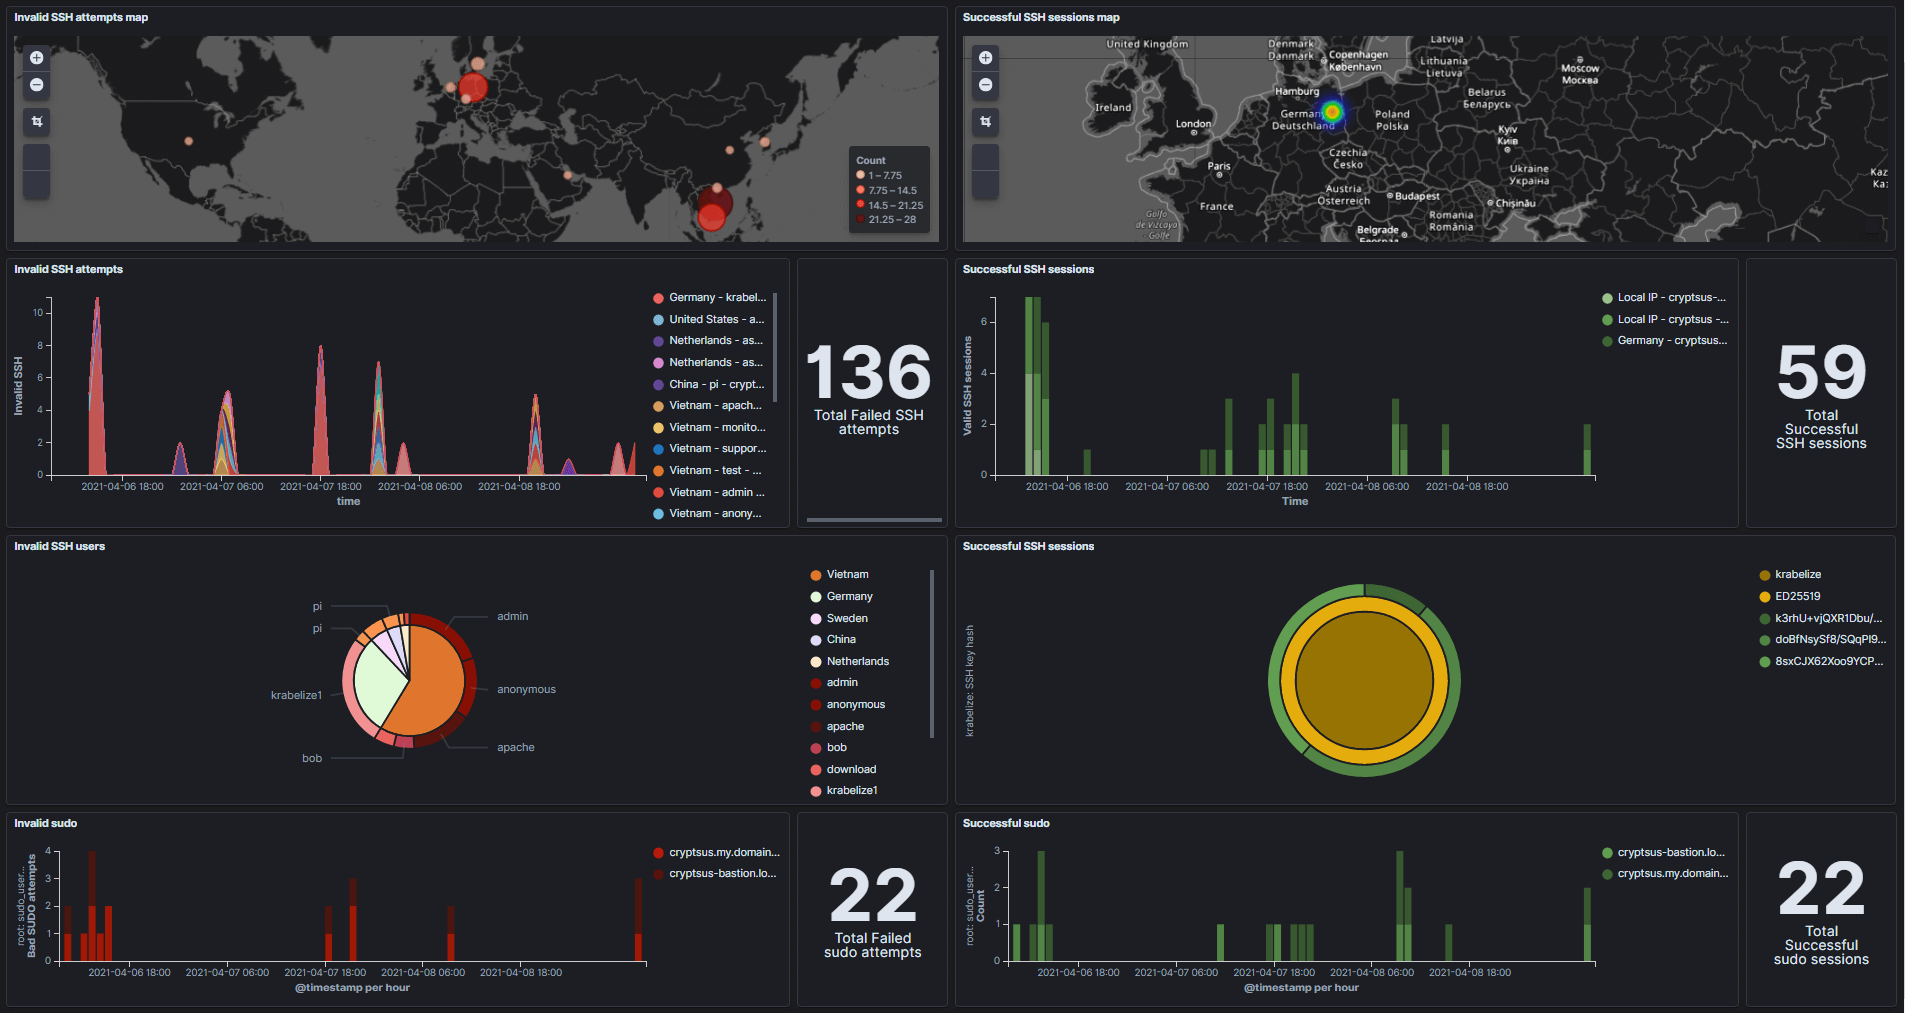
Figure 1: SSH security dashboard
This data and dashboard may be useful when:
-Your SSH key pair is stolen / copied / cracked and used by malicious participants to log in.
-Exploit (Web application) vulnerability and perform privilege upgrade, which leads to sudo privilege / root access, or generate and configure secondary SSH key pair.
-Perform parallel attacks on gateway, management and Web / application servers, and you want to use SSH and sudo log data for threat search.
-Configuration errors in SSHD or sudo configurations can lead to a large number of logins and promotions.
set up
You can host the centralized ELK stack yourself or take advantage of it Azure or Elastic Cloud ELK PaaS. The latter is essentially a cloud native SIEM solution.
SSHD log has nothing to do with the operating system, which means that even if you are running Debian, Red Hat or Ubuntu based system, if you are running OpenBSD version, the format of SSH log entries should be unified. However, the time / date representation may be inconsistent and should be standardized in Logstash.
Log data flow pipeline
SSH log files need to go through several workstations before we can get a shiny real-time security dashboard for monitoring purposes. Figure 2 shows the data flow process for log forwarding, collection, analysis and visualization:

Figure 2: log data flow from SSH source to SIEM
Step 1: starting from the source, SSH authentication attempts and session activities are automatically attached to the / var / log / authlog log log file. The contents of SSH authlog file are as follows:
<span style="color:#000000"><code>$ tail /var/log/authlog

Apr 15 12:55:28 cryptsus-bastion sshd[25158]: Connection from 61.61.61.61 port 35444 on 209.209.209.209 port 22 rdomain "0"
Apr 15 12:55:58 cryptsus-bastion sshd[25158]: fatal: Timeout before authentication for 61.61.61.61 port 35444
Apr 15 12:56:30 cryptsus-bastion sshd[35310]: Connection from 61.61.61.61 port 13361 on 209.209.209.209 port 22 rdomain "0"
Apr 15 12:56:54 cryptsus-bastion sshd[7145]: Connection from 95.95.95.95 port 10265 on 209.209.209.209 port 22 rdomain "0"
Apr 15 12:56:55 cryptsus-bastion sshd[7145]: Accepted key ED25519 SHA256:doBfNsySf8/sA29ak2aBl29Aksdliuj2923lA23a/G4lcZs found at /home/$USERNAME/.ssh/authorized_keys:3
Apr 15 12:56:55 cryptsus-bastion sshd[7145]: Postponed publickey for krabelize from 95.95.95.95 port 10265 ssh2 [preauth]
Apr 15 12:56:55 cryptsus-bastion sshd[7145]: Accepted key ED25519 SHA256:doBfNsySf8/sA29ak2aBl29Aksdliuj2923lA23a/G4lcZs found at /home/$USERNAME/.ssh/authorized_keys:3
Apr 15 12:56:55 cryptsus-bastion sshd[7145]: Accepted publickey for krabelize from 95.95.95.95 port 10265 ssh2: ED25519 SHA256:doBfNsySf8/sA29ak2aBl29Aksdliuj2923lA23a/G4lcZs
Apr 15 12:56:55 cryptsus-bastion sshd[7145]: User child is on pid 73005
Apr 15 12:56:55 cryptsus-bastion sshd[73005]: Starting session: shell on ttyp0 for krabelize from 95.95.95.95 port 10265 id 0
</code></span>
Step 2: the local rsyslogd daemon (remote syslog) or Filebeat agent forwards each new log entry to the centralized Logstash server, which encrypts the log traffic on the network through the combination of TLS and CA certificate, and sends it through TCP (reliable logging). Rsyslogd is inherent in Linux, and Filebeat is Elastic's third-party agent, which needs to be installed first.
Step 3: use Logstash to standardize the data into JSON format. We use grok filter Create mapping fields to create variables (for example, convert IPv4 and IPv6 addresses to geo IP points):
<span style="color:#000000"><code>%{MONTH:month}(%{SPACE})?%{MONTHDAY:day} %{TIME:time} %{HOSTNAME:hostname} %{WORD}\[%{NUMBER:ssh_session_id}\]: Invalid user %{USER:ssh_user} from %{IPV4:ssh_source_ip} port %{NUMBER:ssh_source_port}
%{MONTH:month}(%{SPACE})?%{MONTHDAY:day} %{TIME:time} %{HOSTNAME:hostname} %{WORD}\[%{NUMBER:ssh_session_id}\]: %{DATA} %{WORD:ssh_auth_type} for %{USER:ssh_user} from %{IPV4:ssh_source_ip} port %{NUMBER:ssh_source_port} %{NOTSPACE} %{WORD:ssh_key_type} %{NOTSPACE:ssh_hash_type}:%{NOTSPACE:ssh_hash}
%{MONTH:month}(%{SPACE})?%{MONTHDAY:day} %{TIME:time} %{HOSTNAME:hostname} %{WORD}\[%{NUMBER:ssh_session_id}\]: Starting session: shell on %{DATA:ssh_shell} for %{USER:ssh_user} from %{IPV4:ssh_source_ip} port %{NUMBER:ssh_source_port} %{DATA}
%{MONTH:month}(%{SPACE})?%{MONTHDAY:day} %{TIME:time} %{HOSTNAME:hostname} %{DATA} %{USER:user} to %{USER:sudo_user} on %{DATA:ssh_shell}
</code></span>
Step 4: Elasticsearch stores log entries and allows us to filter the Logstash variable so that only relevant data is selected.
Step 5: we use Kibana to create visualizations based on Elasticsearch search search filter and add these visualizations to our SSH security dashboard.
Step 6: the security analyst accesses the Kibana dashboard through the Web GUI through port 443 or SSH tunnel or port forwarding. You can also use the real-time Kibana dashboard to hang the flat screen on the wall like SOC (security operation center).
Since log entries are automatically and autonomously forwarded locally to the centrally managed ELK stack through rsyslog, malicious activities will also be automatically recorded and forwarded (unless the network session is hijacked or blocked by the malicious participant). We should use this automatic forwarding mechanism to give full play to our advantages. If specific thresholds or variables are met, alerts can be configured, such as a successful malicious login from an unrelated country.
Tips: First, strengthen the SSH daemon Then apply the monitoring / SIEM logging filter. This will eliminate noise and false positives.
Kibana SSH security dashboard
The results are shown again below, where we can see where the failed SSH attempt originated (Figure 1). Next, we will see the schedule of failed SSH attempts, sorted by county and date / time. In this way, we can find SSH brute force attacks in real time. You can also use this dashboard for the Honeypot system.
Next, you will see a breakdown of invalid SSH attempts, sorted by country and SSH user name. This pie chart allows you to better understand the attack path taken by the attacker.
Finally, we will also visualize failed sudo attempts over time.
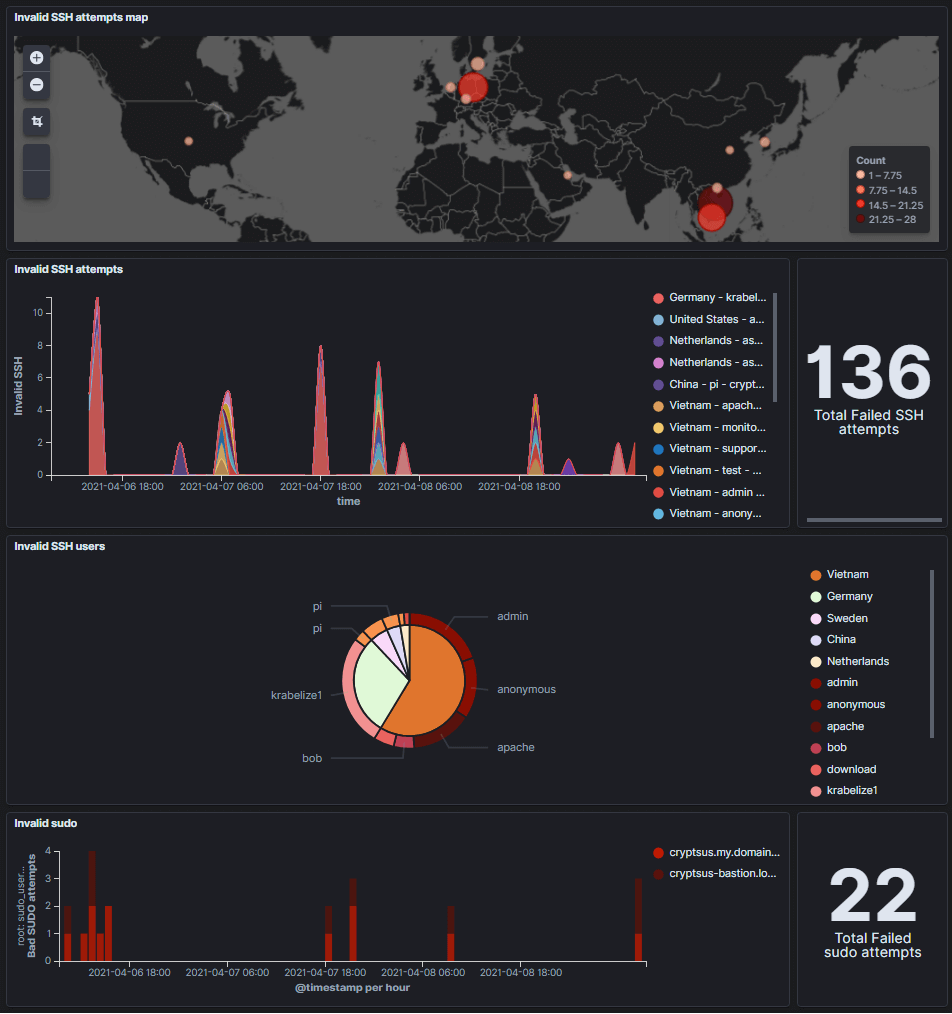
Figure 3: real time failed SSH session
Figure 4 shows the opposite of Figure 3, a successful SSH session. This is important because you may infer from this information false positives and SSH traffic diversion.
Below, you can view the IP address of successful login. Note that geo IP conversion is not always accurate, and malicious actors can use server methods to hide their real geographical location. Next, you can see which assets passed a successful SSH authentication session and at what date / time.
We are also interested in SSH authentication methods. We can see that only SSH public key is used instead of password authentication. Next, the SSH fingerprint associated with the ed25519 public key is displayed.
Finally, record all successful promotion sudo operations. Logically, these sudo operations should match the timestamp of successful SSHD authentication.

Figure 4: real time successful SSH session
You can now correlate and summarize data from other sources. Collect logs from Web services, databases, firewalls, IDS, HIDS, LDAP / AD servers, AWS / Azure platforms and all other sources. In this way, you can see information in the whole IT environment, and can conduct reconnaissance and even horizontal movement by associating events and data. Hunting happiness threat!