Author: Lao Wang Tan operation and maintenance
https://www.toutiao.com/a6691523026984370699/
What is the performance of mysql running? Is the parameter setting reasonable? Is there any hidden danger in the account setting?
As the saying goes, if you want to be good at something, you must first make use of the device. Regular physical examination of your MYSQL database is an important means to ensure the safe operation of the database.
Today, I'd like to share with you some mysql optimization tools. You can use them to conduct a physical examination of your mysql, generate an awr report, and let you grasp the performance of your database as a whole.
1,mysqltuner-pl
This is a common database performance diagnostic tool for mysql. It mainly checks the rationality of parameter settings, including log files, storage engine, security recommendations and performance analysis. In view of the potential problems, it is a good helper for mysql optimization to give suggestions for improvement.
In the previous version, MySQL runner supports about 300 indicators of MySQL / MariaDB / Percona Server.
Project address: https://github.com/major/MySQLTuner-perl
1.1 download
[root@localhost ~]#wget https://raw.githubusercontent.com/major/MySQLTuner-perl/master/mysqltuner.pl
1.2 use
[root@localhost ~]# ./mysqltuner.pl --socket /var/lib/mysql/mysql.sock >> MySQLTuner 1.7.4 - Major Hayden <major@mhtx.net> >> Bug reports, feature requests, and downloads at http://mysqltuner.com/ >> Run with '--help' for additional options and output filtering\[--\] Skipped version check for MySQLTuner scriptPlease enter your MySQL administrative login: rootPlease enter your MySQL administrative password: \[OK\] Currently running supported MySQL version 5.7.23\[OK\] Operating on 64-bit architecture
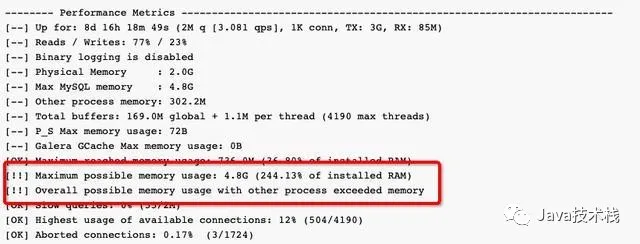
1.3 report analysis
1) Important attention [!] (items with exclamation mark in brackets) for example [!] Maximum possible memory usage: 4.8G (244.13% of installed RAM), indicating that the memory has been used excessively.
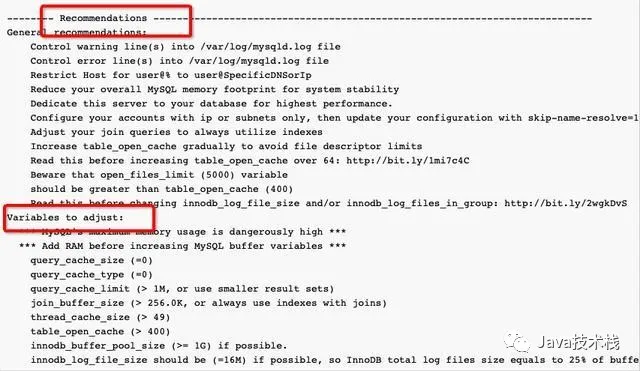
2) Follow the final Recommendations.
2,tuning-primer.sh
This is another optimization tool of MySQL. It is a physical examination for the whole mysql, and gives optimization suggestions for potential problems.
Project address: https://github.com/BMDan/tuning-primer.sh
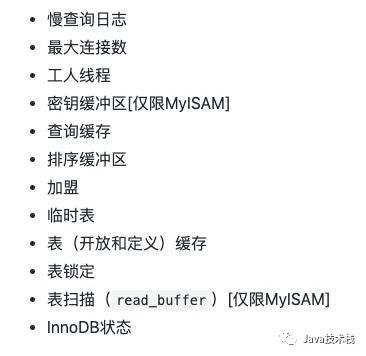
At present, suggestions for supporting detection and optimization are as follows:
2.1 download
[root@localhost ~]#wget https://launchpad.net/mysql-tuning-primer/trunk/1.6-r1/+download/tuning-primer.sh
2.2 use
[root@localhost ~]#  [root@localhost dba]#  ./tuning-primer.sh

-- MYSQL PERFORMANCE TUNING PRIMER --
- By: Matthew Montgomery -
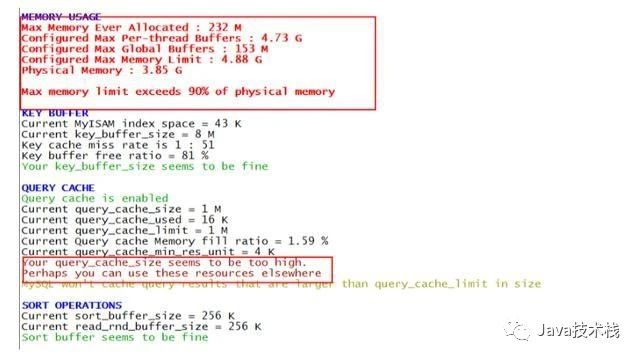
2.3 report analysis
Focus on the option with red alarm, and modify it according to the suggestion combined with the actual situation of your system, for example:
3,pt-variable-advisor
PT variable advisor can analyze MySQL variables and make suggestions on possible problems.
3.1 installation
https://www.percona.com/downloads/percona-toolkit/LATEST/
[root@localhost ~]#wget https://www.percona.com/downloads/percona-toolkit/3.0.13/binary/redhat/7/x86\_64/percona-toolkit-3.0.13-re85ce15-el7-x86\_64-bundle.tar\[root@localhost ~\]#yum install percona-toolkit-3.0.13-1.el7.x86_64.rpm
3.2 use
pt variable advisor is a sub tool of pt tool set, which is mainly used to diagnose whether your parameter settings are reasonable.
[root@localhost ~]# pt-variable-advisor localhost --socket /var/lib/mysql/mysql.sock
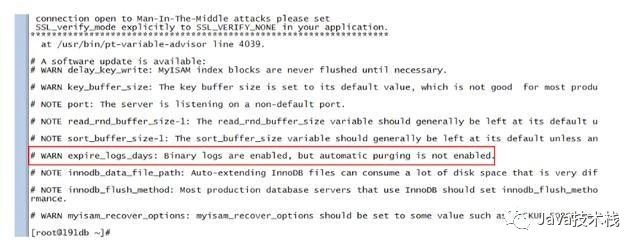
3.3 report analysis
Focus on items with WARN information, such as:
4,pt-qurey-digest
The main function of Pt query digest is to analyze MySQL query from log, process list and tcpdump.
4.1 installation
Refer to Section 3.1 for details
4.2 use
PT query digest is mainly used to analyze the slow log of mysql. Compared with mysql dumpshow, the analysis result of Py query digest is more specific and perfect.
[root@localhost ~]# pt-query-digest /var/lib/mysql/slowtest-slow.log
4.3 common usage analysis
1) Direct analysis of slow query files:
pt-query-digest /var/lib/mysql/slowtest-slow.log > slow_report.log
2) Analyze queries in the last 12 hours:
pt-query-digest --since=12h /var/lib/mysql/slowtest-slow.log > slow_report2.log
3) Analyze queries within the specified time range:
pt-query-digest /var/lib/mysql/slowtest-slow.log --since '2017-01-07 09:30:00' --until '2017-01-07 10:00:00'> > slow_report3.log
4) Analysis refers to slow query with select statement
pt-query-digest --filter '$event->{fingerprint} =~ m/^select/i' /var/lib/mysql/slowtest-slow.log> slow_report4.log
5) Slow query for a user
pt-query-digest --filter '($event->{user} || "") =~ m/^root/i' /var/lib/mysql/slowtest-slow.log> slow_report5.log
6) Query all full table scans or full join slow queries
pt-query-digest --filter '(($event->{Full\_scan} || "") eq "yes") ||(($event->{Full\_join} || "") eq "yes")' /var/lib/mysql/slowtest-slow.log> slow_report6.log
4.4 report analysis
Part I: overall statistical results
Overall: how many queries are there in total Time range: Time range of query execution unique: number of unique queries, that is, how many different queries are there in total after parameterization of query conditions total: total min: minimum max: maximum avg: average 95%: arrange all values from small to large, and the number whose location is at 95%, which is generally the most valuable reference Median: median, arrange all values from small to large, and place them in the middle
Part II: query grouping statistics results
Rank: rank of all statements. By default, it is arranged in descending order of query time. Specify Query ID: statement ID through -- order by, (remove redundant spaces and text characters, and calculate hash value). Response: total response time: total time of the query in this analysis. calls: execution times, that is, how many query statements of this type are there in this analysis R/Call: average response time per execution V/M: ratio of response time variance to mean Item: query object
Part 3: detailed statistical results of each query
ID: the ID number of the query, which corresponds to the Query ID in the figure above Databases: database name Users: the number of times each user executes (proportion) Query_time distribution: query time distribution, with the length reflecting the proportion of the interval. Tables: table Explain: SQL statement involved in the query.
Recommend to my blog to read more:
1.Java JVM, collection, multithreading, new features series
2.Spring MVC, Spring Boot, Spring Cloud series tutorials
3.Maven, Git, Eclipse, Intellij IDEA series tools tutorial
4.Latest interview questions of Java, backend, architecture, Alibaba and other large factories
Life is beautiful. See you tomorrow