I. Overview
Elastic search is an open source distributed search engine. Its characteristics include: distributed, zero configuration, automatic discovery, automatic index segmentation, index copy mechanism, restful style interface, multiple data sources, automatic search load, etc.
Logstash is an open source tool for collecting, analyzing and storing logs.
Kibana is also an open source and free tool. Kibana can provide log analysis friendly Web interface for Logstash and Elastic Search, which can aggregate, analyze and search important data logs.
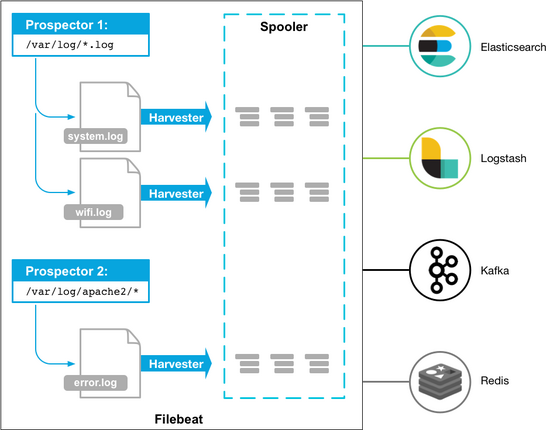
Beats is an open source agent of elastic search company for collecting monitoring data of the system. It is the collective name of the data collector running as a client on the monitored server. It can send data directly to Elastic search or through Logstash to Elastic search, and then carry out subsequent data analysis activities. Beats consist of the following components:
1.Packetbeat: A network packet analyzer that monitors and collects network traffic information.
Packetbeat sniffs traffic between servers, parses application layer protocols, and associates them with message processing. It supports ICMP (v4 and v6), DNS, HTTP, Mysql, PostgreSQL, Redis, and
MongoDB, Memcache and other protocols;
2. Filebeat: Used to monitor and collect server log files, it has replaced logstash forwarder;
3. Metricbeat: Regular access to external system monitoring indicators, which can be monitored and collected
Apache,HAProxy,MongoDB,MySQL,Nginx,PostgreSQL,
Redis, System, Zookeeper and other services;
4. Winlogbeat: Used to monitor and collect log information of Windows system;
5. Create your own Beat: Custom beats, if the above indicators can not meet the needs, elastic Sarch encourages developers to use go language to expand the implementation of custom beats, just according to the template, to achieve monitoring input, log, output and so on.
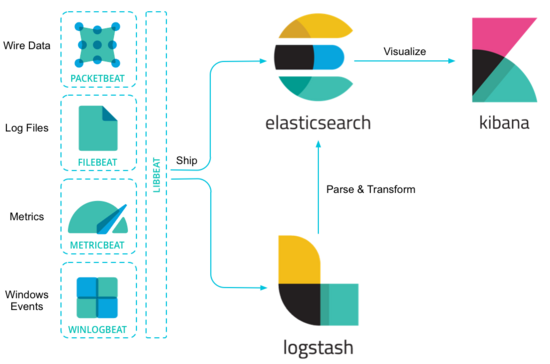
Beats send the collected data to Logstash, parsed and filtered by Logstash, and then send it to Elastic search storage, which is presented to users by Kibana.
Beats as a log collector consumes resources without Logstash as a log collector, which solves the problem that Logstash occupies high system resources on each server node.
Elastic Stack Official Download Address: https://www.elastic.co/downloads .
2. Open source real-time log analysis system Elastic Stack 5.0 deployment:
A. Installing Dependency Package JDK
Close the firewall
# cat /etc/selinux/config |grep -v "#"
SELINUX=disabled                       ##Close selinux
SELINUXTYPE=targeted
# systemctl stop firewalld                 ##Close the firewall
Download and install JDK
# wget http://dl.fedoraproject.org/pub/epel/epel-release-latest-7.noarch.rpm
# yum install jre ##Here I only install the jre environment, which is also available
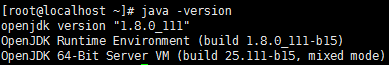
# java -version
openjdk version "1.8.0_111"
OpenJDK Runtime Environment (build 1.8.0_111-b15)
OpenJDK 64-Bit Server VM (build 25.111-b15, mixed mode
B. Install Elastic search
Download and install elastic search
# rpm --import https://artifacts.elastic.co/GPG-KEY-elasticsearch
# cat > /etc/yum.repos.d/elasticsearch.repo <<EOF
[elasticsearch-5.x]
name=Elasticsearch repository for 5.x packages
baseurl=https://artifacts.elastic.co/packages/5.x/yum
gpgcheck=1
gpgkey=https://artifacts.elastic.co/GPG-KEY-elasticsearch
enabled=1
autorefresh=1
type=rpm-md
EOF
# yum install elasticsearch
# systemctl start elasticsearch
# systemctl status elasticsearch
# /usr/share/elasticsearch/bin/elasticsearch -V      ##View the elastic search version
Version: 5.0.1, Build: 080bb47/2016-11-11T22:08:49.812Z, JVM: 1.8.0_111
Note: The following problems occurred after installation, which made elastic search unable to start
# systemctl status elasticsearch
OpenJDK 64-Bit Server VM warning: If the number of processors is expected to increase from one, then you should conf...CThreads=N
OpenJDK 64-Bit Server VM warning: INFO: os::commit_memory(0x0000000085330000, 2060255232, 0) failed; error='Cannot a ...'(errno=12)
# There is insufficient memory for the Java Runtime Environment to continue.
# Native memory allocation (mmap) failed to map 2060255232 bytes for committing reserved memory.
# An error report file with more information is saved as:
# /tmp/hs_err_pid11084.log
Solve:
Configure jvm.options under elastic search:
# vi /etc/elasticsearch/jvm.options
-Xms4g ##Enable the following two items
-Xmx4g
##-Xms2g ##Close the following two items
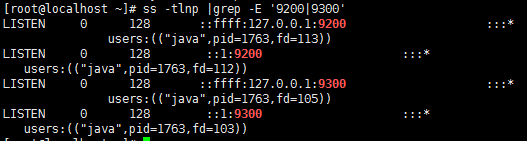
##-Xmx2g(2) The default HTTP port of Elastic Search external service is 9200, and the TCP port of interaction between nodes is 9300.
# ss -tlnp |grep -E '9200|9300'
(3) Testing services
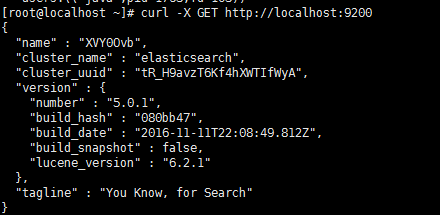
# curl -X GET http://localhost:9200
{
  "name" : "XVY0Ovb",
  "cluster_name" : "elasticsearch",
  "cluster_uuid" : "tR_H9avzT6Kf4hXWTIfWyA",
  "version" : {
    "number" : "5.0.1",
    "build_hash" : "080bb47",
    "build_date" : "2016-11-11T22:08:49.812Z",
    "build_snapshot" : false,
    "lucene_version" : "6.2.1"
  },
  "tagline" : "You Know, for Search"
}
You can also test with the following commands
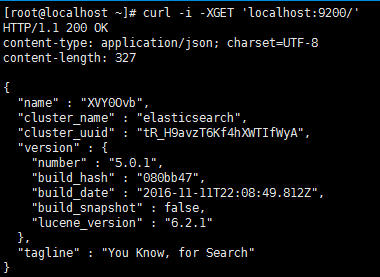
# curl -i -XGET 'localhost:9200/'
HTTP/1.1 200 OK
content-type: application/json; charset=UTF-8
content-length: 327
{
  "name" : "XVY0Ovb",
  "cluster_name" : "elasticsearch",
  "cluster_uuid" : "tR_H9avzT6Kf4hXWTIfWyA",
  "version" : {
    "number" : "5.0.1",
    "build_hash" : "080bb47",
    "build_date" : "2016-11-11T22:08:49.812Z",
    "build_snapshot" : false,
    "lucene_version" : "6.2.1"
  },
  "tagline" : "You Know, for Search"
}
C. Install Logstash
# rpm --import https://artifacts.elastic.co/GPG-KEY-elasticsearch
# cat > /etc/yum.repos.d/logstash.repo <<EOF
[logstash-5.x]
name=Elastic repository for 5.x packages
baseurl=https://artifacts.elastic.co/packages/5.x/yum
gpgcheck=1
gpgkey=https://artifacts.elastic.co/GPG-KEY-elasticsearch
enabled=1
autorefresh=1
type=rpm-md
EOF
# yum install logstash
# systemctl start logstash
# systemctl status logstash
# /usr/share/logstash/bin/logstash -V                ##View the logstash version
logstash 5.0.1
D. Installing Kibana
Installation of Kibana
# rpm --import https://artifacts.elastic.co/GPG-KEY-elasticsearch
# cat > /etc/yum.repos.d/kibana.repo <<EOF
[kibana-5.x]
name=Kibana repository for 5.x packages
baseurl=https://artifacts.elastic.co/packages/5.x/yum
gpgcheck=1
gpgkey=https://artifacts.elastic.co/GPG-KEY-elasticsearch
enabled=1
autorefresh=1
type=rpm-md
EOF
# yum install kibana
# systemctl start kibana
# systemctl status kibana
# /usr/share/kibana/bin/kibana -V                   ##View kibana version
5.0.1
(2) Simply change the following configuration
# cat /etc/kibana/kibana.yml |grep -v "#"
server.host: "192.168.147.128"
(3) Testing services
# ss-tlnp | grep 5601 # # Kibana default process name: node, port 5601

Browser input http://localhost:5601
E, Beats Installation Deployment
Installation and deployment of Filebeat
Install Filebeat
# curl -L -O https://artifacts.elastic.co/downloads/beats/filebeat/filebeat-5.0.1-x86_64.rpm
# rpm -ivh filebeat-5.0.1-x86_64.rpm
# systemctl start filebeat
# systemctl status filebeat
# filebeat.sh -version                       ##View Version
filebeat version 5.0.1 (amd64), libbeat 5.0.1
Configuring Filebeat
# cp /etc/filebeat
# cp filebeat.yml filebeat.yml.bak
# vi /etc/filebeat/filebeat.yml            ##Configure filebeat
#============= Filebeat prospectors ===============
filebeat.prospectors:
- input_type: log
  paths:
    - /var/log/*.log
#==================== Outputs =====================
#------------- Elasticsearch output ---------------
output.elasticsearch:
  # Array of hosts to connect to.
  hosts: ["localhost:9200"]
#---------------- Logstash output -----------------
output.logstash:
  # The Logstash hosts
  hosts: ["localhost:5043"]                   ##Just configure it, and the other defaults will do.

# filebeat.sh -configtest -e     ##Verify configuration files
Configuring Logstash
# cat /etc/logstash/conf.d/logstash.conf
input {
beats {
port => "5043"
}
}
filter {
grok {
match => { "message" => "%{COMBINEDAPACHELOG}"}
}
geoip {
source => "clientip"
}
}
output {
elasticsearch {
hosts => [ "localhost:9200" ]
}
}
# systemctl restart logstash ##Restart logstash
# /usr/share/logstash/bin/logstash -f /etc/logstash/conf.d/logstash.conf --config.test_and_exit ##Verify configuration files
Sending Logstash logs to /var/log/logstash which is now configured via log4j2.properties
Configuration OK
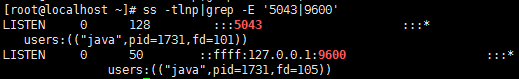
# ss -tlnp|grep -E '5043|9600'
(4) Configuring kibana
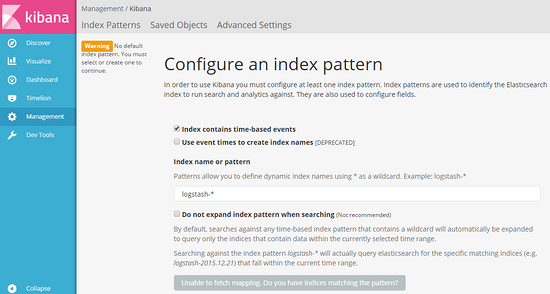
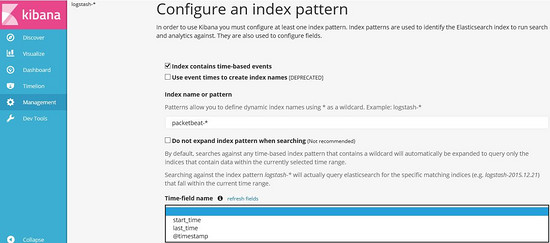
The browser enters http://localhost:5601 and configures the index of filebeat (just enter filebeat-*).
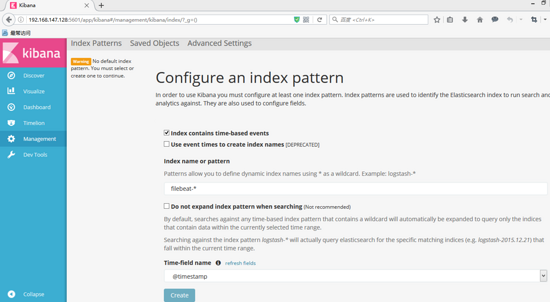 In the first box, enter filebeat - * and wait a moment. kibana will recognize it automatically. After OK, the button below will change from gray to "Create" as shown in the figure above. After clicking the button, the final image will be shown as follows:
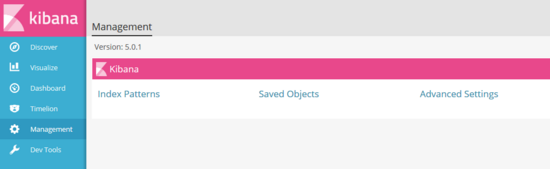
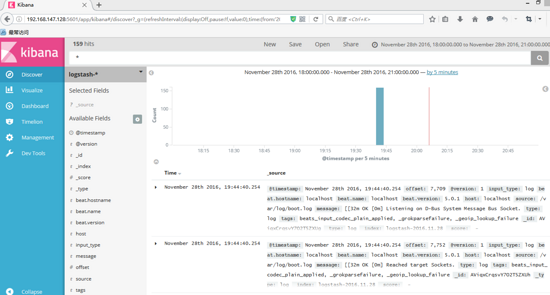
 We'll go ahead and create a new index for logstash, and browser input. http://localhost:5601 Click "Management" ===> in the left column and then click "index"
Patterns"===>
We'll go ahead and create a new index for logstash, and browser input. http://localhost:5601 Click "Management" ===> in the left column and then click "index"
Patterns"===>
 ===> Then click "Add New"===>
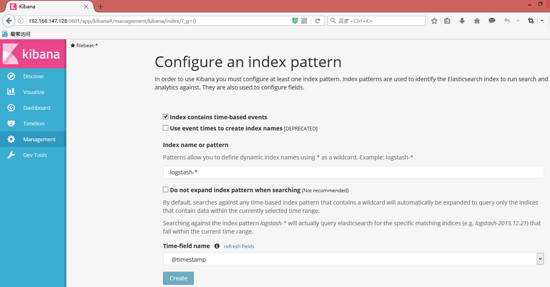
===> Click on the "Crete" button to create the logstash index. When the creation is completed, it will show as follows:
b. Install and deploy Packetbeat
Installation and configuration of Packetbeat
# yum install libpcap
# curl -L -O https://artifacts.elastic.co/downloads/beats/packetbeat/packetbeat-5.0.1-x86_64.rpm
# rpm -ivh packetbeat-5.0.1-x86_64.rpm
# cat /etc/packetbeat/packetbeat.yml
==================== Network device ===================
packetbeat.interfaces.device: any ##Capture all network interfaces that send or receive messages
======================== Flows ========================
packetbeat.flows:
  timeout: 30s
  period: 10s
================== Transaction protocols ==============
##The following are the main protocols and ports that packetbeat supports by default
packetbeat.protocols.icmp:
  enabled: true
packetbeat.protocols.amqp:
  ports: [5672]
packetbeat.protocols.cassandra:
  ports: [9042]
packetbeat.protocols.dns:
  ports: [53]
  include_authorities: true
  include_additionals: true
packetbeat.protocols.http:
  ports: [80, 8080, 8000, 5000, 8002]
packetbeat.protocols.memcache:
  ports: [11211]
packetbeat.protocols.mysql:
  ports: [3306]
packetbeat.protocols.pgsql:
  ports: [5432]
packetbeat.protocols.redis:
  ports: [6379]
packetbeat.protocols.thrift:
  ports: [9090]
packetbeat.protocols.mongodb:
  ports: [27017]
packetbeat.protocols.nfs:
  ports: [2049]
========================= General =========================
========================= Outputs =========================
------------------- Elasticsearch output ------------------
output.elasticsearch:
  hosts: ["localhost:9200"]
--------------------- Logstash output ---------------------
output.logstash:
  hosts: ["localhost:5043"]                ##Just configure it, and the other defaults will do.
============================= Logging =====================
(2) Verify configuration and start packetbeat
# packetbeat.sh -version                         ##SeepacketbeatEdition
packetbeat version 5.0.1 (amd64), libbeat 5.0.1
# packetbeat.sh -configtest -e                          ##Test configuration file
......
Config OK
# systemctl start packetbeat
# systemctl status packetbeat
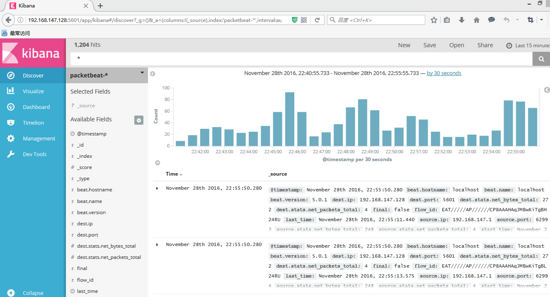
Configure Kibana (new packetbeat index)
In http://localhost:5601 Enter "packetbeat-*" on the new index page, and kibana will automatically update it at "Time-field" Choose "@timestamp" from the three options below "name" and click "Create" to create it.
After creation, kibana is shown as follows:
c. Install and deploy Metricbeat
Installation and configuration metricbeat
# curl -L -O https://artifacts.elastic.co/downloads/beats/metricbeat/metricbeat-5.0.1-x86_64.rpm
# rpm -ivh metricbeat-5.0.1-x86_64.rpm
# cat /etc/metricbeat/metricbeat.yml
=================  Modules configuration =================
metricbeat.modules:
---------------------- System Module ---------------------
- module: system
  metricsets:
    - cpu
    - load
    - filesystem
    - fsstat
    - memory
    - network
    - process
  enabled: true
  period: 10s
  processes: ['.*']
========================= General =======================
========================= Outputs =======================
------------------- Elasticsearch output ----------------
output.elasticsearch:
  hosts: ["localhost:9200"]
--------------------- Logstash output -------------------
output.logstash:
  hosts: ["localhost:5043"]               ##Simply configure this item, other defaults will do.
======================= Logging =========================
(2) Verify configuration and start metricbeat
# metricbeat.sh -version                           ##View version information
metricbeat version 5.0.1 (amd64), libbeat 5.0.1
# metricbeat.sh -configtest -e                     ##Verify configuration files
# systemctl start metricbeat
# systemctl status metricbeat
(3) Configure kibana (new metricbeat index)
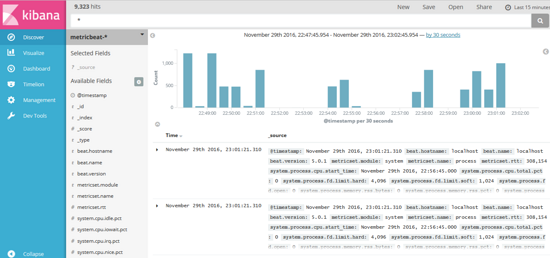
Enter "metricbeat-*" on the newly created index page at http://localhost:5601, and kibana will automatically update. Select "@timestamp" under "Time-field name" and click "Create" to create it.
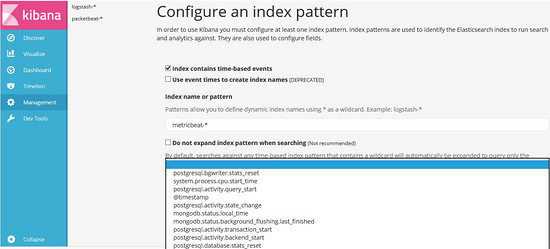
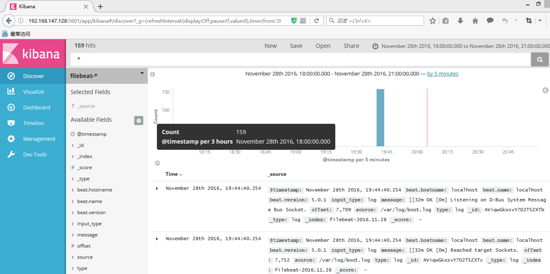
Finally, the following figure is presented:
Note 1:
Some query statements about ELK Stack:
1. Query filebeat
# curl -XGET 'http://localhost:9200/filebeat-*/_search?pretty'
(2) Query packetbeat
# curl -XGET 'http://localhost:9200/packetbeat-*/_search?pretty'
(3) Query metricbeat
# curl -XGET 'http://localhost:9200/metricbeat-*/_search?pretty'
(4) Query cluster health
# curl 'localhost:9200/_cat/health?v'
View the list of nodes
# curl 'localhost:9200/_cat/nodes?v'
ip        heap.percent ram.percent cpu load_1m load_5m load_15m node.role master name
127.0.0.1           37          93   3    0.05    0.07     0.41 mdi       *      XVY0Ovb
List all indexes
# curl 'localhost:9200/_cat/indices?v'
health status index                 uuid                   pri rep docs.count docs.deleted store.size pri.store.size
yellow open   filebeat-2016.11.28   Mn4MzxdTRaCj9iseutcmqA   5   1          2            0       12kb           12kb
yellow open   filebeat-2016.11.29   iMrr710mT42mApxdV62k-A   5   1        159            0     65.9kb         65.9kb
yellow open   packetbeat-2016.11.29 wkTcIwD6RgiiCFwlWBIILA   5   1       5652            0      1.6mb          1.6mb
yellow open   customer              NvxXLgHoREefJLRhot13Ug   5   1          0            0       800b           800b
yellow open   packetbeat-2016.11.28 Beoe07S7QB-dntNV4nxJNQ   5   1       2446            0    676.4kb        676.4kb
yellow open   test                  M7WbkYq2QNmeJ9NOyMfMZA   5   1          0            0       800b           800b
yellow open   logstash-2016.11.28   pcb_84ChSBe9A7VRd-SQNw   5   1        161            0    123.2kb        123.2kb
yellow open   metricbeat-2016.11.29 AmVeT1xCQGCnxlAFXUxhYw   5   1      94459            0     37.6mb         37.6mb
yellow open   logstash-2016.11.29   6PCKMYKCSVmPfdg-Sx2ARA   5   1      85772            0     20.3mb         20.3mb
yellow open   .kibana               QYTg0I5KS-yc3d7GSey3Zw   1   1          5